Computational modeling of steel iber reinforced
concrete beams subjected to shear
Modelagem computacional de vigas de concreto armado
reforçado com ibras de aço submetidas a cisalhamento
D. L. ARAÚJO a
L. C. CARMO b [email protected]
F. G. T. NUNES c
R. D. TOLEDO FILHO d
a Associate Professor, Pos-Graduate Program in Geotechnical Engineering and Civil Construction - School of Civil Engineering – Federal University
of Goiás, [email protected], Praça Universitária, s/n, Setor Universitário, 74605-220, Goiânia, GO;
b M.Sc. Degree, School of Civil Engineering – Federal University of Goiás, [email protected], Praça Universitária, s/n, Setor Universitário, 74605-220,
Goiânia, GO;
c M.Sc. Degree, School of Civil Engineering – Federal University of Goiás, [email protected], Praça Universitária, s/n, Setor Universitário, 74605-220,
Goiânia, GO;
d Associate Professor, COPPE/UFRJ, [email protected], Caixa Postal 21945-970, Rio de Janeiro, RJ. Received: 28 Feb 2009 • Accepted: 12 May 2009 • Available Online: 30 Mar 2010
Abstract
Resumo
Computational modeling has become a common activity to Civil Engineering researchers and professionals. Therefore, the knowledge about the mechanical behavior of materials is very important. To correctly model the mechanical behavior of concrete structures subjected to shear stress, it is necessary to determine the shear retention factor that accounts for the friction between the two surfaces of a crack.
The objective of this study is to show how the shear retention factor of steel iber reinforced concrete can be obtained from direct shear
tests associated to computational modeling. A concrete matrix with compressive strength of 60 MPa, to which 1% and 2% content of steel
ibers were added, was used for the shear tests. The stress-slip relationship was obtained from these tests, and the shear retention fac-tor of the steel iber reinforced concrete was determined from inverse analysis using the Finite Element Method software DIANA© 8.1.2. Finally, the shear retention factor and the inluence of steel ibers on the cracks were validated from the computational modeling of steel iber reinforced concrete beams subjected to shear available in the literature.
Keywords: Shear, Steel Fiber Reinforced Concrete, Computational Modeling.
A modelagem computacional cada vez mais se torna parte integrante das atividades dos pesquisadores e proissionais da área de
engenharia civil. Para isso, o conhecimento do comportamento mecânico dos materiais é de fundamental importância. No caso das es
-truturas de concreto submetidas a esforços de cisalhamento, para a correta representação do seu comportamento é necessária a deter-minação do fator de retenção do cisalhamento. Neste trabalho, procura-se determinar esse fator para concretos reforçados com ibras de aço por meio de ensaios de cisalhamento direto em corpos-de-prova prismáticos associados à modelagem computacional. Foi estudada, em laboratório, uma matriz de concreto com resistência à compressão de 50 MPa, à qual foram adicionadas 1,0% e 2,0% de ibras de
aço. A relação tensão versus deslizamento foi determinada experimentalmente, sendo em seguida realizada uma análise inversa dos
corpos-de-prova de modo a se determinar o fator de retenção do cisalhamento do concreto reforçado com ibras de aço. Para tanto, foi utilizado o programa comercial de elementos initos DIANA© 8.1.2. Ao inal, o fator de retenção do cisalhamento, bem como a inluência das ibras na issuração, foi validado por meio da modelagem de vigas de concreto armado reforçado com ibras de aço submetidas a
esforços de cisalhamento disponíveis na literatura.
1. Introduction
The use of software has become essential for engineers and re -searchers who develop formulations and numerical codes that simulate the behavior of structures in order to obtain parameters that ensure economy, safety, and agility of structural designs. The numerical analysis of reinforced concrete is particularly com -plex. Being a composite material, the reinforced concrete has char
-acteristics that make dificult the reproduction in a computational
environment all variables present in a service life of the structures, such as multiple cracks and reinforcement slip. Hence, approxima
-tions are used and most of the times they fulill structural project
needs (safety and economy).
Speciically, regarding the numerical study of the shear stress on
the reinforced concrete structures, there is a number of theoretical
and experimental studies on concrete beam subjected to shear
[1-3] although numerical studies on this subject are not so common. Most of the studies about computational modeling of concrete
structures deals with lexion problems [4], and numerical models
to shear available do not detail stress and strain distributions along the structure, nor do they provide details on the cracking patterns. The numerical models available for the treatment of concrete struc
-tures are based on the Finite Element Method (FEM) [5]. On FEM models, the cracking analysis can be classiied as smeared crack
model or discrete crack model.
The discrete crack model is the most reined model, and it is more
adequate when there is a small number of cracks in the structure.
Nevertheless, the dificulty in using such model lies on locating the
crack propagation route and the need of reorganizing the continu -ous mesh as they progress. The most commonly used model is the cohesive crack model developed by Hillerborg [6] for mode I
fracture of quasi-brittle materials (such as concrete), which was later adapted to the mixed-mode fracture (modes I and II) [7].
In the smeared crack model, pioneer in the crack analysis [8], a great number of parallel cracks, which present theoretically tiny
openings, are smeared over the inite-element mesh that
model-ing the continuous media, which does not change with the crack propagation. This propagation is simulated with the softening of the
continuous media material; hence the cracks can be ixed (deined
orientation angle) or rotated (variable orientation angle). Research -ers state that the model with rotated cracks tends to be more stable
than the model with ixed cracks [9]. The smeared crack model is
the most common due to the simplicity of cracks. However, it pres -ents some solution convergence problems, so some mathematical
adjustments of the constitutive models are necessary. Since the
method does not consider the cracks discrete entities, it prevents the direct determination of the crack tip opening (dimension per -pendicular to the propagation direction).
Using the commercial inite element software DIANA© 8.1.2 [10], this paper shows a numerical study on the steel iber reinforced
concrete subjected to shear adopting the smeared crack model.
The software DIANA© allows a consideration of embedded steel
reinforcement in the continuous, therefore, the reinforcement in
concrete beams can be analyzed as inite element of bars enabling
the determination of stress and strain on them. To represent the shear stress transfer across the cracks, the shear retention factor is applied, and its value is obtained from inverse analysis of the direct shear tests.
2. Models to computational modeling
of concrete subjected to shear
This section presents briely some of the numerical models used
for the computational modeling of concrete using the commercial
software DIANA© 8.1.2 [10], which is based on the inite element
method for the analysis of several different structures. The con -crete constitutive models include cracking effects and embedded steel reinforcement, or a combination of them. Moreover, the soft -ware allows the analysis of other complex phenomena such as creep, curing, temperature, and instability.
The software includes two models for modeling the structural be -havior of the cracked concrete: smeared crack model and the dis -crete crack model. Concepts of the fracture mechanics are intro -duced, so that the results become independent of the mesh used. The main parameters related to the fracture mechanics introduced in the smeared crack model are the fracture energy (
G
If), the compressive fracture energy (c
G
) and crack bandwidth. Besides,the software DIANA© allows the use of the CEB-FIP Model Code 1990 [11] and of curves deined by the user. The crack bandwidth
(hcr) should correspond to a representative dimension of the mesh elements, and it depends on the shape and kind of the element. The smeared crack model determines the crack tip opening and ori
-entation in a speciic region using “Incremental Plastic Models” and “Total Strain Crack Models”. The Total Strain models describe the
ten-sile and compressive behavior of a material with one stress–strain relationship. Thus, it is very well suited for analyses which are pre -dominantly governed by cracking or crushing of the material and it
is represented by the Rotating Crack Model and by the Fixed Crack
Model. In the formulation of the Incremental Plastic Models, the con -cepts of the theory of plasticity are used classifying the strains as elas
-tic (reversible) and plas-tic (irreversible). The Multi-Directional Crack Model, which represents this formulation in the DIANA© software, presents advantages for modeling bi-dimensional problems [10].
It is natural to consider that the material shear rigidity reduces due to cracking, which is represented by the shear retention factor. The
DIANA© software offers three different relations to deal with this
effect: full shear retention, constant shear retention, and variable shear retention. In the full shear retention, the elastic shear modu -lus (G) is not reduced, which implies that the secant crack shear
stiffness is ininite. In case of reduced shear stiffness, the shear retention factor β is less or equal to one, but greater than zero.
Considering the variable shear retention, the shear retention factor is a function of the crack tip opening [10].
The reinforcement of concrete structures can be modeled using an
embedded reinforcement. Such elements enable the deinition of
discrete reinforcement (active or passive bars) and distributed rein
-forcement (or grid rein-forcement) in bi-dimensional and
tri-dimen-sional structures. With those elements, it is considered the perfect bond between the concrete and the reinforcement, i.e., there is no
slip between them. For some analyses, the reinforcement can be
modeled by truss elements and connect them to the surrounding concrete via structural interface elements. The interface elements
can be modeling the bond-slip effect.
-developed on the 28th day. The mix proportions per cubic meter of concrete are given in table 1. Different amount of Dramix® RC 65/35 BN steel ibers (1.0% and 2% which is equivalent to 79 kg/m3 and 157 kg/m3, respectively) with tensile strength of 1150 MPa were added to the matrix. The steel ibers were hooked ends with length of 35 mm and aspect ratio of 65. The amount of 2.5%, in volume of concrete, of the Wollastonite micro-ibers was also added to the matrix. These micro-ibers work as the reinforcement required in the irst steps of the matrix cracking. The cement used was CP III 40 RS and the ine aggregate was natural sand, with maximum size of 4.8 mm, and the coarse aggregate was 12.5 mm maximum size. The mixtures were
produced in a planetary concrete mixer and the specimens were kept in a wet chamber until the conduction of the test.
The hardened concrete with and without ibers were characterized
to compressive strength (fcm), according to the Brazilian Standard
NBR 5739 [12], and to tensile splitting strength (fctm,sp) according
to Brazilian Standard NBR 7222 [13]. The tests were conducted in cylindrical specimens with 150 mm diameter and 300 mm height.
3.2 Direct shear test
The specimens used in these tests were 150 mm (width) x 150 mm
(height) x 600 mm (long). The objective of this test was to deter
-mine the shear stress-slip relationship of the steel iber reinforced concrete and thus verify the inluence of the ibers on the shear
strength and ductility of the concrete.
tion of the inite element used in the analysis is know, the strain ield throughout the element can be determined. For a inite element with a linear interpolation function, the strain ield throughout the element is
constant. Therefore, the crack tip openings can be estimated by multi -plying the strain at Gauss points by the distance between those points.
If the shear crack inclination is 45°, which is plausible for beams without
transverse reinforcement, the distance on the diagonal between the
Gauss points (considering a rectangular inite element) can be taken.
This procedure can be extrapolated; in such an event, the distance on
the diagonal between the inite element nodes in question is taken.
3. Materials and Experimental Procedure
3.1 Materials
distance of 149 mm from one external side to another. The
speci-men was placed on another rigid metallic block with two choppers
of 20 mm thickness and 150 mm length and placed at a distance of 159 mm from one internal side to another.
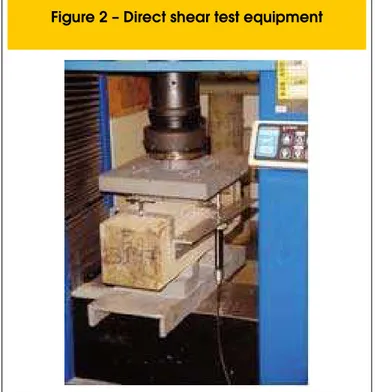
The vertical displacement of the central region between the grooves was measured by a linear position transducer of maximum
displacement length of 100 mm. Such displacement represents the average displacement of the two shear plans (igure 1). The tests
were conducted under displacement control using a universal elec
-tromechanical testing machine of 1000 kN capacity (igure 2).
4. Results
Table 3 shows the maximum load (Fmax) and the maximum shear
strength (τu) on the specimens. Those values were divided by two, i.e., by the number of shear plans. On average, the addition of 1% and 2%
amount of ibers increased the shear strength in approximately 110%
and 133%, respectively, when compared to the matrix. This table also shows the correlation constant, k, between the average shear stress and the concrete average compressive strength as follows.
There is an increase in the value of the constant k with the increase
of the volume of the ibers and the concrete compressive strength. This is due to the increased volume of the ibers present in the
mixture as well as to the increased compressive strength of the
iber reinforced concrete.
Figure 3 shows the load versus slip curves of the specimens. Analyzing the specimens without ibers, it can be seen a irst peak load, which refers to
the crack in the shear plan (matrix rupture), and a second peak load, which refers to the rupture of the specimen. This shear strength increase even after the shear crack is due to the aggregate interlock along the shear plan. The increase of strength due to the aggregate interlock in the tests showed
dispersion for the four specimens (20%, 10%, 58% e 74%).
Table 2 shows the nomenclature of specimens and the volume
fraction of the iber added. Identical specimens were made for the tests with iber reinforced concrete, and four specimens were made for the tests without ibers.
The tests were based on previous studies reported in the literature
[14]. The specimens were sawed at 15 mm along the perimeter
of the transversal section in the region where a shear crack was expected. Hence, the dimension of the shear strength section was
120 mm x 120 mm (Figure 1).
In this test, the load was applied using a metallic block with two
The inluence of the ibers can also be noted from the test results. In the specimens without ibers, it is not observed a softening curve after the shear strength is reached. The addition of ibers increases sensibly
the shear strength. Moreover, when the peak load was reached, it is ob
-served a notable softening response of the specimen due to the ibers. It
is observed, also, the abrupt decrease around 60% in the shear strength
after the peak load in the mixture with 1% iber amount while in the mix-ture with 2% iber amount, this abrupt decrease was around 50%.
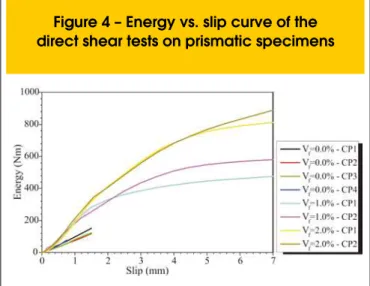
From the curves shown in Figure 3, the energy dissipated for a speciic slip value can be determined for each test. Computing the
energy for different slip values in the shear plan allowed the design
of the curves shown in igure 4. These curves represent the energy dissipated by the shear plan for each speciic slip. The toughness
of the material is greater as much as the more energy dissipated.
151%, respectively, when compared to the mixture without ibers. After this slip value, only the specimens with ibers could bear load. For the slip of 7 mm, the mixture with 2.0% iber amount dissipated 61% more energy than the mixture with 1.0% iber amount.
5. Computational modeling
5.1 Direct Shear tests
Firstly, the direct shear tests described in section 3.2 were modeled in the Finite Element Method software DIANA© 8.1.2 in order to determine the shear retention factor (β) for both the plain and the iber reinforced concrete. For that reason, a bi-dimensional modeling was applied con-sidering the Multi-Directional Crack Model with the smeared cracking
included in the software [10]. It is worth mentioning that due to the de
-ined fracture plan of the specimens, the discrete crack model could be
adequate. Nevertheless, the smeared crack model was adopted due
to the dificulty in modifying the mesh when the discrete crack model is applied to the modeling of structures without a deined fracture plan.
One of the most important parameters for the modeling is the ten
-sile behavior of the concrete. It is dificult to determine a ten-sile
behavior, including the tension softening, from the experimental tests; hence it was obtained here through the inverse analysis
of the third-point bending tests in prismatic specimens using the DIANA© 8.1.2 software. The methodology used to obtain this curve had been previously described by the authors in other studies [15]. From the inverse analysis, the bilinear tension softening curve was deined, which proved more adequate to represent the iber rein-forced concrete used in this paper. Figure 5 shows a typical stress-strain curve. Table 4 shows the parameters of this curve for each iber amount analyzed.
In order to represent the behavior of the concrete without ibers, a
linear tension softening was used to represent the tensile behavior
and a parabolic hardening/softening curve was used to represent the compression behavior, as shown in igure 6. The fracture
en-ergy ( I f
G
) was obtained from the CEB-FIP Model Code 1990 [11]expressions. The compressive fracture energy ( c
G
) was obtainedfrom the stress-strain relationship deined in CEB-FIP Model Code 1990 [10] to concrete in compression.
A study of the inluence of the shear retention factor (β) on the
direct shear response from the computational modeling was con -ducted. Accordingly, the following shear retention factor values
were adopted 0; 0.005; 0.010; 0.050; 0.100; 0.150; 0.200; 0.500; and 1.000. For this analysis, the stress-slip curves of the direct
shear tests were compared.
Figure 7 shows the experimental curves and those obtained from the computational modeling. For the specimens without ibers, it seems to be little inluence of the shear retention factor since the maximum load varied within the range 100 kN to 160 kN when the β factor varied from 0 to 1. Such variation range is in accordance with that observed
for the maximum load in the direct shear tests of the specimens with
-out ibers. The shear retention value of 0.01 was chosen providing a force of 150 kN for the maximum slip of 0.4 mm.
The modeling results of the direct shear specimens with ibers do
not represent the experimental curve completely. In addition, strong
inluence of the shear retention value on the softening response of
the numerical model could be observed. A possible reason for that is due to the other resistant mechanisms that are present on the mode II of fracture concrete and which contribute more to the shear strength of those specimens. The most important of these mecha
opposite sides of the shear crack that cannot be represented in a smeared crack model considering only the mode I of the fracture
concrete. Hence, the shear retention factor of the iber reinforced
concrete was reevaluated trough the computational modeling of reinforced concrete beams available in the literature.
5.2 Reinforced concrete beams
Once the direct shear specimens with and without ibers were ready,
six reinforced concrete beams reported in the literature [16] were
modeled. Figure 8 shows a scheme of those beams and the
load-ing system used to promote a diagonal shear failure. Two beams were made of plain concrete and four beams were made of steel
iber reinforced concrete. One of the plain concrete beams did not have a transverse reinforcement (V-0-0.0) and the other had 0.21% of transverse reinforcement (V-1-0.21). The beams with ibers were reinforced with different amount of ibers (1% and 2%). Two beams with 1% iber content were tested; one without transverse reinforce-ment (V-1-0.0) and the other with 0.21% of transverse reinforcereinforce-ment (V-1-0.21). Similarly, two beams with 2% iber content were tested; one without transverse reinforcement (V-2-0.0) and the other with 0.21% of transverse reinforcement (V-2-0.21).
An eight-node isoparametric solid brick element (HX24L) was used
for modeling the beams. This element is based on linear interpola -tion which enable that the nodal displacement vary linearly. The strain and stress distribution over the element volume are constant in one direction and vary linearly in normal directions. A 2x2x2
Gauss numerical integration schemes was adopted. This element has three degrees of freedom (translation) per node [10].
The embedded reinforcement element was used to represent the longitudinal and transverse reinforcements. This element is em -bedded inside the beam disregarding the slip between the rein -forcement and the concrete. Thus, the compatibility of the nodes displacement is guaranteed resulting in a perfect bonding model between the reinforcement and the concrete.
The Total Strain model with ixed crack was used to represent the concrete. The tensile behavior of concrete without ibers was
modeled using a linear tension softening, and a bilinear tension
softening was used to represent the tensile behavior of the iber reinforced concrete. For compression, a parabolic
hardening/soft-ening curve was used. The parameters in this model are: the ten -sile and compressive strength, the fracture energy ( I
f
G
), the com -pressive fracture energy (c
G
) and the shear retention factor (β),The compressive fracture energy was obtained from the stress-strain relationship deined in CEB-FIP Model Code 1990 [11] to concrete in compression. For the iber reinforced concrete beams, the complete stress-strain curve in tension is provided instead of
the fracture energy. The input parameters for the modeling of the
six reinforced concrete beams are shown in table 5.
Figure 9 shows the curves obtained from the computational
model-ing of the reinforced concrete beams. It also shows the curves ob -tained experimentally. It can be noted that the shear retention factor
(β) inluenced the response of the beams without ibers. There was
an increase in the stiffness and ultimate load of the beam with the in
-crease in the value of the factor β. The best approximation between the numerical and experimental curves occurred for the β value of 0.01 conirming the analysis performed for the direct shear
speci-mens. It is worth mentioning that the highest difference was found
between the curves of beams without ibers and stirrups (V-0-0), in
which there was a one single diagonal crack linking the support to
the loading point without a major beam cracking (igure 10). Analyzing the iber reinforced beams, it can be noted that there was little inluence of the shear retention factor (β) on both the
beams with and without stirrups. Therefore, it can be said that the
signiicant increase of the ultimate strain on the tension softening diagram caused by the ibers minimized the inluence of the shear
retention factor on the structure response. In that case, the best approximation between the numerical and experimental curves oc
-curred for the β value of 0.15. It is noteworthy to mention that the
highest difference observed between the curves of beams with 2%
iber amount and no stirrups (V-2-0) is due to problems found in the
tests with this beam, as mentioned in the literature [16].
Figure 11 shows the strain of the longitudinal reinforcement in the middle of the span obtained from the modeling. This igure also
shows the strain obtained experimentally. Again, it can be ob
-served a stronger inluence of the shear retention factor on the beams without ibers and lesser inluence on the iber reinforced
beams. In this case, however, it can be seen that the stiffness of the numerical response was greater than that observed in the ex -perimental curves for all beams. This is probably due to the sup
-posed perfect bonding between the longitudinal reinforcement and the concrete, which tends to stiffen the structure due to disregard the slip between the reinforcement and the concrete.
Figure 12 shows the strain of the stirrup that intercepts the larger opening diagonal crack obtained from the modeling. This igure
also shows the strain obtained experimentally. It could be observed that the numerical response was stiffer than the experimental re -sponse. This is due to the fact that there were principal diagonal cracks in all tested beams concentrating stress in the stirrup, a fact that could not be represented using the smeared crack model. Even though, the smeared crack model was adopted since it is dif
-icult to predict the crack path in a discrete crack model.
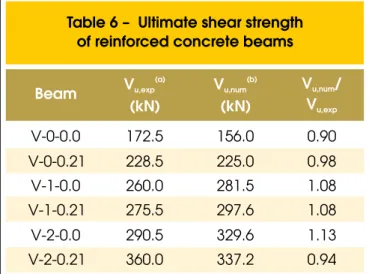
Table 6 shows the ultimate shear strength in beams obtained
experimentally and those of the computational modeling. Shear retention factor values of 0.01 and 0.15 were used for concrete without and with ibers, respectively. It is worth mentioning that the ultimate shear strength of the beam V-0-0 shown in this table is higher than that shown in igure 9. This occurred because the
displacement transducers that measured the displacements were withdrawn before the end of the test [16]. The average value of the ratio between the numerical and the experimental shear strength
was 1.021 with a standard deviation of 0.092. This indicates that
the computational modeling of this study represented the failure of the beams accurately.
The crack tip openings were then determined by the computational modeling and the values were compared to those obtained experi
-mentally. Table 7 shows those values in millimeters. The values in
parentheses indicate the load, in kN, at the moment the crack was determined for both the test and the computational modeling. The
cracks were evaluated for three levels of loadings, i.e., 40%, 60%,
and 100% for the ultimate load on each beam, approximately. In this table, the crack tip openings were calculated using the diagonal
distance between the inite element nodes chosen for the analysis. This choice was based on the inite element with the larger shear
crack tip opening. The experimental value was obtained from the
literature [16], and it is taken as close as possible to the inite
Generally, the numerically determined crack tip opening values shown in this table are closer to those measured in the tests for
all levels of loadings; except for the V-0-0 beam, without ibers and
stirrups, in which the numerically determined openings were rather lower than the experimental values. This is due to the failure pattern of this beam, which resulted in a single diagonal crack from the sup -port to the loading point without developing a multiple cracks. Thus, the smeared crack model was found to be inadequate to evaluate the cracking pattern of a plain concrete beam without stirrups.
This methodology to evaluate crack tip openings was initially ad -opted by the authors who studied reinforced concrete beams, with
-out ibers but with stirrups, subjected to shear, and it provided good approximation to the experimental values [17]. Although simple,
this methodology is useful for three dimensional structures. In his kind of structure, such as spillway columns and hydroelectric plant
spiral casings, the simpliications presents on the majority
Figure 13 shows the cracking patterns of the beams reinforced
with stirrups close to the failure obtained from the computational
modeling. The red lines indicate the greater opening cracks. It can
be seen that the failure of the beams without ibers and the ones with 1% iber amount (V-0-0.21 e V-1-0.21) were due to shear, as observed in the tests, whereas the 2% iber amount beam (V-2 -0.21) presented shear and bending cracks in the middle of the span, conirming the experimental observation once this beam
fail-ure is due to bending and not to shear.
6. Conclusions
This paperapproached computational modeling of iber reinforced
concrete beams subjected to shear using the Finite Element Method software DIANA© 8.1.2. The following conclusions can be drawn:
n The direct shear tests indicated that the steel ibers are
effective in increasing the shear strength of concrete. Adding
1% iber amount increased the ultimate shear strength of the concrete in 87% while adding 2% iber amount increased it in 99%. Moreover, the ibers provided a stable softening
behavior after peak load to the specimens enabling more energy dissipation.
n The modeling of the direct shear tests indicated an adequate
inforced concrete beams. On the other hand, the shear
stress-slip curve obtained from the tests to specimens with ibers could not be represented by the computational modeling once the resistant mechanism provided by the ibers
throughout the shear cracks was not represented in the modeling.
n The modeling of the reinforced concrete beams without ibers indicated the inluence of the shear retention factor (β) on
the beam strength. Generally, a value of 0.01 for this factor
is suggested since there is a small contribution of the crack shear strength on the shear strength of the structure. n The modeling of the reinforced concrete beams with steel
ibers indicated a small inluence of the shear retention factor (β) on the beam strength. In general, a value of 0.15 for
this factor is suggested. With this value, it was observed a good correlation between the numerical and experimental ultimate load of the beams. The ratio between these loads was
n The longitudinal reinforcement strain of the beams was adequately represented by the computational modeling despite the greater stiffness due to the supposed perfect bonding between the reinforcement and the concrete. On the other hand, the strain of the stirrups obtained from the modeling was smaller than that of the tests due to the failure pattern, i.e., there was a principal diagonal crack. This kind of failure could not be represented using a smeared crack model. n The modeling of the concrete beams also indicated a
considerable reduction in the crack tip openings with the
addition of steel ibers.
n The methodology proposed to evaluate the crack tip openings, based on the smeared crack model, was found adequate to represent the crack tip openings observed on the tests. This is particularly interesting due to the fact that lack of a standard expression for determining shear crack tip openings, unlike what occurs for bending cracks. Therefore, this modeling methodology can be useful in the design of structures, mainly those in which the shear stress are preponderant as well as those that do not present
one-dimensional behavior such as dams.
7 Acknowledgements
This work had inancial support provided by the ANEEL - National Agen-cy for Electric Power - the Brazilian Electricity Regulatory AgenAgen-cy. The
authors are grateful for the collaboration of Furnas Centrais Elétricas S.A. (a major state-owned company in electricity generation and trans -mission business in Brazil) for the laboratory use arrangements and the technicians who assisted with the test. The authors acknowledge the
contribution of Professor Leandro Vanalli during his fellowship status
as a fellow of the Desenvolvimento Cientíico Regional -UFG (Scientiic
Regional Development- Federal University of Goias).
8 References
[01] Vecchio, F.J.; Collins, M.P. The modiied compression ield theory for reinforced concrete elements subjected to shear. ACI Journal, n. 83, 1986, p.219-231. [02] Pang, X. B.; Hsu, T. T. C. Behavior of reinforced
concrete membrane elements in shear. Structural Journal of the American Concrete Institute, v.92, n.6, 1995, p.665-679.
[03] Hsu, T.T.C. Uniied approach to shear analysis and design. Cement and concrete Research, n. 20, 1998, p.419-435.
[04] Carmo, L.C. Ductilidade de vigas de concreto armado
convencional e de alta resistência reforçadas com
ibras metálicas: Análise via Método dos Elementos Finitos. 2005. 188 f. Dissertação (Mestrado em
Engenharia Civil) – Escola de Engenharia Civil,
Universidade Federal de Goiás, Goiânia.
[05] Gálvez J. C.; Cervenka J.; Cendón D. A.; Saouma V. A discrete crack approach to normal/shear
cracking of concrete strategy for problems in elasticity, plasticity, linear and nonlinear fracture
mechanics. Technical Report, Department of Civil
Engineering, University of Colorado, Boulder, and Electric Power Research Institute, Palo Alto, CA, 2002.
[06] Hillerborg, A.; Modéer, M.; Petersson, P. Analysis of crack formation and crack growth in concrete by
means of fracture mechanics and inite elements. Cement and concrete Research, n. 6, 1976, p.773–782.
[07] Reich, R., Cervenka, J., and Saouma, V.. Merlin: A three-dimensional inite element program based on a mixed-iterative solution strategy for problems
in elasticity, plasticity, and linear and nonlinear fracture mechanics.’ Technical report, Electric Power Research
Institute, Palo Alto, California, 1997.
[08] Cervenka, V. Inelastic inite element analysis of reinforced concrete panels under in-plane loads. PhD thesis, University of Colorado, USA, 1970. [09] Souza, R. A. Concreto estrutural: Análise e
dimensionamento de elementos com
descontinuidades. 2004. 442f. Tese (Doutorado
em Engenharia) – Escola Politécnica, Universidade
de São Paulo, São Paulo.
[10] TNO Building and Construction Research. DIANA User’s Manual – Release 8.1. Delft, Netherlands,
2001.
[11] COMITÉ EURO-INTERNATIONAL DU BÉTON. CEB-FIP Model Code 1990. London: Thomas Telford Services Ltd, 1993.
[12] ASSOCIAçãO BRASILEIRA DE NORMAS
TÉCNICAS. Concreto – Ensaio de compressão
de corpos-de-prova cilíndricos. NBR 5739. Rio de Janeiro, 1994.
[13] ASSOCIAçãO BRASILEIRA DE NORMAS
TÉCNICAS. Argamassa e concreto – Determinação da resistência à tração por compressão diametral de corpos-de-prova cilíndricos. NBR 7222. Rio de Janeiro, 1994.
[14] Mirsayah, A.A.; Banthia, N. Shear strength of steel iber-reinforced concrete. ACI Materials Journal, v. 99, n. 5, 2002, p. 473-479.
[15] Araújo, D.L.; Carmo, L.C.; Prado, A.A. Determinação da curva tensão-deformação à tração de concretos reforçados com ibras de aço via modelagem
computacional. In: CMNE 2007 Congresso de
Métodos Numéricos em Engenharia / XXVIII CILAMCE Congresso Ibero Latino-Americano sobre Métodos Computacionais em Engenharia, 2007,
Porto. Métodos Numéricos e Computacionais em
Engenharia - CMNE/CILAMCE. Porto, 2007. p. 1-16. [16] Nunes, F. G. T. Análise experimental de vigas de
concreto reforçado com ibras de aço submetidas a esforços de cisalhamento. 2006. Dissertação
(Mestrado em Engenharia Civil) – Escola de
Engenharia Civil, Universidade Federal de Goiás, Goiânia.
[17] Carmo, L.C.; Vanalli, L.; Araújo, D.L. Modelagem
numérica de vigas de concreto armado submetidas a cisalhamento. In: XXVII CILAMCE - Iberian
Latin American Congress on Computational Methods
in Engineering, 2006, Belém. Proceedings, 2006.