3D investigation of steel iber distribution in reinforced
concrete by X-ray microtomography
Investigação 3D da distribuição de ibras de aço em
concreto reforçado por microtomograia de raios X
a Programa de Engenharia Nuclear, Laboratório de Instrumentação Nuclear (LIN), COPPE/UFRJ, Rio de Janeiro, RJ, Brasil; b Programa de Engenharia Civil, Laboratório de Estruturas e Materiais (LabEST), COPPE/UFRJ, Rio de Janeiro, RJ, Brasil.
Abstract
Resumo
The efects of the inclusion of steel ibers in concrete have been widely studied in order to investigate possible changes in mechanical proper -ties, such as the increase in tensile strength, ductility, stifness, toughness (energy absorption capacity), and durability. An immediate conse -quence of this addition is the mitigation of concrete’s brittle behavior, so that the material meets new quality requirements. In this context, it is important to study the spatial distribution of the entire internal structure of these materials. Three-dimensional computed microtomography is a non-destructive inspection technique used to characterize the internal structures of various materials based on X-ray interaction with the inspected object. Topological and morphological properties can be obtained directly in three dimensions by means of mathematical reconstruc -tion of the radiographs, which allows analyzing, for example, porosity and distribu-tion of objects. In this context, the aim of this study is to investigate the spatial distribution of steel ibers, as well as of porosity in reinforced concrete samples. To this end, we used a microtomography system calibrated to operate at a voltage of 80 kV, electric current of 100 μA and a pixel size equal to 24 µm. The results showed low porosity and that the steel ibers were not uniformly distributed throughout the sample.
Keywords: X-ray, steel ibers, microtomography, porosity, concrete.
Os efeitos da inserção de ibras de aço em concretos têm sido amplamente estudados com o objetivo de investigar possíveis modiicações nas propriedades mecânicas, tais como, o aumento da resistência à tração, ductilidade, rigidez, tenacidade (capacidade de absorção de energia), e durabilidade. Uma das consequências imediatas dessa adição é a mitigação do comportamento frágil do concreto, de forma que o material passe a ter novas exigências de qualidade. Nesse contexto, é de grande importância o conhecimento espacial da distribuição de toda estrutura interna desses materiais. A microtomograia computadorizada tridimensional é uma técnica utilizada na caracterização de estruturas internas de diversos materiais, baseada na interação dos raios X com o objeto inspecionado, sendo considerado um ensaio não destrutivo. Propriedades morfológicas e topológicas podem ser obtidas diretamente em três dimensões através da reconstrução matemática das radiograias, o que possibilita analisar, por exemplo, a porosidade e a distribuição de diversos objetos. Nesse contexto, o objetivo desse trabalho é a investigação da distribuição espa -cial das ibras de aço, assim como da porosidade em amostras de concreto. Para tal, foi utilizado um sistema de microtomograia calibrado para operar com uma tensão de 80 KV, corrente elétrica de 100 µA e um tamanho de pixel igual a 24 µm. Os resultados mostraram uma porosidade baixa e que as ibras de aço não estão distribuídas uniformemente ao longo da amostra.
Palavras-chave: raios X, ibras de aço, microtomograia, porosidade, concreto.
A.C. MACHADO a
[email protected] M. A. SILVA a
[email protected] R. D. T. FILHO a
[email protected] M. S. PFEIL a
[email protected] I. LIMA a
[email protected] R.T. LOPES a
1. Introduction
Non-reinforced, simple concrete is a fragile material, brittle, with low strength and tensile elongation capacity, thus, the inclusion of steel ibers in its composition has been widely employed in the construction industry. This fact is widely observed in several ap -plications such as tunnel coatings, plant loors and concrete pipes, because tensile strength, ductility, toughness and durability are signiicantly improved with iber addition [1].
The function of discontinuous steel ibers, randomly distributed is bridging the cracks that are formed in the concrete under external loads or when temperature or humidity changes occur in the en -vironment. [2;3]. Steel ibers, when added to the concrete, hinder crack propagation due to their high elastic modulus. Because of the load-bearing capacity that the composite presents after crack -ing, the ibers allow stress redistribution in the material even when used in low amounts [4], so as to cause certain ductility after crack -ing. In this manner, if the ibers are resistant enough, well adhered to the cementitious matrix and in adequate amount, they help to maintain small crack openings, allowing the concrete to resist high tensile stresses, with a large strain capacity in the post-cracking stage [2; 3]. It should be highlighted that the level of stress that the iber transfers through the cracks depends on several factors such as iber length, amount (volume) and random distribution [4]. One of the issues involved in the durability of steel iber reinforced concrete, is that frequently the ibers do not receive corrosion pre
-ventive treatment. This fact turns concrete durability conditioned to its coninement and, due to the restriction of crack propagation pro -vided by the ibers, the resistance to the entry of aggressive agents in -creases with consequent increase of structure durability [4]. Concrete durability may be deined as the ability of concrete to resist weathering action, chemical attack, abrasion or any process of deterioration [5]. This deinition is directly related to concrete permeability, which in turn may be described as the ease of a luid to low through a mate -rial under a given pressure gradient. Thus, permeability is not merely a characteristic of the material, but it also refers to a driving force acting on the luid [6]. Therefore, we can say that a concrete with low permeability tends to prevent the entrance of aggressive agents into the matrix [7]. Another important parameter to assess concrete du -rability is porosity, which, besides having great inluence on concrete mechanical strength (the higher the porosity, the lower the strength) directly afects its durability. Total porosity may be deined as the volumetric ratio of void spaces in concrete [8]. In other words, the higher the permeability of concrete, the greater will be pore connec -tivity and therefore the material will be more susceptible to external actions directly increasing deterioration speed and consequently af -fecting concrete durability. Excellent quality concretes are those with porosity about 1% [9]. In addition to pore volume, pore shape and dimension also afect concrete resistance. In general, for the same value of total porosity, smaller size pores result inhigher strength of the hydrated cement paste [10].
Although steel ibers can actually improve concrete behavior, we must be realistic about what we can really expect from their perfor -mance, especially if the amount of ibers is small (less than 1% by volume), as usually occurs [2; 3].
In this context, quantifying the amount (volume) of steel ibers em -bedded in the concrete and analyzing its spatial distribution, be -comes animportant tool for quality assessment of this material. To this end, it is necessary to investigate its microstructure and sev -eral cutting-edge techniques are being developed such as acoustic emission, infrared thermography and 3D X-ray computed microto -mography (microCT) [11].
High resolution microCT is a valuable tool that enables the mor -phological and topological analysis of the internal structures of several types of materials such as iber reinforced concrete. MicroCT is a non-destructive test based on the physical principle of X-ray exponential attenuation when they interact with the object under study. The technique informs the distribution of the diferent phases in the material of interest [12]. The intensity of the transmitted, collimated X-ray beam that interacts with the object is recorded by a detector matrix placed on the opposite site to the source [13]. One of the great advantages of this technique is that it informs the internal structure of the object without submitting it to any kind of preparation method such as impregnation, thinning or polishing allowing quantifying parameters such as volume, size, shape, distribution and connectivity [14]. The goal of this study is to characterize a sample of steel iber re -inforced concrete and quantify total porosity and steel iber volume to assess thickness spatial distribution of both, pores and ibers. At the end, 3D models of the studied medium are presented.
2. Materials andexperimental program
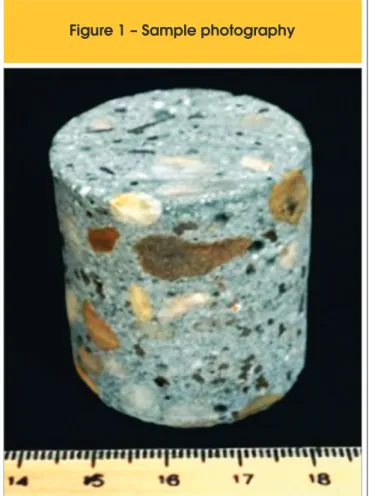
The sample used in this study was a steel iber reinforced con -crete cylinder with (38.3 ± 0.25) mm of height and (37.5± 0.25)
mm of diameter, shown in igure [1]. Other characteristics of the
material under study such as concrete composition can be visual -ized in table [1].
It was prepared in a planetary, vertical-shaft concrete mixer (CIBI). Initially the equipment was moistened with water and the excess was removed with a cloth. Then, dry ine and coarse aggregates were thrown, and mixed for 1 minute for homogenization. Then, the cementitious materials were added and mixed for another minute. After this stage, 80% water was added, then the superplasticizer material and next the remaining water and mixed for 8 minutes to allow the complete action of the plasticizer. Finally, ibers were added and mixed for another 4 minutes. The entire mixing time was 14 minutes. After 48 hours, the test specimens were with -drawn from the molds and placed in a humid chamber with rela -tive humidity higher than 95% and temperature of (22 ± 2) °C. The
aggregates used were round pebbles from the Amazon riverbed. The microCT assay was conducted in a high energy system (Sky -scan/Bruker, model 1173). The system was calibrated to work with a voltage of 80 kV and current of 100 μA. The values of the electric current and acceleration voltage used in microCT tests depend on the combination of type of material and the experimental system used. Voltage value has to be such that the photons have energy enough to pass through the sample and transmit the necessary information for image formation at the receptor. This parameter directly inluences image contrast. The higher the kV, the higher the beam energy and its penetration in the material and the smallest the intensity diference
among the photons from diferent densities of the inspected material (assuming a heterogeneous material), producing a smaller variation of radiation attenuation. Current value is attributed to the intensity of the X-ray beam, without changing the energy spectrum (the efective energy continues the same) and is related to the counting statistics of the electron beam in image construction. In this context, image qual -ity optimization depends on the relation chosen between acceleration voltage and electronic current in the X-ray tube, and, of course, on other factors such as exposure time, mentioned throughout the text. The microCT system used had an internal aluminum ilter with 1.0 ±0.05 mm thickness at the exit of the X-ray tube. The ilter reduces the contribution of low energy photons, minimizing beam harden -ing efect, which is an artifact of inal image degradation in microCT tests. This type of artifact makes the edge appear brighter than the center, even when the material is homogenous.
Pixel size used was 24 μm, which is equivalent to a spatial reso -lution of 50 μm. This diference between spatial resolution and pixel size occurs because spatial resolution depends also on other factors, such as for instance, beam geometry and the un -sharpness it forms
With that coniguration, the distances source-sample and sample-detector were 177.4 mm and 186.6 mm, respectively. Pixel size is related with sample size and microCT system size. Therefore, it is possible to obtain diferent magniication factors for diferent distance value combinations [15].
Table 1 – Characterization of the concrete and materials used
Composition of concrete
Coarse aggregate (kg/m³) 546.28
Fine aggregate (kg/m³) 1011.3
Cement (kg/m³) 330
Fly ash (kg/m³) 154
Silica fume (kg/m³) 39.6
Superplasticizer (kg/m³) 40.5
Viscosity modifier (kg/m³) 0.1
Water (kg/m³) 145
Steel fiber (kg/m³) 78
Content of superplasticizer (%) 3.8
Characterization of coarse aggregate
Tests performed Rubble
Maximum dimension characteristic (mm) 13.2
Fineness modulus 5.61
Specific mass (g/cm3) 2.62
Absorption (%) 0.14
Pulverulent materials (%) 2
Shape index 1.7
Characterization of fine aggregate
Tests performed Results
Maximum dimension characteristic (mm) 2.36
Fineness modulus 2.64
Specific Mass (g/cm3) 2.67
Absorption (%) 0.99
Pulverulent materials (%) 0.5
Clay lumps (%) –
Value of specific cement mass, ash and silica
Material Specific mass
Cement (g/cm3) 3.11
Ash (g/cm3) 2.39
Silica (g/cm3) 2.29
Steel fibers
Properties
Elasticity modulus (Gpa) 200
A lat-type detector, also known as lat panel detector, is a lat digi -tal detector with isotropic pixel size of 50 µm, i.e., 50 x 50 µm, op -erating with a maximum pixel matrix of 2240 x 2240. It was used to
record the transmission of the X-ray cone beam. This detector has the advantage of producing distortion-free images.
Acquisition was performed from a concrete cylindrical sample -placed on the system’s handling table in such a way that its main z axis was perpendicular to the radiation beam. In this manner, the sample was rotated 360º along its z axis, in 0.30º steps. It is important to note that other image acquisition parameters can be adjusted; therefore an average of 05 frames was obtained over an exposure time of 800ms for each radiography image.
After the acquisition process, the projections were reconstructed using the Nrecon®SkyScan - version 1.6.4.1 program [16] and In -staRecon - version 1.3.5.0 [17] whose algorithm is based on Feld -kamp’s studies [18]. The reconstruction program allows choosing several parameters to obtain a more accurate image quality. The parameters can be manually adjusted during reconstruction using the visualization function (previews). The ine tuning function of NRecon is designed to make the necessary adjustments accord -ing a series of previews. It is possible to adjust one parameter at a time, keeping all other parameters ixed, so that it is possible to select, one by one, the desired combination for a better image quality. From the options ofered, we used the following:
n i) Ring artifact: ring artifact appears as total or partial circles centered in the rotation axis which are caused by changes in the exit of the individual detectors or set of detectors. This re -duction is applied to the projections before image pre-process -ing, so that the average projection is used for this purpose. The depth of this correction can be chosen in a 1 to 20 gap. In our study, we used a ring artifact reduction with a degree of 9. n ii) Beam hardening: besides the corrections that can be made
during the test, another correction is possible by mathematical processing. This correction is made through linear transforma -tion and its depth can be chosen according to the material den -sity. A high order in the polynomial function can also be used for that purpose. Beam hardening correction can be made in difer -ent degrees (1% to 100%). A beam hardening artifact correction of 9% was applied in the present study.
n iii) Noise reduction: the kernel Gaussian smoothing ilter is char -acterized as smoothing applied to projections. It smoothes each pixel within an MxN neighborhood, where M is the horizontal dimensionand N is the vertical dimension. It reduces noise and searches for a proper smoothing level using ilters in diferent degrees (1 to 10). In this study, we used a Gaussian smoothing ilter with degree equal to 8.
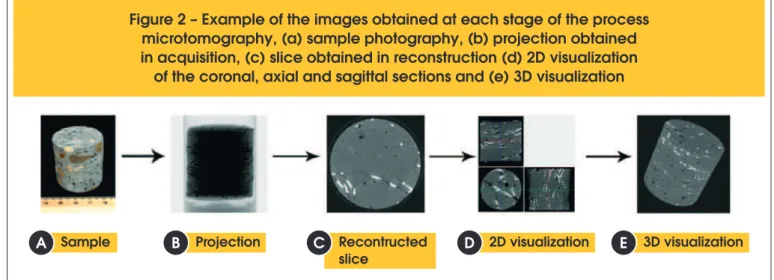
In this stage, the results obtained are reconstructed slices. These slices provide both, 2D and 3D sample visualizations which can be digitally processed, therefore, qualitative and quantitative infor -mation may be obtained from these images after submission to a series of mathematical operations such as binarization, noise removal, image contrast improvement, etc. Figure [2] shows an example of images obtained in each stage of the microCT process. Once the acquisition and reconstruction stages are inished, it is necessary to analyze the images obtained. The SkyScan, CTAN® (v1.11.8.0) [19] program was used for image analysis and process -ing. In this stage, the goal was to quantify geometrical parameters related to concrete porosity and steel ibers. This quantiication is performed only after image segmentation. Segmentation involves the selection of a threshold value to separate the porous space from other remaining phases in the material. In the present study, a simple global thresholding method was applied, with a single threshold value chosen to separate pores from the matrix. In a second stage, another threshold value was chosen to separate the ibers from the remaining materials [20]. In this manner, the
Figure 2 – Example of the images obtained at each stage of the process
microtomography, (a) sample photography, (b) projection obtained
in acquisition, (c) slice obtained in reconstruction (d) 2D visualization
of the coronal, axial and sagittal sections and (e) 3D visualization
Sample Projection Recontructed
slice 2D visualization 3D visualization
A
B
C
D
E
Table 2 – µCT-3D results
Phase Volume (mm3)
Percentage (%)
ρ (mm-1)
∆ρ (mm)
Pores 604.69 1.58 – –
Matrix 37028.19 97.09 – –
Steel
fibers 504.55 1.32 0.024 15.16
amount of black and white pixels/voxels belonging to the volume of interest (VOI), and consequently total concrete sample porosity, linear density of steel ibers (ρ, mm-1), iber separation (∆, mm), i.e., spacing between them and thickness distribution of pores and steel ibers were determined. Pore, iber and matrix volumes were essential in all the assessments.
3. Results and discussion
MicroCT results are shown in table [2]. They indicate that the steel iber reinforced concrete sample studied has high quality, because according to [2;3], has steel iber percent above the value recom -mended for high resistance concretes (1.32%), ensuring enhance -ment of the performance of the mechanical properties. Another parameter that indicates the quality of the sample is total porosity, which was 1.5%. This value may be considered low and directly inluences the increase of concrete durability, because according to [9] excellent quality concretes are those with porosity about 1%. Figure [3] illustrates 3D iber distribution within the volume of inter -est studied, from the visualization of 3D models of sample phases. The igure shows that this distribution is not uniform, because it presents a random behavior, which may result in a decrease of iber eiciency in repressing crack propagation in high resistance concretes. This non-uniform distribution suggests a problem of iber-matrix adherence through anchoring efect.
However, total porosity is not the only parameter important for characterizing the pore space. Pore size distribution is also es -sential for understanding concrete durability. Figure [4] illustrates this result obtained through microCT, evaluated slice-by-slice. Ten pore size intervals are evidenced (0.00-0.05; 0.05-0.10; 0.10-0.19; 0.19-0.39; 0.39-0.77; 0.77-1.54; 1.54-3.08; 3.08-6.16; 6.16-12.33; 12.33-24.65) mm. Most pores are not within the highest or lowest intervals, they concentrate within the (0.19-0.39) and (0.39-0.77) mm intervals. This distribution shows that more than 77% pores lie within the range from 0.10 to 1.54 mm. The highest pore size range found (12.33 to 24.65 mm) represents just 2.2% of total pores, and the lowest pore size range (between 0.00 and 0.05 mm) only 8.53%.
Other parameters that microCT enables to investigate are: iber lin -ear density (ρ) and iber separation(∆ρ). The density ρ is inversely proportional to the distance between the mean iber axis, this im -plies in the number of paths through the solid structure by length unit. The value ρ found in this study was 0.024 mm-1, this value was directly calculated in 3D. The separation ∆ρ is, essentially the thickness of the spaces deined by the binarized objects within the VOI, i.e., the average distance between the ibers. The value found for ∆ρ was 15.16 mm. This value was calculated in 2D (slice-by-slice). According to [21], low iber density values and increasingly higher values of iber separation are associated to small mechani -cal resistance of the sample under study.
The greatest beneit obtained in reinforcing a fragile matrix with ibers is to alter its behavior after cracking. The composite does not break after the beginning of matrix cracking, but it can sufer
Figure 3 – 3D models of the different phases of reinforced concrete: (a) pores,
(b) matrix + pores + steel fibers and (c) steel fibers
A
B
C
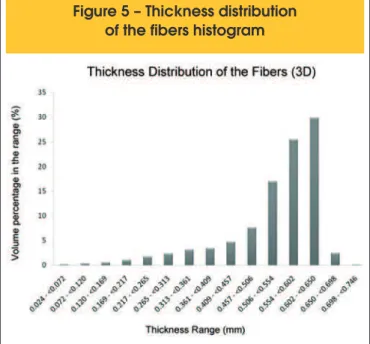
signiicant plastic deformation which makes it adequate for con -struction. To this end, ibers must be added in adequate volume, length and shape [5]. In this manner, iber morphological charac -terization is essential in the evaluation of reinforced concrete qual -ity. Fiber thickness distribution, igure [5], was directly analyzed in 3D. The method begins with a skeletonization, identifying the me -dial axis of all the structures.In this manner an adaptive sphere will help local thickness calculation for all the voxels along the identi -ied medial axis. This adaptive sphere is a sphere inscribed in the binarized solid to maximize the tangency of its surfaces [22; 23]. The result indicates steel iber thickness uniformity, i.e., most ibers (more than 70% iber volume) included in the sample lied in the thickness range between 0.50 and 0.65 mm.
4. Conclusions
3D high resolution computed microtomography proved to be an adequate technique for steel iber reinforced concrete character -ization. Without any process of sample preparation, it was possible to qualitatively and quantitatively assess volume and thickness dis -tribution of pores and steel ibers, besides the spatial dis-tribution of the ibers in the sample.
Each stage of the microtomography process (acquisition, recon -struction and analysis) was carefully evaluated to obtain the best quality thus ensuring result reliability. The parameters used in each stage, such as voltage, current, physical and mathematical ilters and segmentation thresholds were tested until an optimum inal value was obtained.
The opportunity to assess steel iber distribution and concrete po -rosity enables analyzing not only the inal result of the sample, but also its entire production process.
5. Acknowledgement
To CNPq, CAPES e FAPERJ, for their inancial support and schol -arships granted for this study
6. References
[1] HAKTANIR, T., et al..Efects of steel ibers and mineral iller on the water-tightness of concrete pipes. Cement & Con -crete Composites, vol. 28, 2006; p. 811-816.
[2] MINDESS, S. Fibre Reinforced Concrete - Myth and Reality. Advances in Cement and Concrete, Book Conference Pro -ceedings, Durham, New Hampshire, 1994, p. 217-222. [3] MINDESS, S., YONG J. F., DARWIN, D. Concrete. New Jer
-sey: Prentice Hall, 2 ed., 2002,cap 22.
[4] FIGUEIREDO, A. D.. Concreto com ibras de aço, São Pau -lo, 2000, Boletim Técnico - Escola Politécnica, Universidade de São Paulo.
[5] MIGLIORINI, A.V., GUIMARÃES, A.T.C., OZÓRIO, B.P.M., Fi -bras de aço em blocos de concreto: estudo para utilização em ambiente marítimo, Revista Matéria, v. 17, 2012, p. 997-1008. [6] REINHARDT, H.W., Penetration and Permeability of Con -crete: Barriers to organic and contaminating liquids., Rilem Report 16, E & FN Spon, London, 1997.
[7] MIGLIORINI, A. V. Estudo de ibras de aço em blocos de concreto para a possível utilização em carapaça de molhes, Rio Grande, 2011, Dissertação (mestrado) - Universidade Federal do Rio Grande.
[8] NEVILLE, A. M., Properties of concrete, Longman, London, 4th ed., 1995.
[9] PESSÔA, J. R. C. Microtomograia com raios x e processa -mento de imagem na obtenção da porosidade do concreto, Rio de Janeiro, 2011, Tese (doutorado) - Universidade do Estado do Rio de Janeiro.
[10] CARVALHO, G., et al. Caracterização do concreto utili -zando microtomograia por raios x e scanner comercial, CNMAC, Águas de Lindóia, SP, ISSN 1984-820X, v.3, p. 694-700, 2010.
[11] ROUGELOT, T., et al. About microcracking due to leaching in cementitious composites: X-ray microtomography de -scription and numerical approach, Cement and Concrete Research, 40(2), 2010, p. 271-283.
[12] LANDIS, E. N., KEANE, D.T.. X-ray Microtomography, Mate -rials Characterization, 61(12), 2010, p. 1305-1316.
[13] BRAZ, D., et al. Study of the concrete overlay (whitetopping) in paving using computed tomographic system, Nuclear In -struments and Methods in Physics Research Section A: Ac -celerators, Spectrometers, Detectors and Associated Equip -ment, 579(1), 2007, p. 510-513.
[14] MACHADO, A. C., et al. Efect of 3d computed microtomog -raphy resolution on reservoir rocks, Radiation Physics and Chemistry, vol. 95, 2014; pp. 405-407.
[15] LIMA, I., DE ASSIS, J.T., LOPES, R.T., Three-dimensional conic beam X-ray microtomography in bone quality, Spectro -chimicaActa Part B, 64, p. 1173-1179, 2009.
[16] NRECON, SkyScan/Bruker micro-CT, Kartuizerweg 3B 2550 Kontich, Belgium, 2011.
[17] INSTARECON®, CBR Premium 12-8KTM, InstaRecon, Champaign, IL, USA, 2011.
[18] FELDKAMP, L.A.,L. C. Davis, and J. W. Kress, Practi -cal cone beam algorithm, J Opt Soc Am A, vol. 1,1984, p. 612-619.
[19] CTANALYSER. The user’s guide, Skyscan/Bruker micro-CT, Kartuizerweg 3B 2550 Kontich, Belgium, 2012.
[20] PROVISA, J. L., et al. X-ray microtomography shows pore structure and tortuosity in alkali-activated binders, Cement and Concrete Research, 42(6), 2012, p. 855-864.
[21] DAMILAKIS, J., et al. An update on the assessment of osteo -porosis using radiological techniques, Eur. Radiol. Jun; 17, 2007, p. 1591-602.
[22] CTANALYSER. Morphometric parameters measured, Sky -scan/Bruker micro-CT, Kartuizerweg 3B 2550 Kontich, Bel -gium, 2012.