*e-mail: [email protected]; [email protected] Received: 27 November 2013 / Accepted: 17 April 2014
Lung disease detection using feature extraction and extreme learning
machine
Geraldo Luis Bezerra Ramalho*, Pedro Pedrosa Rebouças Filho, Fátima Nelsizeuma Sombra de Medeiros, Paulo César Cortez
Abstract Introduction: The World Health Organization estimates that by 2030 the Chronic Obstructive Pulmonary Disease (COPD) will be the third leading cause of death worldwide. Computerized Tomography (CT) images of lungs comprise a number of structures that are relevant for pulmonary disease diagnosis and analysis. Methods: In this paper, we employ the Adaptive Crisp Active Contour Models (ACACM) for lung structure segmentation. And we propose a novel method for lung disease detection based on feature extraction of ACACM segmented images within the cooccurrence statistics framework. The spatial interdependence matrix (SIM) synthesizes the
structural information of lung image structures in terms of three attributes. Finally, we perform a classii cation
experiment on this set of attributes to discriminate two types of lung diseases and health lungs. We evaluate the discrimination ability of the proposed lung image descriptors using an extreme learning machine neural network (ELMNN) comprising 4-10 neurons in the hidden layer and 3 neurons in the output layer to map each pulmonary condition. This network was trained and validated by applying a holdout procedure. Results: The experimental results achieved 96% accuracy demonstrating the effectiveness of the proposed method on
identifying normal lungs and diseases as COPD and i brosis. Conclusion: Our results lead to conclude that the method is suitable to integrate clinical decision support systems for pulmonary screening and diagnosis. Keywords Lung diseases, Chest CT images, Active contour models, Spatial interdependence matrix,
Feature extraction, Image segmentation.
Introduction
A large number of diseases that affect the worldwide population are lung-related. Therefore, research in
the i eld of Pulmonology has great importance in
public health studies and focuses mainly on asthma, bronchiectasis and Chronic Obstructive Pulmonary Disease (COPD) (Holanda et al., 2010; Winkeler, 2006).
The World Health Organization (WHO) estimates that there are 300 million people who suffer from asthma, and that this disease causes around 250 thousand deaths per year worldwide (Campos and Lemos, 2009). In addition, WHO estimates that 210 million people have COPD. This disease caused the death of over 300 thousand people in 2005 (Gold Copd, 2008). Recent studies reveal that COPD is present in the 20 to 45 year-old age bracket, although it is characterized as an over-50-year-old disease. Accordingly, WHO estimates that the number of deaths due to COPD will increase 30% by 2015, and by 2030 COPD will be the third cause of mortalities worldwide (World…, 2014).
For the public health system, the early and correct diagnosis of any pulmonary disease is mandatory for timely treatment and prevents further death. From a clinical standpoint, diagnosis aid tools and systems
are of great importance for the specialist and hence for the people’s health.
CT images of lungs represent a slice of the ribcage, where a large number of structures are located, such as blood vessels, arteries, respiratory vessels, pulmonary
pleura and parenchyma, each with its own specii c
information. Thus, for pulmonary disease analysis and diagnosis, it is necessary to segment lung structures. It is worth noting that segmentation is an essential step in image systems for the accurate lung disease diagnosis, since it delimits lung structures in CT images. Indeed, image processing techniques can help computer diagnosis if lung region is accurately obtained (Felix et al., 2007a; Liang et al., 2008).
some papers address the detection of certain speciic
diseases, such as nodules (Ayres et al., 2010; Silva and Oliveira, 2010), and emphysema (Felix et al., 2007, 2011).
This paper aims to identify and classify diseases proposing a new methodology for texture
characterization and classiication of lung diseases.
It is noteworthy that lung regions considered for
classiication are segmented beforehand using the
Adaptive Crisp Active Contours Models (ACACM) (Rebouças Filho et al., 2013a) in order to minimize
misclassiication. This paper also addresses the detection of ibrosis and emphysema diseases, which
are the main components of COPD based on a new feature extraction method, the spatial interdependence
matrix (SIM). A classiication experiment is used to
compare the performance of SIM and GLCM texture
descriptors. The visual information idelity (VIF)
index (Sheikh et al., 2005) is also investigated in this paper, because it performs quite similar to the SIM based descriptors. In fact, they both employ a referenced image analysis approach.
In addition, this paper provides an algorithm for CT medical image analysis on personal computers. Thus, it can reduce software dependence and costs with CT workstation and therefore it optimizes the workstation tasks.
Methods
The proposed methodology extracts features from segmented CT images and uses an extreme learning machine (ELM) to classify the lung disease in three classes: Pulmonary Fibrosis (PF) or Chronic Obstructive Pulmonary Disease (COPD) or as a Health Lung (HL) sample. Figure 1 illustrates the
methodology. We irst describe the digital image
acquisition through Computed Tomography (CT) and, afterwards, the lung segmentation. Finally,
we introduce the proposed method for lung disease
identiication.
The medical image acquisition and lung segmentation
Prior to image acquisition, the tomograph is set to
an air density of –1000 HU (Hounsield units). The
calibration is carried out within three months taking
exams, as speciied by the manufacturer (Toshiba,
1997). Moreover, a tomographic cut with a water phantom with a known density is performed for analysis and parameter control (Holanda et al., 2010).
The images are quantiied in 16 bits and stored in a
DICOM format (Digital Imaging and Communications
in Medicine). To read the DICOM ile format, we
have used the free DICOM toolkit offered by OFFIS. This library is compatible with the C++ programming language.
The data set comprises an image cluster obtained in collaboration with the Walter Cantídio Hospital of the Federal University of Ceará, submitted to an earlier study (Holanda et al., 2010; Winkeler, 2006). This study was approved and evaluated by the UFC Research Ethics Committee – COMEPE, (Protocol nº 35/06) and complied with the demands of Resolution nº 196/96 of the National Health Council, concerning research in human beings.
In this paper, the inner regions of lungs are provided by the ACACM method (Rebouças Filho, 2011). These regions are used to calculate the attributes
for lung disease classiication. The ACACM is
adopted because it provides accurate lung image segmentation. Indeed, it outperforms other methods available in the literature that are based on region growing, watershed, and mathematical morphology approaches (Felix et al., 2007a; Felix et al., 2007b), in terms of time processing and segmentation accuracy. The segmentation algorithm is based on the Active Contour Models and encompasses computational
intelligence techniques and lung anatomy knowledge (Rebouças Filho, 2013b). Figure 2 depicts lung segmentation results in CT images of thorax of healthy
volunteers and patients with COPD and ibrosis.
The proposed feature extraction method
Our feature extraction method is inspired by the gray-level cooccurrence matrix (GLCM) introduced by Haralick et al. (1973) and often used in texture analysis (Choi, 2005; Medeiros et al., 2010). The proposed method, namely Spatial Interdependence Matrix (SIM), uses the cooccurrence statistics to analyse the structural information based on how the
human visual system (HVS) interprets scenes. In this
context, the novel method can be used to assess image structural degradation. Morever, it performs quite
similar to the visual information idelity (VIF) index (Sheikh et al., 2005). Here, the VIF index assesses
differences between an image and its degraded version following the procedure of our proposed feature extraction method.
Consider an image I and its degraded version J as a set of gray levels in the domain DI ⊂Z2 ∈{0,1,2,…,N},
where N is the total number of gray levels. We arrange the transitions between the intensities of the pixels and spatially correspondent in both images into a N
x N matrix whose elements Mij are deined by
#{( , ) : ( ), ( )}
= = = ∀ ∈
ij I
M i j i I p j J p p D (1)
where #{·} stands for the cardinality of the set of intensities I(p) and J(p) for pixels p belonging to I and J.
Three structural attributes extracted from the SIM matrix describe the degraded image J when compared with I: correlation (Cor), inverse difference moment (Idm) and chi-square (Chi). These attributes represent the level of degradation from three different perspectives, respectively, structural similarity, structural degradation and structural independence.
To extract the structural attributes Cor and Idm, we use a symmetric version MS = (M+MT)/2 of this
matrix, where MT is the transpose of M. A normalization
is applied to M, such that ΣM = 1 in order to obtain the weight of pair-transitions as an approximation of probabilities. The following equations describe the structural attributes in terms of Mij,
1
, 0 2 2
( )( )
[ 1,1]
− =
− µ − µ
=∑ ∈ −
σ σ
i j ij
N i j
i j
i j M
Cor (2)
1
, 0
[0,1] 1 | |
− =
=N∑ + −ij ∈ i j
M Idm
i j (3)
2 1
0
( )
[0,1]
− =
− =N∑ i i ∈
i i
O E
Chi
E (4)
where µi and µj stand for the average values, and
σi and σj are the standard deviation of normalized
symmetric M for each line i and column j; Oi refers to the observed weights in the diagonal (i = j) of the asymmetric M, and Ei refers to the expected weights in the diagonal of asymmetric M for J = I.
The SIM matrix provides a visual pattern useful to interpret the degraded image. When image structures are not degraded, the weights are well distributed close to the matrix diagonal. Otherwise, different patterns appear depending on the structural degradation. Accordingly, the SIM matrix pattern of a healthy lung
is quite different from a ibrosis one. The structures
of a healthy lung are small, sparse and, have high
contrast. However, the ibrosis structures are spread
through the lung area.
To assess the structural characterization of lung image, we use a set of attributes extracted from the SIM matrix. Cor, Idm and Chi attributes are related, respectively, to similarity, degradation and independenceof the original image structures when compared to the ones of the degraded image version. Our degradation model relies on the knowledge that the CT imagery system blurs lung structures. Thus,
we degrade the input image convolving it with a 3x3 gaussian kernel with zero mean and unitary standard deviation. Our experiments have shown
that this mask is suficient to degrade small structures
and furthermore, its size implies low impact on the overall computational cost. We set the number of gray-levels N = 64 to compute the SIM matrix. This quantization ensures structural change detection while preserves good numerical estimation for the coocurrence frequencies.
Disease identiication
The COPD images present low medium intensity and large structures. The PF lung images, in turn, present particular texture and therefore are more susceptible to structural changes caused by blurring. In fact, the Idm and Chi attributes can detect this structural
degradation. On the other hand, the ibrosis structures
are largely distributed in the lungs and present relative larger sizes, when comparing them with protruding structures such as blood vessels. More importantly, the Cor attribute value exceeds the Idm and Chi ones
for degraded structures of ibrosis images.
Regarding the HL images, they are more uniform than PF and COPD images. Nevertheless, HL images present some prominent vessels degraded by smoothing. In general, the SIM matrix attributes for HL are lower than the ones calculated for PF and COPD images.
The proposed disease descriptor is a set of three attributes in a vector A = {Cor, Idm, 1-Chi} extracted from the SIM matrices of 72 lung images. The dataset of descriptors consists of 27 vector samples of healthy lungs (HL), 24 vector samples of COPD and 21 vector
samples of pulmonary ibrosis (PF), comprising left
and right sides of CT images. Experts in pulmonary diseases provided the gold standard (GS) reference labels, which are used to training and validate the
classiier. A subset of the sample vectors A is used
to train a multilayer perceptron (MLP) artiicial
neural network (ANN) and the complementary set is used for validation in a holdout procedure. The train-test procedure is repeated 100 rounds and the performance evaluation values are registered using a confusion matrix.
In this paper, we employ the one step feedforward extreme learning machine (ELM) training algorithm (Huang et al., 2006). In general, the ELM reaches higher performances using less processing time than the backpropagation algorithm. However, the ELM often requires a higher number of neurons in this task (Wang et al., 2011). The learning rule of the ELM is expressed by
(
)
1
; 1, ,
=b + = = …
∑H i i j i j i
g W X b t j N (5)
where H is the number of neurons in the hidden layer and N is the number of training vectors.wi =
[wi1, wi2,,..., win]T are weight vectors of the hidden
layer and bi = [bi1, bi2, ..., bim]T are weight vectors of
the output layer. xj is the input vector of dimension
n and tj is the gold standard label. The differentiable logistic activation function g(x) tackles with the neural network non-linearity.
Consider the matrices
( ) ( )
( ) ( )
1 1 1 1 1 1
1 1
,
+ + b
= b = =
+ + b
T T H H T T
N H N H H H
g W X b g W X b t
H eT
g W X b g W X b t
The learning rule given by Equation 5 can be
redeined in the matricial form Hb = T. The solution
b = H†T can be found employing least squares, given
H † the Moore-Penrose generalized pseudoinverse. It
can be proved that the ELM training is independent of the hidden weights wi, which can be initialized with random values (Huang et al., 2006).
Classiication evaluation
In order to measure the performance of our method
in classiication experiments, we irst compute a
confusion matrix C whereas the instances Cij of the true and the estimated classes are distributed over rows i and columns j, respectively. The overall
performance is deined by the sum of the instances
in the diagonal of C, i.e., Accuracy = ∑i Cii. We also
evaluate the classiier performance using the multi-class multi-classiication measures deined by Labatut and Cherii (2011), = = = +TP i TP FN C
Sensitivity TPR Recall
C C ,
= = +TN i TN FP C Specificity TNR
C C ,
assuming that true positive (TP), false negative (FN), false positive (FP) and true negative (TN) correspond to CTP = Cii, CFN = C+i – Cii, CFP = Ci+ – Cii and CTN
= 1 – CTP – CFP – CFN, respectively. The proportions
C+i and Ci+ represent the sums of the instances over row i and column j, respectively.
In fact, we have chosen these performance measures because they exhibit invariance property under uniform change of positives and negatives (Sokolova and Lapalme, 2009). Thus, Accuracy,
Results
This section presents the performance evaluation of the proposed approach for pulmonary disease
classiication on CT lung thorax images of healthy and unhealthy patients (COPD and ibrosis diseases).
In this paper, we have applied two evaluation schemes to the proposed lung disease descriptors.
The irst scheme concerns a discriminant analysis
using a U-Matrix projection of the descriptors (Ultsch, 2003). To extract the GLCM texture features namely correlation (Cor), homogeneity (Hom), energy (Ene) and contrast (Con), we adopt
the neighbor parameters δ =1 and θ = {0°, 45°, 90°, 135°} (Haralick et al., 1973). The GLCM set of texture attributes is, Aglcm={Cor Hom Ene Con, , , } where each element represents the mean value of the four
directions for a given displacement. The VIF index
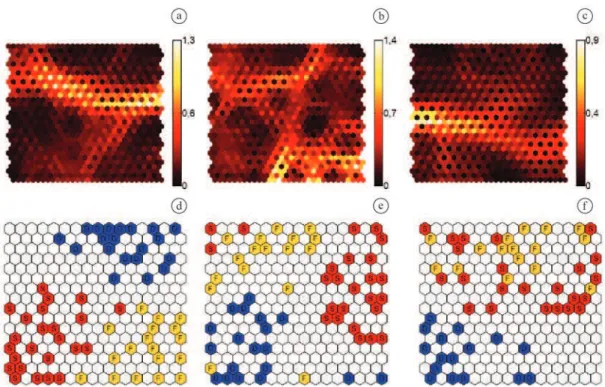
is a one-dimensional descriptor, i.e., a scalar value. Figure 3 illustrates the projection of both sets of descriptors in a bi-dimensional space using a U-Matrix (Ultsch, 2003) projection. This n-dimensional visualization tool reveals the discriminant power of the descriptors through a distance map that indicates how close is an entity from their neighbors in the same class. The color intensity in Figures 3a, 3b and 3c, is proportional to the distance, i.e., the darker the color the closer the entity is to their neighbors in the same class. Two classes are well discriminated when there
is a well-delimited light region between them. Thus, this map provides a visual interpretation of the spatial arrangement of the samples in clusters of similar meaning. We can observe that the SIM U-Matrix presented the best discrimination due to the presence
of three well-deined regions, one for each class. The
GLCM U-Matrix presented more than three regions, which means that there was sample superposition of
different classes. The VIF U-Matrix, in turn, presented only two well-deined regions and it was not suficient
to discriminate three classes. Figures 3d, 3e and 3f illustrate these U-Matrices using color labellings for the data samples. Indeed, we can observe that
both GLCM and VIF descriptors performed poorly.
However, it is noteworthy that texture descriptors are able to provide a good discrimination of COPD samples.
The second evaluation scheme consists of a
disease classiication experiment. We performed
an exhaustive search from 2 to 20 hidden neurons. Each one of the corresponding network architecture was evaluated using cross-validation to increase hit rates. We computed the average result for 100
classiications employing 70% of the dataset for
training, chosen at random, and the complement for test. The performance of the network architecture providing the best overall result was registered. Tables 1, 2 and 3 present confusion matrices that
summarize the average classiication and standard
Figure 3. (a-c) SIM, GLCM and VIF descriptor U-Matrices for disease discrimination. (d-f) The colors identify the classes HL (red), PF
deviation results of our experiments for lung disease
detection using SIM, GLCM and VIF descriptors.
Discussion
From the U-Matrix in Figure 3, we observed that PF and COPD samples are grouped in different clusters. The number of regions in Figures 3a, 3b and 3c reveal the strength of each descriptor set concerning its clustering
result. Indeed, the well-deined discrimination region
between the COPD class and the other two for SIM
descriptors conirms this observation. Conversely,
the discrimination between HL and PF classes is
more dificult, because they appear very close in
the U-Matrix projection. The weakeness clustering
for GLCM and VIF descriptors is conirmed in the
labeled U-Matrices presented in Figures 3e and 3f. It is noteworthy that they present at least two mixed lung classes.
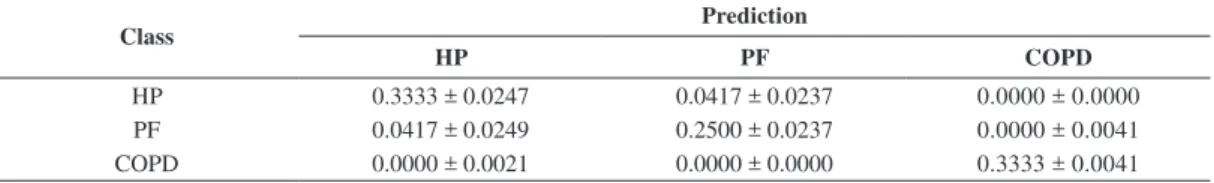
Table 1 presents the confusion matrix for the SIM attributes obtained for an ELM neural network with 4 hidden neurons. The overall performance measured by the accuracy was above 96% and it was penalized by the low sensitivity (85%) for PF and low sensitivity (88%) for HL classes. However, both sensitivity and
speciicity for samples containing pulmonary diseases
(COPD) are equal to unity. Sensitivity measures
the goodness of positive disease identiication and
speciicity measures the system goodness in avoiding
false positive. Thus, for this experiment, it means that the method succeeded in detecting most of PF and COPD sample images. The mean processing time was 5 milliseconds per image, measured on a regular four-core 3.2 GHz computer.
The results for the other two descriptors sets are presented in Table 2 and Table 3. For both GLCM
and VIF descriptors, the performance measures
reached lower values than the SIM ones. Indeed, the accuracy achieved with GLCM (85%) and VIF
(79%) descriptors and both sensitivity and speciicity measures revealed that its disease discrimination is
more pruned to misclassiication. The GLCM texture
descriptors tend to confuse HL with the other two diseases, especially in their initial stages. On the other
hand, VIF index produced a good result for COPD
detection, although the majority of PF samples were false negatives.
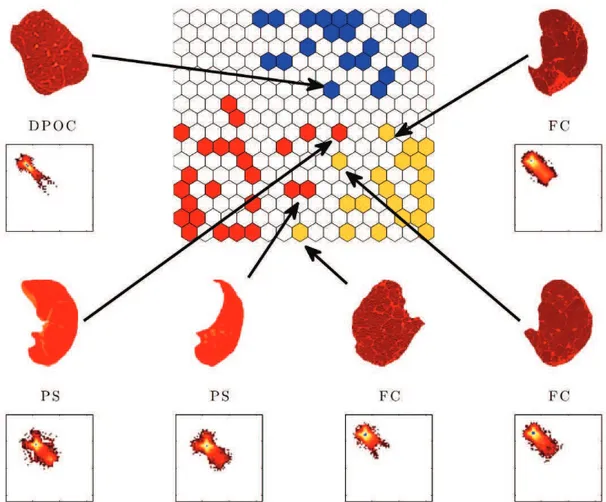
Figure 4 displays a diagram that highlights segmented lung images on the boundaries between classes and their respective SIM. The matrices exhibit a particular pattern for each lung image and similarities between samples that belong to a same class. The largest dispersion around the diagonal shows that high contrast structures were degraded, as in the COPD images. The matrices in Figures 4a and 4e display a
similar pattern region in a “V” format, showing that
their lungs present high contrast between adjacent
Table 1. Confusion matrix for the SIM attributes.
Class Prediction
HP PF COPD
HP 0.3333 ± 0.0247 0.0417 ± 0.0237 0.0000 ± 0.0000
PF 0.0417 ± 0.0249 0.2500 ± 0.0237 0.0000 ± 0.0041
COPD 0.0000 ± 0.0021 0.0000 ± 0.0000 0.3333 ± 0.0041
Table 2. Confusion matrix for the GLCM attributes.
Class Prediction
HP PF COPD
HP 0.3333 ± 0.0297 0.0625 ± 0.0458 0.0000 ± 0.0183
PF 0.0417 ± 0.0297 0.2292 ± 0.0474 0.0417 ± 0.0212
COPD 0.0000 ± 0.0042 0.0000 ± 0.0129 0.2917 ± 0.0255
Table 3. Confusion matrix for the VIF attributes.
Class Prediction
HP PF COPD
HP 0.3333 ± 0.0552 0.1667 ± 0.0464 0.0000 ± 0.0148
PF 0.0417 ± 0.0554 0.1250 ± 0.0464 0.0000 ± 0.0029
structures. However, for the HR image in Figure 4e, the contrast is related to the noise presence.
It is worth noting that samples of the PF lung class are close to the HL class border, and it is determined by a few number of small structure alterations. Concerning the HL class, it is quite close to the PF one, since vessels can be confused morphologically
with the ibrosis anatomy.
Our experimental results show that SIM descriptors can be used to discriminate pulmonary diseases on CT images within high sensitivity and speciicity criteria. We concluded that texture attributes from
GLCM matrix and the image quality VIF measure
are less pruned to discriminate diseases. Moreover, the proposed methodology can be used as a tool in CT screening for lung disease tracking and it can also be an auxiliary tool to help pulmonary diagnosis and monitoring. Our experiments have shown promising results regarding the main objective to provide a computer aided screening tool.
Although we have employed a robust automatic segmentation algorithm to provide the inner regions of
the right and left lungs, the use of other segmentation methods will be further investigated.
References
Ayres PAA, Cavalcante RC, Oliveira MC. Auxílio à
classiicação de nódulos pulmonares usando recuperação
de imagens similares baseada em Análise de Textura 3D e Registro de Imagem 3D. In: XXX Congresso da Sociedade
Brasileira de Computação. WIM - CSBC 2010: Anais do X
Workshop de Informática Médica; 2010; Belo Horizonte. Belo Horizonte; 2010. p. 1665-72.
Campos HS, Lemos ACM. Asthma and COPD according to the pulmonologist. Brazilian Journal of Pulmonology. 2009; 35(4):301-9.
Choi K. Morphological analysis and classiication of types
of surface corrosion damage by digital image processing. Corrosion Science. 2005; 47(1):1-15. http://dx.doi. org/10.1016/j.corsci.2004.05.007
Felix JHS, Cortez PC, Holanda MA, Costa RCS. Automatic segmentation and measurement of the lungs in healthy persons and in patients with chronic obstructive pulmonary disease in CT images. IFMBE Proceedings. 2007a; 18:370-3. http:// dx.doi.org/10.1007/978-3-540-74471-9_85
Felix JHS, Cortez PC, Holanda MA, Albuquerque VHC,
Colaço DF, Alexandria AR. Lung and chest wall structures
segmentation in CT images. In: VipIMAGE 2007: Proceedings
of the I ECCOMAS Thematic Conference on Computational
Vision and Medical Image Processing; 2007 Oct 17-19; Porto,
Portugal. Abington: Taylor & Fancis Group; 2007b. p. 414.
Gold Copd. Global strategy for the diagnosis, management and prevention of chronic obstructive pulmonary disease [internet]. 2013. [cited 2013 Aug 8]. Available from: http:// www.goldcopd.org/guidelines-global-strategy-for-diagnosis-management.html.
Haralick RM, Shanmugam K, Dinstein I. Textural features
for image classiication. IEEE Transactions on Systems,
Manufactory and Cybernetics. 1973; 3(6):610-21. http:// dx.doi.org/10.1109/TSMC.1973.4309314
Holanda MA, Fortaleza SCB, Almeida MA, Winkeler GFP, Reis RC, Felix JHS, Lima JWO, Pereira EDB. Continuous positive airway pressure effects on regional lung aeration in COPD patients: a high-resolution CT scan study. Chest-American College of Chest Physicians. 2010 Aug; 138(2):305-14. http://dx.doi.org/10.1378/chest.09-2850
Huang GB, Zhu QY, Siew CK. Extreme learning machine: theory and applications. Neurocomputing. 2006; 70(1-3):489-501. http://dx.doi.org/10.1016/j.neucom.2005.12.126
Labatut V, Cherii H. Evaluation of performance measures for classiiers comparison. Ubiquitous Computing and
Communication Journal. 2011; 6:21-34.
Liang TK, Tanaka T, Nakamura H, Shirahata T, Sugiura H. An automated 3D emphysema extraction method using lung CT. In: SICE Annual Conference: Proceeding of the Annual Conference; 2008 August 20-22, Tokyo, Japan. IEEE; 2008. p. 3110-4. http://dx.doi.org/10.1109/SICE.2008.4655199
Medeiros F, Ramalho G, Bento M, Medeiros L. On the evaluation of texture and color features for Nondestructive Corrosion Detection. EURASIP Journal Advances in Signal Processing. Hindawi Publishing Corporation. 2010; 1:817473. http://dx.doi.org/10.1155/2010/817473
Rebouças Filho PP, Cortez PC, Holanda, M. A. Active contour modes Crisp: new technique for segmentation the lungs in CT images. Revista Brasileira de Engenharia Biomédica. 2011; 27(4):259-72. http://dx.doi.org/10.4322/ rbeb.2011.021
Rebouças Filho PP, Cortez PC, Felix JHS, Cavalcante TS, Holanda MA. Adaptive 2D Crisp Active Contour Model applied to lung segmentation in CT images of the thorax of healthy volunteers and patients with pulmonary emphysema. Revista Brasileira de Engenharia Biomédica. 2013a; 29(4):363-76. http://dx.doi.org/10.4322/rbeb.2013.041
Rebouças Filho PP, Cortez PC, Albuquerque VHC. 3D
segmentation and visualization of lung and its structures using CT images of the thorax. Journal of Biomedical Science and Engineering. 2013b; 6: 1099-108. http://dx.doi. org/10.4236/jbise.2013.611138
Silva TEP, Oliveira MC. Identiicação de nódulos pulmonares utilizando a construção de mapas de conexidade fuzzy
partindo da escolha de uma semente odeal. In: XXXI
Congresso da Sociedade Brasileira de Computação 2011
(CSBC 2011): Anais do XI Workshop de Informática Médica; 2011; Natal. p. 1738-45. Available from: http://www.dimap. ufrn.br/csbc2011/anais/eventos/contents/Caderno.pdf.
Sheikh HR, Bovik AC, Veciana G. An information idelity
criterion for image quality assessment using natural scene statistics. IEEE Transactions on Image Processing. 2005; 14(12):2117-28. http://dx.doi.org/10.1109/TIP.2005.859389
Shimo HK, Souza JP, Bulcão Neto RF, Marques PMA. Aplicação de descritores de Haralick para caracterização de padrões radiológicos de doenças pulmonares difusas em tomograia computadorizada de alta resolução. In: WIM
2010: Anais do Workshop de Informática Médica, 2010; Belo Horizonte. Belo Horizonte; 2010. p. 1-4.
Sokolova M, Lapalme G. A systematic analysis of
performance measures for classiication tasks. Information
Processing and Management. 2009; 45:427-37. http://dx.doi. org/10.1016/j.ipm.2009.03.002
Ultsch A. U*-Matrix: a Tool to visualize Clusters in high dimensional Data. Technical Report. 36, Department of Mathematics and Computer Science. Germany: University of Marburg; 2003.
Toshiba. Operation manual of system: X-ray computerized
tomography for all body: calibration data acquisition. São
Paulo, Brazil; 1997.
Trindade FR. Desenvolvimento de uma metodologia
de classiicação de padrões em imagens de tomograia computadorizada do pulmão. Revista da Graduação. 2009;
2(2):1-59.
Wang Y, Cao F, Yuan Y. A study on effectiveness of extreme learning machine. Neurocomputing. 2011; 74(16): 2483-90. http://dx.doi.org/10.1007/s13042-014-0238-0
World Health Organization - WHO. Chronic obstructive pulmonary disease (COPD) [internet]. [cited 26 Jan 2014]. Available from: http://www.who.int/mediacentre/factsheets/ fs315/en/.
Winkeler GFP. Effects of noninvasive continuous positive
airway pressure on pulmonary inlation in normal subjects
in supine and prone positions evaluated by high resolution computed tomography [dissertation]. Fortaleza: Clinical Medicine Department, Federal University of Ceará; 2006.
Authors
Geraldo Luis Bezerra Ramalho*, Pedro Pedrosa Rebouças Filho
Department of Industry, Federal Institute of Education, Science and Technology of Ceará – IFCE, Av. Parque Central, s/n, CEP 61939-140, Maracanaú, CE, Brazil
Fátima Nelsizeuma Sombra de Medeiros, Paulo César Cortez