www.atmos-meas-tech.net/8/3647/2015/ doi:10.5194/amt-8-3647-2015
© Author(s) 2015. CC Attribution 3.0 License.
Use of the CALIOP vertical feature mask for evaluating
global aerosol models
E. P. Nowottnick1,2, P. R. Colarco2, E. J. Welton3, and A. da Silva4
1GESTAR/Universities Space Research Association, Columbia, MD, 21046, USA
2Atmospheric Chemistry and Dynamics Laboratory, Code 614, NASA GSFC, Greenbelt, MD, 20771, USA 3Mesoscale Atmospheric Processes Laboratory, Code 612, NASA GSFC, Greenbelt, MD, 20771, USA 4Global Modeling and Assimilation Office, Code 610.1, NASA GSFC, Greenbelt, MD, 20771, USA
Correspondence to:E. P. Nowottnick ([email protected])
Received: 24 November 2014 – Published in Atmos. Meas. Tech. Discuss.: 30 January 2015 Revised: 11 August 2015 – Accepted: 12 August 2015 – Published: 9 September 2015
Abstract.We use observations from the space-based Cloud-Aerosol Lidar with Orthogonal Polarization (CALIOP) to evaluate global aerosol distributions simulated in the NASA Modern Era Retrospective Analysis for Research and Appli-cations aerosol reanalysis (MERRAero). We focus particu-larly on an evaluation of aerosol types, using the CALIOP vertical feature mask (VFM) algorithm, and look especially at Saharan dust distributions during July 2009. MERRAero consists of an aerosol simulation produced in the Goddard Earth Observing System version 5 (GEOS-5) Earth sys-tem model and incorporates assimilation of MODIS-derived aerosol optical thickness (AOT) to constrain column aerosol loadings. For comparison to the CALIOP VFM we construct two synthetic VFMs using the MERRAero aerosol distribu-tions: a CALIOP-like VFM in which we simulate the total attenuated backscatter and particle depolarization ratio from the MERRAero output and pass those into the CALIOP VFM typing algorithm (MERRAero-CALIOP), and an extinction-based VFM in which we use the MERRAero-simulated species-resolved extinction to map the MERRAero species to the CALIOP VFM types (MERRAero-Extinction). By com-paring the MERRAero-CALIOP VFM to CALIOP VFM, we can diagnose the aerosol transport and speciation in MERRAero. By comparing the MERRAero-CALIOP and MERRAero-Extinction-simulated VFM, we perform a sim-ple observing system experiment (OSE), which is useful for identifying limitations of the CALIOP VFM algorithm it-self. We find that, despite having our column AOT con-strained by MODIS, comparison to the CALIOP VFM re-veals a greater occurrence of dusty aerosol layers in our
MERRAero-CALIOP VFM due to errors in MERRAero aerosol speciation. Additionally, we find that the CALIOP VFM algorithm is challenged when classifying aerosol fea-tures when multiple aerosol types are present, as our applica-tion of the CALIOP VFM algorithm to MERRAero aerosol distributions classified marine-dominated aerosol layers with low aerosol loadings as polluted dust when the contribution of dust to the total extinction was low.
1 Introduction
source of iron to terrestrial (Swap et al., 1992) and aquatic ecosystems (Mahowald et al., 2009), which in the latter case can enhance atmospheric CO2 uptake by phytoplankton in iron-limited oceans (Jickells et al., 2005). Understanding of the roles of dust in all of these processes remains incomplete owing to the heterogeneous spatial, temporal, and composi-tional nature of dust and other related aerosols, and overall aerosol interactions within the Earth system remain a driv-ing source of uncertainty in assessdriv-ing the current climate and projecting future climate (IPCC, 2014).
Global aerosol distributions are typically observed and quantified in terms of their optical properties, particularly aerosol optical thickness (AOT), a column measure of the aerosol loading. AOT is readily measured by ground-based sun photometers (e.g., the Aerosol Robotic Network, or AERONET; Holben et al., 1998) and is a primary retrieval of space-based sensors such as those from the Moderate Res-olution Imaging Spectroradiometer (MODIS; Remer et al., 2005; Levy et al., 2010) and the Multi-angle Imaging Spec-troradiometer (MISR; Kahn et al., 2005). However, owing to limitations of spatial (e.g., AERONET) and temporal (e.g., MODIS) resolution, as well as challenges in isolating dust from the total aerosol loading, global aerosol transport mod-els serve as useful tools to complement an incomplete ob-serving system, by simulating the aerosol source, sink, and chemistry processes that impact the aerosol loading (Kim et al., 2014; Colarco et al., 2010; Textor et al., 2006; Kinne et al., 2006). Because of their high temporal and spatial res-olution, the aerosol distributions simulated in aerosol data assimilation systems have the potential to fill in gaps in the existing observing systems. Global aerosol transport models are also used to provide aerosol forecasts, which have nu-merous applications, ranging from air quality forecasts in the near term to simulating aerosol distributions for various cli-mate scenarios on longer timescales. However, the current lack of uncertainty characterization limits the utility of global aerosol transport models (Huneuus et al, 2011; Textor et al., 2006; Kinne et al., 2006). Recently a number of modeling groups have adopted data assimilation capabilities to for-mally constrain the simulated AOT with observations from sensors such as MODIS (e.g., Sessions et al., 2015; Benedetti et al., 2009; Zhang et al., 2008). While it is a useful first-order constraint, assimilation of single-channel visible AOT observations do not correct uncertainty associated with spe-ciation and vertical distributions of aerosols. Uncertainties in the speciation and vertical structure of aerosols have signif-icant implications for characterizing aerosol transport path-ways, quantifying loss processes, and understanding aerosol– Earth system interactions (e.g., impacts of aerosols on cloud lifetimes; aerosol radiative forcing) that are sensitive to the vertical location of specific types of aerosol.
Important information about the vertical distributions of aerosols has long been available from ground-based (e.g., Huang et al., 2010; Johnson et al., 2008; Papayannis et al., 2005; Matthias et al., 2004; Reid et al., 2003; Campbell
et al., 2002; Welton et al., 2000, 2001) and airborne (e.g., Rogers et al., 2009; Esselborn et al., 2009; Reid et al., 2003; McGill et al., 2002; Browell et al., 1997; Browell et al., 1983) lidar systems, but by their nature these systems have limited spatial and temporal coverage. The launch of the space-based Cloud-Aerosol Lidar with Orthogonal Polariza-tion (CALIOP) aboard the Cloud-Aerosol Lidar and Infrared Pathfinder Satellite Observations (CALIPSO) satellite on 28 April 2006 vastly increased the spatial and temporal cov-erage of aerosol and cloud vertical profiles (Winker et al., 2009). As part of NASA’s “A-Train” (L’Ecuyer and Jiang, 2010) constellation of satellites, CALIPSO flies in formation with a number of other satellites, providing opportunities for coordinated multi-sensor retrievals of aerosol properties.
in 80 % of the CALIOP-identified dust cases, but generally worse agreement in the typing for other species. However, despite its utility as a tool for evaluating aerosol type, as far as we know no prior study has used the VFM to evaluate three-dimensional distributions of aerosol type in the context of a global model at monthly timescales.
In this paper, we use the CALIOP VFM to evaluate aerosol speciation and vertical structure in MERRAero, a recently produced aerosol reanalysis based on the Modern Era Retrospective Analysis for Research and Applications (MERRA; Rienecker et al., 2011). MERRAero is produced from a global aerosol simulation made using the NASA God-dard Earth Observing System version 5 (GEOS-5) Earth system model assimilating AOT derived from the MODIS Terra and Aqua observations. Assimilation of AOT con-strains the total aerosol loading in MERRAero but not the aerosol speciation or vertical structure. The model output aerosol mass and species distributions are subsequently sam-pled along the CALIOP ground track, and we compute pro-files of aerosol extinction and lidar observables (e.g., total attenuated backscatter, particulate depolarization ratio) us-ing an offline lidar simulator. Two model-based VFM prod-ucts are constructed from the profiles for comparison to the CALIOP VFM. The first product attempts to closely emu-late the CALIPSO VFM by simulating the CALIOP observ-ables (e.g., total attenuated backscatter, estimated particu-late depolarization ratio) from assimiparticu-lated fields and feed-ing them directly into the CALIOP VFM algorithm (our so-called “MERRAero-CALIOP” method). The second prod-uct is a model-derived VFM built by assigning aerosol type classification based on the individual species reported by MERRAero (our “MERRAero-Extinction” method). We fo-cus our analysis on July 2009 over and downwind of the dust-laden Sahara, which is dominated by the CALIOP VFM aerosol type (desert dust) that had best agreement with AERONET (Mielonen et al., 2009) and HSRL (Burton et al., 2013). The objectives of our study are to evaluate the MERRAero aerosol vertical profiles and to investigate the CALIOP VFM-derived aerosol typing in comparison to the known typing information provided by GEOS-5. Our use of two different model-derived VFMs is meant to untangle algo-rithmic sensitivity embedded in the CALIOP VFM as well as understand the sensitivity of derived aerosol type to assump-tions in our simulated aerosol optical properties (e.g., depo-larization ratio). Furthermore, this work has implications for assessing the appropriateness of the CALIOP-assigned lidar ratios for extinction calculations. It also lays the groundwork for future lidar-based observing system simulation experi-ments (OSSEs) and supports new instrument development by simulating fundamental observables.
In Sect. 2, we describe the CALIOP instrument, its mea-surements, and the VFM product. In Sect. 3 we provide a de-scription of the NASA GEOS-5 aerosol model and the MER-RAero aerosol reanalysis, and we provide an assessment of the MERRAero performance in terms of MODIS, MISR, and
AERONET observation. In Sect. 4, we describe our method-ology for evaluating MERRAero with the CALIOP VFM and how we construct our model-derived VFMs using MER-RAero assimilated fields. Our results are presented in Sect. 5; in Sect. 6 we provide our conclusions.
2 The CALIOP instrument, feature detection, and vertical feature mask
2.1 The CALIOP instrument
CALIOP provides near-nadir vertical profiles of cloud and aerosol properties onboard the NASA CALIPSO satellite, flying in a sun-synchronous polar orbit in formation with a series of Earth observing systems in the so-called A-Train (L’Ecuyer and Jiang, 2010). CALIOP is a two-wavelength li-dar system providing attenuated backscatter data at 532 and 1064 nm (Winker et al., 2006). Additionally, CALIOP is de-signed to provide polarization-sensitive data at 532 nm to gain insight into particle shape (and cloud phase). These data include 532 nm profiles of parallel and perpendicular (rela-tive to the laser polarization plane) attenuated backscatter. As an active sensor, CALIOP provides information during both the daytime (13:30 local Equator-crossing time) and nighttime (01:30 local Equator-crossing time) (Winker et al., 2006). CALIOP makes measurements with a frequency of 20.16 Hz, yielding a horizontal resolution of 333 m at the Earth’s surface (Winker et al., 2006). The vertical resolu-tion of CALIOP varies, ranging from 300 m at the top of the CALIOP detection altitude (30.1–40 km) to 30 m within the typical altitude range where aerosols are observed near the Earth’s surface (−0.5 to 8.2 km) (Winker et al., 2006). Day-time CALIOP observations are affected by solar background illumination, which decreases the signal-to-noise ratio, mak-ing the daytime measurements more challengmak-ing to interpret. For our analysis we use CALIOP Version 3.01 data. For fur-ther information, including instrument specifications, we re-fer to Winker et al. (2006).
2.2 Feature detection
pro-file (Vaughan et al., 2005). Features with strong backscat-ter ratios may require only a single lidar pulse for detection. However, fainter features often require horizontal averaging anywhere from 5 to 80 km along-track to ensure detection in instances when the backscattering ratio is inhomogeneous, varying significantly along the track (Winker et al., 2006). Unfortunately, limitations of this averaging include poten-tially eliminating important spatial variability in the layer and may result in cloud and aerosol features being averaged to-gether. On the other hand, despite often requiring horizon-tal averaging for CALIOP Level 2 products, features identi-fied in the vertical by CALIOP are often at horizontal resolu-tions finer than most global aerosol models, and so they still provide a useful tool for evaluating the vertical location of aerosols in this model.
2.3 Vertical feature mask
Once a feature has been identified, the CALIOP feature-finding algorithm utilizes a five-dimensional probability den-sity function (PDF) derived from observed cloud and aerosol properties that input the magnitude of attenuated backscatter, volume depolarization ratio, latitude, altitude, and the color ratioχ=β’1064/β’532, defined as the ratio of the attenuated backscatter at 1064 nm (β’1064)and 532 nm (β’532)to dis-tinguish clouds from aerosols (Liu et al., 2010). Compared to aerosols, clouds exhibit enhanced attenuated backscatter values, so features with strong attenuated backscatter values are classified as cloud (Liu et al., 2005). Clouds also have larger particles compared to aerosols, and at CALIOP wave-lengths the attenuated backscatter is expected to be spectrally flat, and thusχ≈1 (Liu et al., 2005). For aerosols, the atten-uated backscatter at 1064 nm is expected to be less than the attenuated backscatter at 532 nm, so features withχ <1 are classified as aerosol (Liu et al., 2005).
Once an observed feature has been detected and classified as an aerosol, the data are fed to the CALIOP VFM algo-rithm for further classification into aerosol type (Omar et al., 2009). The CALIOP algorithm assumes representative mod-els of aerosol optical properties based on a multiyear clus-ter analysis of measurements made by the AERONET of sun photometers (1993–2002) (Omar et al., 2005). The al-gorithm has models for six aerosol types or mixtures: dust, polluted continental, polluted dust, smoke, clean continental, and clean marine (Omar et al., 2009). Once an observed fea-ture has been identified as aerosol, the attenuated backscat-ter at 532 nm is integrated between the feature base and top (Omar et al., 2009):
γ′= zZbase
ztop
β(z)T (z)dz, (1)
where γ′ is the integrated total attenuated backscatter at 532 nm, β is the total (molecular+particulate) backscat-ter at 532 nm at altitude (z), and T is the total
(molecu-lar+particulate) atmospheric transmittance at altitude (z) (Omar et al., 2009).
Additionally, the volume (molecular+particulate) depo-larization ratio at 532 nm is computed as the ratio of the perpendicular to parallel contributions to the total attenuated backscatter (Omar et al., 2009):
δv′ = zPtop
zbase β⊥′(z)
zPtop
zbase βII′(z)
, (2)
whereδv′ is the volume depolarization ratio of the feature at 532 nm,β’⊥is the perpendicular attenuated backscatter
sig-nal at 532 nm at altitude (z), andβ’I I is the parallel
attenu-ated backscatter signal at altitude (z).
Using the volume depolarization ratio and assuming a molecular depolarization ratio of 0.0036 (Omar et al., 2009), the particulate depolarization ratio is estimated for input into the CALIOP VFM algorithm:
δep=δ
′
v[(R−1)(1+δm)+1] −δm (R−1)(1+δm)+δm−δ′
v
, (3)
whereδep,δv′, andδmare the estimated particulate, volume,
and molecular depolarization ratios at 532 nm, respectively, andR is the mean ratio of the total attenuated backscatter to the molecular backscatter. It should be noted that Eq. (3) is the estimated particulate depolarization ratio and that, in order to obtain the actual particulate depolarization ratio,R is defined as the ratio of the total to molecular backscatter, not the ratio of the total attenuated backscatter (measured by CALIOP) to molecular backscatter. DefiningR in this way leads to estimated particulate depolarization ratios that ex-ceed the actual particulate depolarization ratio (Omar et al., 2009; Amiridis et al., 2013). In Sect. 4.2, where we describe our MERRAero-based CALIOP VFM, we are also using an estimated particulate depolarization ratio derived from a ver-sion of Eq. (3) to mimic the CALIOP VFM algorithm. We find that using the estimated particulate depolarization ratio vs. the actual particulate depolarization ratio has little impact on our aerosol typing.
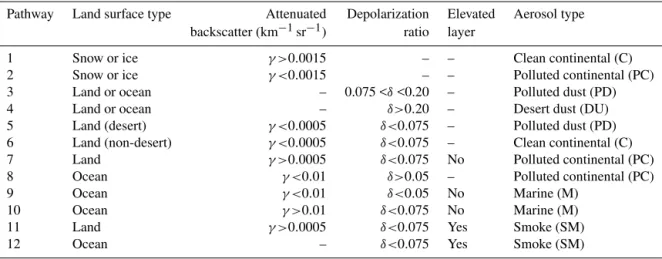
Table 1.CALIOP VFM mapping algorithm presented in table form. We refer for Omar et al. (2009) for an algorithm flowchart. “–” indicates
that the property of an aerosol layer is not considered in assigning aerosol type.
Pathway Land surface type Attenuated Depolarization Elevated Aerosol type backscatter (km−1sr−1) ratio layer
1 Snow or ice γ >0.0015 – – Clean continental (C)
2 Snow or ice γ <0.0015 – – Polluted continental (PC)
3 Land or ocean – 0.075 <δ<0.20 – Polluted dust (PD)
4 Land or ocean – δ>0.20 – Desert dust (DU)
5 Land (desert) γ <0.0005 δ<0.075 – Polluted dust (PD) 6 Land (non-desert) γ <0.0005 δ<0.075 – Clean continental (C) 7 Land γ >0.0005 δ<0.075 No Polluted continental (PC) 8 Ocean γ <0.01 δ>0.05 – Polluted continental (PC)
9 Ocean γ <0.01 δ<0.05 No Marine (M)
10 Ocean γ >0.01 δ<0.075 No Marine (M)
11 Land γ >0.0005 δ<0.075 Yes Smoke (SM)
12 Ocean – δ<0.075 Yes Smoke (SM)
depolarization ratio is used to identify non-spherical particles (e.g., dust) or mixtures that contain non-spherical particles (e.g., polluted dust). Surface type (snow or ice, desert, etc.), along with location and altitude (elevated vs. non-elevated aerosol layer) are also used to determine aerosol type in in-stances when mapping using observables alone is inconclu-sive. As an example, an elevated aerosol layer with a low par-ticulate depolarization ratio over the Amazon would point to the smoke VFM flag. If the same aerosol layer extended to the surface, the VFM algorithm would point to the polluted continental flag. The CALIOP VFM aerosol types and logic pathways are illustrated in Table 1.
For our analysis, we use the six aerosol types identified in the CALIOP algorithm to validate our model: dust, pol-luted dust, polpol-luted continental, clean continental, marine and smoke. Additionally, we include flags for clouds and sig-nal attenuation (no sigsig-nal), the Earth’s surface, and instances when the quality assurance flags are equal to zero for the ture type (cloud–aerosol detection failure) or the aerosol fea-ture subtype (aerosol typing failure). For further information into the specifics of the CALIOP VFM algorithm, we refer to Omar et al. (2009).
3 The NASA GEOS-5 global aerosol transport model 3.1 GEOS-5 model description
GEOS-5 is an Earth system model and data assimilation sys-tem developed by the NASA Global Modeling and Assim-ilation Office (GMAO) that contains components for atmo-spheric circulation and composition, ocean circulation and biogeochemistry, and land surface processes coupled via the Earth System Modeling Framework (ESMF) (Hill et al., 2004). GEOS-5 is used for studying weather and climate variability, providing high-quality meteorological and chem-ical analyses for NASA instrument teams and the
scien-tific community. Along with traditional meteorological pa-rameters (winds, temperature, etc.) (Rienecker et al., 2008), GEOS-5 includes modules representing atmospheric compo-sition, including aerosols (Colarco et al., 2010) and tropo-spheric/stratospheric chemical constituents (Pawson et al., 2008), and simulates the radiative impact of these con-stituents on the atmosphere.
GEOS-5 may be run at a range of spatial resolutions, from 2◦×2.5◦ latitude by longitude to ∼3.5 km×3.5 km on a
cubed-sphere grid (Putman and Suarez, 2011). In the verti-cal, GEOS-5 has 72 levels on a hybrid-eta coordinate system that is terrain-following near the surface, transitioning to a pressure coordinate above 180 hPa, with a model top near 85 km. GEOS-5 may be run in a climate simulation mode, or in a data assimilation mode. For our simulations, we ex-ploit the capability of GEOS-5 to run in replay mode, where, rather than re-running the full meteorological data assimila-tion system, we replace the dynamical state of the system with a prior data assimilation run. In this analysis, we replay using the MERRA (Rienecker et al., 2011) data set, available every 6 h at a spatial resolution of 0.5◦×0.625◦.
For all species except dust, aerosol optical properties are computed assuming Mie theory, with refractive indices and hygroscopic growth factors primarily from the Optical Prop-erties of Aerosols and Clouds (OPAC) database (Hess et al., 1998) and assumed particle size distributions as in Chin et al. (2002) (for sea salt discretize the particle size distribu-tion across the five size bins and assume the sub-bin particle size distribution from Gong (2003) and hygroscopic growth based on Gerber (1985)). For dust, we use an observation-derived set of refractive indices and assume a spheroidal par-ticle shape distribution, following the methodology described in Colarco et al. (2014a) and using the database of non-spherical dust optical properties from Meng et al. (2010).
Aerosol optical properties, whether from Mie theory or the non-spherical dust optical properties database, are presented in look-up tables that provide quantities such as the mass ex-tinction, scattering, and backscattering efficiencies; particu-late depolarization ratio; and phase function, as a function of wavelength, relative humidity, and dry particle size. We straightforwardly convert our simulated mass mixing ratios to aerosol optical properties using these tables. Aerosol par-ticulate depolarization ratios are determined from the Leg-endre polynomial moments of the polarized phase function (for dust only; other species are assumed to have depolariza-tion ratio=0), and total particulate depolarization ratio is de-termined by weighting by each aerosol species contribution to scattering. Prior to our construction of our MERRAero VFMs, we found that our simulated particulate depolariza-tion ratios are approximately 0.25 in dusty regions, lower than the observed values of 0.32 (Liu et al., 2008) and 0.31 (Freudenthaler et al., 2009) for Saharan dust events. Sensi-tivity analyses we performed (not shown here) suggest that our simulated dust depolarization ratio is not strongly sensi-tive to any errors we have in the simulated dust particle size, as suggested by Freudenthaler et al. (2009), so we speculate here that we are fundamentally limited either because of our assumption that dust particles are ellipsoidal or because of our assumption that they are homogeneous in composition. Imaging of dust particles shows that neither assumption is true (e.g., Buseck and Posfai, 1999), and there is at least the-oretical evidence that inclusion of heterogeneity within par-ticles can lead to higher depolarization ratios (Mishchenko et al., 2013). In an attempt to match observed depolarization ratios (∼0.31), we therefore increase our simulated dust de-polarization ratios by 30 % for our analysis. Finally, as a note about the modeling, this discussion of dust non-sphericity ap-plies only to our optical calculations and is not considered in the simulated transport or removal processes (e.g., sedimen-tation).
3.2 Aerosol data assimilation
Similar to our method of correcting the meteorological state using MERRA, we assimilate column AOT derived from the MODIS instruments onboard the NASA Terra (launched 12
December 1999) and Aqua (launched 4 May 2002) satel-lites. This AOT assimilation algorithm involves cloud screen-ing and homogenization of the observscreen-ing system to cor-rect for unresolved biases in the aerosol retrieval products (see Zhang and Reid, 2006). Based on the work of Zhang and Reid (2006) and Lary et al. (2010) we originally de-veloped a back-propagation neural network to correct ob-servational biases in MODIS operational retrievals trained to AERONET coincident observations. We later evolved this system into a neural net type of retrieval that translates cloud-cleared MODIS reflectances into AERONET calibrated AOT (referred to hereafter as “MODIS NNR”). In this system, reflectances (instead of retrievals) provide the main input, alongside solar and viewing geometry, MODIS cloud cover, climatological surface albedo and model-derived surface wind speed. Online quality control is performed with the adaptive buddy check of Dee et al. (2001), with observation and background errors estimated using the maximum likeli-hood approach of Dee and da Silva (1999). The AOT anal-ysis in GEOS-5 is performed by means of analanal-ysis splitting where first a two-dimensional analysis of AOT is performed using error covariances derived from differences between ob-servations and the model background (Daley, 1991). Then, the three-dimensional analysis increments (analysis minus first guess) of aerosol mass concentration are computed us-ing an ensemble formulation to represent the background er-ror covariance. This calculation is performed using the Local Displacement Ensemble (LDE) methodology under the as-sumption that ensemble perturbations (Daley, 1991) are used to represent errors in the placement of the aerosol plumes. These ensemble perturbations are generated with full model resolution, without the need for multiple model runs. It is im-portant to note that the single-channel MODIS AOT obser-vations does not have sufficient information content to con-strain aerosol speciation and vertical structure, and the ver-tical structure of the analysis increments are determined by assumed error covariance.
The simulation of the global aerosol field in GEOS-5, driven by the MERRA atmospheric analyses and assimilat-ing the MODIS-derived AOT is our so-called MERRAero aerosol reanalysis. MERRAero is performed at a horizontal spatial resolution of 0.5◦×0.625◦latitude by longitude and
spans the time period from mid-2002 to the present. Appli-cations of MERRAero are described in several recent papers, including Kessner et al. (2013), Buchard et al. (2014, 2015), Colarco et al. (2014b), and Yasunari et al. (2015).
over the Sahara and the tropical North Atlantic Ocean to several satellite-derived AOT products. Observations from MISR (Fig. 1b) provide AOT retrievals at 558 nm under cloud-free conditions, combining information from nine dif-ferently angled push-broom cameras that observe the same scene on Earth over a period of 7 min. Owing to this multi-angle viewing geometry, MISR is able to provide retrievals over bright surfaces (Diner et al., 1998; Abdou et al., 2005), with additionally some insight into particle size, shape, and composition. The MISR swath width along the ground is about 360 km, providing global coverage approximately ev-ery 9 days. MISR Level 2 AOT values from the latest ver-sion of the MISR aerosol retrieval algorithm (v. F12_0022) are used at 558 nm. In addition to MISR, we show the stan-dard Collection 5.1 (Fig. 1c) retrieval from MODIS Aqua at 550 nm, providing near-daily coverage at 10 km×10 km spatial resolution. Operationally, MODIS retrieves AOT un-der cloud-free conditions using reflectances at six visible channels over ocean (Tanré et al., 1997), and over dark land surfaces using two visible and one near-IR channel (Kauf-man et al., 1997; Levy et al., 2007a, b). Aerosols are not re-trieved over bright desert surfaces in the standard “dark tar-get” land algorithm. We also show the MODIS NNR assim-ilated in MERRAero (Fig. 1d). For our evaluation, we have regridded all satellite observations to the GEOS-5 grid using a simple box averaging approach.
For a consistent comparison between MISR and GEOS-5, we sample our GEOS-5 AOT at the model grid cell that contains the MISR observation at the nearest hourly output time. Compared to MISR, MERRAero captures the general position and AOT magnitude of the observed Saharan dust plume emerging from northern Africa and carried toward the Caribbean. Over the Caribbean, however, the AOT magni-tude of the plume is slightly underestimated in MERRAero when compared to MISR, potentially due to cloud contam-ination in the MISR aerosol retrieval over the ocean (Shi et al., 2014). Over northern Africa, peak AOT values are ob-served by MISR over Lake Chad and Mali, and these AOT values are greater than what is simulated in MERRAero. For comparison, the standard Collection 5.1 MODIS AOT prod-uct (Fig. 1c) shows a much fuller picture of the Saharan aerosol plume, reflecting the greater spatial coverage rela-tive to MISR, except over land. The monthly mean MODIS NNR AOT (Fig. 1d) is most like MERRAero, which is natu-ral as that was the product assimilated. Note that the quality screening of the MODIS data used to compile the NNR AOT results in a lower AOT over the Caribbean than in either the MODIS Collection 5.1 or MISR AOT products.
For a more quantitative evaluation of MERRAero, we compare all AERONET observations of AOT at 550 nm and AE (440–870 nm) available in our region of interest (20◦S–
45◦N; 100◦W–60◦E) for July 2009 in Fig. 2. AERONET
provides measurements of AOT using direct solar extinc-tion measurements at 340, 380, 440, 500, 670, 870, and 1020 nm, with 15 min temporal resolution (Holben et al.,
2001). We use quality-assured and cloud-screened (Level 2) hourly AERONET AOT values (Smirnov et al., 2000) for comparison to MERRAero. AE is a measure of the depen-dence of AOT on wavelength, which is a function of particle size (Eck et al., 1999) and fine-mode AOT fraction (Schuster et al., 2006). Larger particles like dust typically exhibit AE values less than 1, while smaller particles have AE values greater than 1 (Eck et al., 1999). Compared to AERONET, MERRAero AOT is well correlated (r2=0.716) and has a low bias (−0.016) at 285 696 observations during July 2009. MERRAero AE values are slightly less correlated (r2=0.653) and are biased high (0.115), particularly at low AE values, suggesting that, compared to AERONET, we are simulating aerosols that are too small due to an incorrect rep-resentation of the particle size distribution or the incorrect aerosol speciation (e.g., dust vs. smoke).
In Fig. 3, we evaluate the timing and magnitude of MERRAero-simulated AOT and AE by comparing them to several AERONET stations near and downwind of the Sa-haran source region (station locations in Fig. 1a). Figure 3a compares AOT at 550 nm and AE (440–870 nm) values be-tween AERONET hourly observations and corresponding MERRAero values for two stations near the Saharan source region. At Cabo Verde, an island site off the west African coast and under the main dust pathway, MERRAero captures the timing and observed magnitude of AOT during July with a modest correlation coefficient (r2=0.437). AE values ob-served by AERONET at Cabo Verde are predominantly less than 1, indicating the presence of dust aerosols (Fig. 3a). Comparatively, MERRAero AE values are less than 1 and not well correlated (r2=0.209) when compared to those ob-served by AERONET, again indicating that we are simulat-ing aerosols that are too small due to an incorrect representa-tion of the dust particle size distriburepresenta-tion or too large of a con-tribution from anthropogenic aerosols, such as biomass burn-ing at this location. On the northern edge of the dust plume, at Santa Cruz, Tenerife, MERRAero is more comparable to the observed AOT magnitude and time series (r2=0.770), and it accurately captures the passage of several high-AOT events in the latter part of the month (Fig. 3a). Similar to Cabo Verde, both AERONET and MERRAero AE values are predominantly less than 1 (r2=0.685), though the model is again biased slightly high throughout the month.
Figure 1.July 2009 AOT for MERRAero sampled along MISR track(a), MISR(b), MODIS Aqua standard retrieval(c), and MODIS Aqua
NNR(d)with AERONET locations overlaid (1 – Cabo Verde; 2 – Santa Cruz, Tenerife; 3 – Camaguey; and 4 – La Parguera). White areas
correspond to regions where no aerosol retrievals were made.
Figure 2.AOT (left) and AE (right) comparisons between MERRAero and AERONET hourly observations (20◦S–45◦N; 100◦W–60◦E)
for July 2009. The number of comparisons at each AERONET station is indicated by the color bar.
timing and magnitude of AOT (r2=0.828); though consis-tent with our comparison at Camaguey, MERRAero AE val-ues are slightly biased high when compared to AERONET and are moderately correlated (r2=0.584).
In Fig. 4 we compare monthly mean MERRAero dust ver-tical extinction profiles to those determined by CALIOP us-ing the VFM. By usus-ing aerosol layers identified as desert dust by the CALIOP VFM, the observed backscatter signal can be converted to extinction using the lidar ratio and the dust
ex-tinction may be separated from the total exex-tinction (Winker et al., 2013). In Fig. 4, CALIOP dust extinction data are from their monthly Level 3 gridded (5◦longitude×2◦
lati-tude) product, and the MERRAero dust extinction is sampled along the CALIPSO track and across desert dust features ob-served by CALIOP at several longitudes moving westward from the Saharan dust source region. Over the source region, at 7.5◦W, MERRAero simulates peak dust extinction values
Figure 3.AERONET (red) comparisons to MERRAero (black) AOT and Ångström exponent at sites near the source region(a)and downwind
in the Caribbean(b).
Figure 4.July 2009 CALIOP (top) dust and MERRAero (bottom) dust and sea salt (contour) Level 3 extinction at several north–south slices
dust confined to lower altitudes and further to the south. We note again that there is no MODIS-derived AOT to assimi-late over bright surfaces such as the Saharan source region, which would impact simulated dust plume position and tim-ing, potentially influencing the simulated vertical aerosol dis-tribution when sampled coincident with CALIOP dust fea-tures. Moving to the west at 27.5◦W (in the tropical
At-lantic, west of Cabo Verde), MERRAero accurately captures the magnitude of the elevated (2–5 km altitude) dust over the tropical North Atlantic Ocean, though the model does not simulate peak high extinction values below 1 km and trans-ports slightly more dust both to the north and south when compared to CALIOP. Further to the west at 47.5◦W,
MER-RAero again captures observed extinction magnitudes and elevation where CALIOP observes dust, but again it trans-ports more dust to the north and south of the observed plume. Once again the high extinction values observed by CALIOP at altitudes below 1 km are not found in the MERRAero sim-ulation.
Figure 4 shows that MERRAero is able to capture the CALIOP-retrieved elevated dust layers, but not the features seen in CALIOP at low altitudes. The low-level “dust” fea-tures seen in the Level 3 CALIOP extinction product high-light the importance of identifying the correct aerosol type in the VFM, as it is central to identifying these features as dust, and hence assigning a dust-appropriate lidar ratio to compute extinction. Recently, Amiridis et al. (2013) found that these low-level dust features result from the CALIOP feature detection and averaging scheme, which tends to ex-clude non-dust aerosol layers within dust layers if they are located at the same altitude and will classify the entire al-titude range as desert or polluted dust. Misidentification of the feature as dust instead of, say, marine could explain these features. Applying the CALIOP-assigned marine lidar ratio (20 sr) instead of what is used for dust (40 sr) would reduce the CALIOP extinction by 50 % for these layers, resulting in extinction values that are comparable to MERRAero. In Fig. 4, we also include the MERRAero sea salt extinction and we see correspondence between low-level MERRAero sea salt and low-level CALIOP dust. However, it is also pos-sible that the model is simply missing the presence of low-altitude dust layers over the tropical North Atlantic.
4 Methodology for constructing MERRAero vertical feature masks and application to a case study Here we use as an example the CALIOP sampled night-time aerosol profile (0Z–1Z) across northern Africa on 7 July 2009 (Fig. 5a) to illustrate the CALIOP VFM product and our two synthetic vertical feature masks derived from the MERRAero-simulated aerosol fields. The first of our model-derived VFMs is our MERRAero-CALIOP method, in which we compute the total attenuated backscatter and estimated particulate depolarization ratio (see Eq. 3) profiles based on
the MERRAero fields and provide those as inputs to the CALIOP VFM algorithm discussed in Sect. 2.3. Our second model-derived VFM is our MERRAero-Extinction method, in which we map the simulated MERRAero aerosol com-position distributions to the types identified by the CALIOP VFM based on the simulated speciated extinction. In prac-tice, our MERRAero-Extinction method is limited in that we are not simulating exactly the aerosol classifications speci-fied in the CALIOP VFM, so this method has some subjec-tivity associated with it. By constructing two MERRAero-derived VFMs in this manner, we identify two distinct objec-tives. First, by comparing the MERRAero-CALIOP VFM to the observed CALIOP VFM, we can identify biases in MER-RAero aerosol speciation and transport. Then, by comparing our two entirely synthetic MERRAero VFMs, we can docu-ment the ability of the CALIOP VFM algorithm to properly identify aerosol types and identify shortcomings of the algo-rithm itself.
4.1 Sampling MERRAero
As mentioned in Sect. 2, the CALIOP feature-finding al-gorithm looks for enhanced attenuated scattering ratio pro-files to differentiate aerosol and cloud features from molec-ular backscatter. For a given column, up to eight-layer fea-tures are permitted in the detection algorithm. For sampling MERRAero along CALIOP aerosol features, we use the 5 km Level 2 CALIOP layer product, which provides feature ver-tical thickness and location at 5 km spatial resolution.
We sample MERRAero at the location of each aerosol fea-ture in the 5 km Level 2 CALIOP layer product, so there is a direct correspondence between CALIOP aerosol fea-tures and the MERRAero model fields that are used to con-struct the MERRAero-CALIOP and MERRAero-Extinction VFMs. We then regrid all VFMs to the GEOS-5 grid by tak-ing the mode value (VFM flags are qualitative and cannot be averaged; hence the most frequent feature type is used) in the altitude, latitude, and longitude range of a GEOS-5 grid box. As a sensitivity test to our sampling methodologies, we ex-plored the impact of first averaging CALIOP features to the GEOS-5 grid before applying our MERRAero VFM algo-rithms and found little sensitivity of aerosol typing to aggre-gation methodology due to the coarse resolution of GEOS-5 when compared to CALIOP.
of our aerosol optical properties’ look-up tables (Sect. 3.1) to the simulated mass mixing ratios. In order to account for the molecular contribution to our simulated total attenuated backscatter, we follow Russell et al. (1993) to parameterize the Rayleigh backscatter coefficient and molecular optical thickness. We then construct the total attenuated backscatter signal by adding the particulate and molecular backscatter coefficients multiplied by the particulate and molecular two-way transmittances. Because the estimated particulate depo-larization ratio and not the actual particulate depodepo-larization ratio is fed into the CALIOP VFM algorithm, we compute the estimated particulate depolarization ratio from our actual particulate depolarization ratio using Eq. (3). We again note that the estimated particulate depolarization ratio is greater than the actual particulate depolarization ratio; however, we find that this has little impact on our aerosol typing in our MERRAero-CALIOP VFM (not shown).
On 7 July 2009 CALIPSO flew southwestward, beginning over Russia, crossing over northeastern Africa, across cen-tral Africa, and south to the southwestern corner of Africa (Fig. 5a). In the model we see this track crossing several different aerosol regimes, and the simulated total extinction profile (Fig. 5b) shows several distinct features and plumes of different depths (labeled A, B, and C). The CALIOP to-tal attenuated backscatter and volume depolarization ratio (averaged to 5 km) for this case study are shown in Fig. 5e and f, respectively. In Fig. 5c and d, MERRAero total attenu-ated backscatter and estimattenu-ated particulate depolarization ra-tio are shown. Comparing the MERRAero and CALIOP to-tal attenuated backscatter (Fig. 5c and e), we see the MER-RAero profile is mostly comparable to CALIOP, showing an aerosol layer from the surface to about 4 km altitude over eastern Europe and Turkey (Fig. 5b – feature A), followed by an aerosol layer with a top varying in altitude between 2 and 6 km that corresponds to high AOT over northern Africa (Fig. 5b – feature B), and finally an optically thick aerosol layer over central Africa extending to 4 km (Fig. 5b – fea-ture C). Comparing the depolarization ratio profiles along the track (Fig. 5d and f), MERRAero is comparable to CALIOP, showing volume depolarization ratio values ranging from 0.1 to beyond 0.2 over northern Africa (feature B), which is in-dicative of dust aerosols, although the MERRAero values extend to higher altitudes when compared to CALIOP for this case study. Comparing MERRAero extinction to the es-timated depolarization ratio, we see that this bias occurs at altitudes where the dust loading is quite low in the model but is nevertheless above the minimum extinction detection lim-its of CALIOP (0.003 km−1; Winker et al., 2013), indicating
that MERRAero is transporting dust to higher altitudes when compared to CALIOP for this case. The depolarization ratio for the aerosol feature over central Africa is near zero in both CALIOP and MERRAero (feature C), a signature of spher-ical aerosols such as aged smoke. Looking at the simulated species, we attribute feature C to biomass burning smoke,
which is consistent with the season and geographical location and is borne out in the aerosol typing (see below, Fig. 6).
For each aerosol feature identified in the Level 2 CALIOP layer product, we first require a minimum simulated 532 nm MERRAero extinction threshold of 0.003 km−1, which cor-responds to the CALIOP minimum detectable signal for ma-rine aerosol at night, at 1 km altitude, and for maximum fea-ture horizontal averaging (80 km) (Winker et al., 2013). We select marine aerosol for our minimal extinction threshold as it has the smallest lidar ratio; therefore, for a given backscat-ter in an aerosol layer, marine aerosol will have the lowest corresponding extinction and is thus the most conservative extinction threshold choice. We implement this requirement to prevent flagging MERRAero aerosol layers that would not be detected by CALIOP. If the minimum extinction thresh-old is not met, the feature will be flagged as clear in the MERRAero-CALIOP VFM.
Next, the MERRAero total attenuated backscatter and esti-mated particulate depolarization ratios are calculated across the feature altitude using Eqs. (1) and (3), and, along with IGBP surface type and feature altitude, are then fed to the VFM algorithm in Table 1 to assign one of the six CALIOP aerosol types. By applying the CALIOP VFM in this way, there is a direct correspondence between aerosol layers iden-tified by CALIOP and those sampled in MERRAero to con-struct a comparable VFM.
If CALIOP does not identify an aerosol layer, MERRAero will not be sampled in the model. In this method, MER-RAero is only sampled where CALIOP identifies an aerosol feature and, if the aerosol layer exceeds our minimal extinc-tion threshold, one of the six aerosol types in Table 1 will be flagged to construct the MERRAero-CALIOP VFM.
4.3 The MERRAero-Extinction method: constructing a VFM from MERRAero fields
As an alternative to the direct simulation of the CALIOP VFM from a MERRAero CALIOP simulator as described above, we have also constructed a VFM that maps the aerosol types explicitly simulated in MERRAero to the aerosol types in the CALIOP VFM. In this way, the MERRAero-Extinction VFM provides a CALIOP-like VFM that is rep-resentative of the aerosols simulated in MERRAero. We re-call that there are five aerosol types simulated in MERRAero (dust, sea salt, black carbon, organic carbon, and sulfate).
The first step in this MERRAero-Extinction MERRAero classification algorithm is the same as in the MERRAero-CALIOP method, with a threshold extinction of 0.003 km−1.
Figure 5. (a)MERRAero 550 nm total AOT at 00:00 UTC and CALIPSO track from 00:00 to 01:00 UTC over three different aerosol regimes, (b)MERRAero 532 nm total extinction,(c)MERRAero 532 nm total attenuated backscatter,(d)MERRAero volume depolarization ratio, (e)CALIOP 532 nm total attenuated backscatter, and(f)CALIOP volume depolarization ratio on 7 July 2009.
Figure 6. (a)CALIOP VFM,(b)MERRAero-CALIOP VFM, and
(c)MERRAero-Extinction on 7 July 2009. Aerosol types include
smoke (SM), polluted dust (PD), desert dust (DU), clean continen-tal (C), and marine (M). Regions free of aerosol and clouds are clas-sified as clear. Clouds (CL) and associated signal attenuation (NS), as well as the surface (SF), are also shown.
aerosol type (dust, sea salt, sulfate, black and organic carbon) to extinction using look-up tables of mass extinction efficien-cies for each aerosol type (Sect. 3.1). This method should be distinguished from the CALIOP method of converting the backscatter to extinction via the lidar ratio.
If our threshold requirement is met, we determine the indi-vidual extinction for each of the simulated aerosol types over the feature altitude range. For simplicity of type assignment we aggregate the black and organic carbon together to be a single carbonaceous species, which is practically used to as-sign aerosol types to the CALIOP “smoke” classification (see below, and Table 2). Because we consider four independent aerosol types in MERRAero, we consider the presence of a specific aerosol to be significant if it contributes at least 25 % of the total extinction across a feature. For example, if the to-tal extinction across a feature is greater than 0.003 km−1and
dust and carbon each contribute > 25 % to the feature sig-nal, then both dust and carbon are flagged as being present. In our MERRAero-Extinction method, it is possible that ex-tinction values will not meet threshold criteria, and so our aerosol typing can be flagged as clear even where CALIOP has identified a layer.
Table 2.Mapping of MERRAero aerosol mixtures to CALIOP VFM flags.
CALIPSO and MERRAero aerosol VFM types
MERRAero-Extinction aerosol mixtures
MERRAero-Extinction minimum aerosol fractions for typing
No signal or cloud N/A N/A
Marine (M) Sea salt Fss≥0.75
Desert dust (DU) Dust Fdu≥0.75
Polluted continental (PC) Sulfate+carbon Fsu, Fc≥0.25, Fsu+Fc≥0.75
Clean continental (C) Sulfate Fsu≥0.75
Polluted dust (PD) Dust+sulfate Dust+carbon
Dust+sulfate+carbon Dust+sea salt
Dust+sulfate+sea salt Dust+carbon+sea salt
Fdu, Fsu≥0.25, Fdu+Fsu≥0.75 Fdu, Fc≥0.25, Fdu+Fc≥0.75
Fdu, Fsu, Fc≥0.25, Fdu+Fsu+Fc≥0.75
Fdu, Fss≥0.25, Fdu+Fss≥0.75
Fdu, Fsu, Fss≥0.25, Fdu+Fsu+Fss≥0.75 Fdu, Fc, Fss≥0.25, Fdu+Fc+Fss≥0.75
Smoke (SM) Carbon Fc≥0.75
N/A Sea salt+carbon
Sea salt+sulfate
Fss, Fc≥0.25, Fss+Fc≥0.75
Fss, Fsu≥0.25, Fss+Fsu≥0.75
VFM, as we do not explicitly simulate the mixtures of aerosols that are flagged by the CALIOP VFM (e.g., pol-luted dust). Our mapping to the CALIOP VFM aerosol types and the minimal fraction of each MERRAero aerosol type for each CALIOP aerosol type is laid out in Table 2. Some of the MERRAero to CALIOP VFM mapping is straightfor-ward, such as desert dust, but in other cases – specifically those related to polluted aerosol types – the typing criteria are more subjective. For example, in grid cells where dust, sea salt, or sulfate aerosol meet the total extinction threshold and are the only aerosol types to contribute at least 25 % to the total extinction signal, these cells are mapped directly to the desert dust, marine, or clean continental CALIOP VFM flags, respectively. The CALIOP Algorithm Theoretical Ba-sis Document (ATBD) (Liu et al., 2005) indicates that the polluted continental flag could be representative of a sooty sulfate aerosol. Therefore, we map our MERRAero car-bon+sulfate mixtures to the polluted continental CALIOP VFM flag. Similarly, the CALIOP algorithm indicates that the polluted dust flag is representative of a dust+smoke or a dust+sulfate mixture. In practice, CALIOP identifies any dust+other aerosol mixture as polluted dust (Omar et al., 2009). Therefore, to be consistent with CALIOP, any fea-ture where dust and another aerosol species each contribute to at least 25 % of the total extinction is mapped to polluted dust. For our aforementioned hypothetical feature that meets the extinction threshold criteria and for which both dust and carbon contribute each to > 25 % of the extinction signal, the feature would be identified as polluted dust using the MERRAero-Extinction method (Table 2).
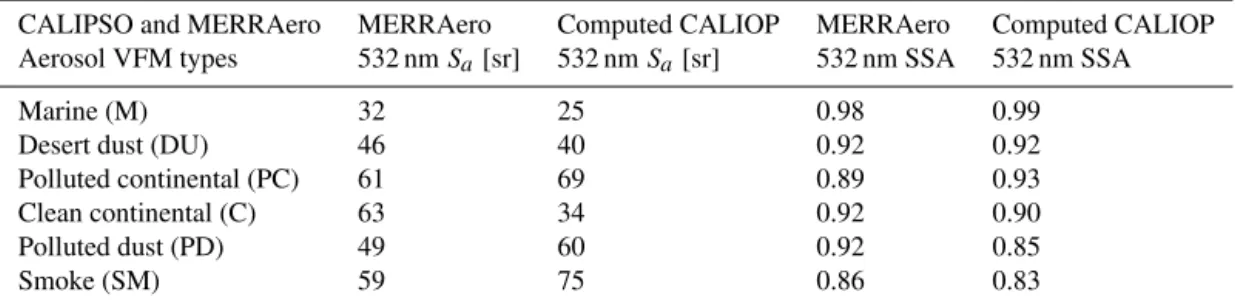
In Table 3 we compare 532 nm lidar ratios (Sa)and SSA
from our average MERRAero-Extinction mapping of MER-RAero aerosols to CALIOP aerosol types to CALIOP val-ues derived by applying Mie theory directly to the physi-cal and optiphysi-cal properties of the CALIOP aerosol models for July 2009 (Table 1 from Omar et al., 2009). We note that our methodology differs slightly from Omar et al. (2009) as the discrete-dipole approximation was used to determine the optical properties for CALIOP dust particles; however, our MERRAero lidar ratio for desert dust is comparable to the value used in the VFM algorithm (Omar et al., 2009). While both the MERRAero and CALIOP lidar ratios for desert dust are lower than those observed for Saharan dust by surface measurements (Tesche et al., 2009; Amiridis et al., 2013; Kanitz et al., 2014), desert dust and polluted dust layers are classified using the estimated particulate depolarization ratio in the CALIOP VFM algorithm. Therefore, our classifica-tion of dusty layers is not sensitive to our underestimaclassifica-tion of the desert dust lidar ratio for Saharan dust. We note that, if the lidar ratio were used to derive extinction instead of us-ing our look-up table approach combined with the assimila-tion of MODIS AOT in MERRAero, our desert dust extinc-tion would be underestimated, as was shown for CALIOP (Wandinger et al., 2010; Schuster et al., 2012). Comparing the MERRAero and CALIOPSa and SSA values for other
aerosol types, there are notable differences in the clean conti-nental and polluted dustSa, as well as the polluted dust SSA.
While MERRAero and CALIOPSaand SSA values are
MER-RAero clean continental Sa value is the result of mapping
MERRAero sulfate aerosols to the background clean conti-nental CALIOP aerosol type. Similarly, by mapping any dust mixture to the polluted dust type, our polluted dustSa and
SSA values also include dust mixtures with highly scattering aerosols such as sea salt that result in a lowerSaand higher
SSA when compared to the CALIOP polluted dust model. Overall, however, there is good agreement between MER-RAero and CALIOPSaand SSA values, indicating that our
MERRAero-Extinction methodology leads to an adequate representation of the CALIOP aerosol types.
4.4 A VFM vase study on 7 July 2009
Figure 6 shows the CALIOP and two MERRAero VFMs for the orbital track shown in Fig. 5a on 7 July 2009. Here, the CALIOP VFM identified a layer of polluted dust over Turkey (feature A in Fig. 5a), primarily located between 2 and 5 km in altitude, followed by a low layer of marine aerosol over the Mediterranean Sea (Fig. 6a). Moving south over north-ern Africa, polluted dust is detected by the CALIOP VFM at altitudes below 2–3 km near the coastline, transitioning to desert dust near 23◦N at altitudes to 3–5 km and
ex-tending south to 8◦N over northern Africa (Fig. 5a –
fea-ture B). South of 8◦N, the CALIOP VFM transitions from
desert dust to polluted dust, as this is a region where Saharan dust aerosols frequently interact with smoke aerosols from biomass burning to the south. Continuing south of 5◦N over
central Africa (Fig. 5a – feature C), smoke aerosols are the dominant aerosol type in the CALIOP VFM (Fig. 6a).
By comparing the CALIOP VFM (Fig. 6a) to our MERRAero-CALIOP VFM (Fig. 6b), we can identify bi-ases in simulated aerosol speciation and transport in MER-RAero by identifying instances where the CALIOP and the MERRAero-CALIOP method aerosol typing differ. Over Turkey, the MERRAero-CALIOP method flags a mixture of polluted dust, desert dust, and smoke as the dominant aerosol types and compares well with CALIOP. However, over the Mediterranean Sea, our MERRAero-CALIOP VFM is pre-dominantly polluted dust vs. marine, suggesting that MER-RAero is transporting dust into a region that was observed to be relatively dust free by CALIOP. Our MERRAero-CALIOP VFM (Fig. 6b) does not capture this transition and instead flags desert dust as the predominant aerosol type over northern Africa. Additionally, the observed transition of pol-luted dust to smoke in the CALIOP VFM occurs further to the north in the MERRAero-CALIOP VFM, suggesting that MERRAero is not simulating dust as far south as observed by CALIOP. South of 5◦N, our MERRAero-CALIOP VFM
flags smoke and is comparable to the CALIOP VFM to 10◦S,
but it then transitions to background continental aerosol. By comparing our MERRAero-CALIOP (Fig. 6b) and MERRAero-Extinction (Fig. 6c) VFMs, we can assess the CALIOP VFM algorithm for this case. Over Turkey, our MERRAero-CALIOP and MERRAero-Extinction VFMs
differ: the MERRAero-Extinction VFM shows less dust and a greater presence of polluted continental aerosols than the MERRAero-CALIOP VFM. This highlights the challenge of classifying aerosol mixtures when there are not any pre-eminent properties of the aerosol feature used to determine aerosol type. Here, there was enough dust in MERRAero to classify the aerosol layer as polluted dust in terms of the es-timated particulate depolarization ratio in the MERRAero-CALIOP VFM, but in terms of extinction the typing thresh-old to identify polluted dust was not met, resulting in an iden-tification of polluted continental (smoke+sulfate) aerosols. In this case, the CALIOP VFM algorithm threshold may be too permissive for classifying aerosol features with low es-timated particulate depolarization ratios (i.e., polluted dust), or it is possible that the model thresholds in our MERRAero-Extinction VFM are too conservative. Over the Mediter-ranean Sea (between features A and B), our MERRAero-CALIOP and MERRAero-Extinction VFMs agree in terms of not flagging as much marine aerosol as observed by CALIOP but differ in terms of type: our MERRAero-Extinction VFM indicates a transition of dust to continental aerosol, while our MERRAero-CALIOP VFM is dominated by polluted dust. South of the Mediterranean Sea, our MER-RAero VFMs agree with one another and match the transi-tion of desert dust over northern Africa to polluted dust over the Sahel, followed by smoke over central Africa.
In this case study, we have demonstrated the utility of constructing two different VFMs for identifying biases in simulated MERRAero vertical aerosol distributions by comparing our MERRAero-CALIOP VFM to the CALIOP VFM, as well as establishing limitations of the CALIOP VFM algorithm by comparing our MERRAero-CALIOP and MERRAero-Extinction VFMs. In the next section, we extend our analysis to include all of July 2009 to quantify biases in MERRAero vertical aerosol distributions and optical prop-erties, as well as the CALIOP VFM algorithm on a longer timescale.
5 Monthly application of VFM for July 2009
In this section, we extend our evaluation of the vertical aerosol distributions in our MERRAero aerosol reanalysis by applying both of our MERRAero VFM methodologies for comparison to the CALIOP VFM for July 2009. For our monthly analysis, we perform our sampling of MERRAero as described in Sect. 4.1 and bin all CALIOP and MER-RAero VFMs on the 0.5◦×0.625◦ MERRAero grid. Due
to the narrow swath of the CALIOP instrument, many grid boxes on the model’s grid are devoid of observations at the monthly timescale. Therefore, in order to produce maps rel-atively devoid of observational gaps, we regrid the CALIOP and MERRAero VFMs to a coarser 1◦×1.25◦spatial
observa-Table 3.MERRAero-Extinction and Mie theory computed CALIOP 532 lidar ratio (Sa)and single-scattering albedo (SSA) for each VFM
aerosol type.
CALIPSO and MERRAero MERRAero Computed CALIOP MERRAero Computed CALIOP Aerosol VFM types 532 nmSa[sr] 532 nmSa[sr] 532 nm SSA 532 nm SSA
Marine (M) 32 25 0.98 0.99
Desert dust (DU) 46 40 0.92 0.92
Polluted continental (PC) 61 69 0.89 0.93
Clean continental (C) 63 34 0.92 0.90
Polluted dust (PD) 49 60 0.92 0.85
Smoke (SM) 59 75 0.86 0.83
tions within each grid box during a month becomes more uni-form, with most tropical grid boxes containing four to eight observations at each altitude bin. Within each grid box, we find the mode and determine the fraction of occurrence of VFM type to understand the variability of aerosol type during the month. In an effort to avoid cloud attenuation impacts on layer identification, we only consider cloud-free VFM pro-files that contain aerosols for our monthly analysis. Addi-tionally, for our monthly analysis we combine both CALIOP day and night VFM files, as we did not see a significant im-pact on VFM typing and sampling when they were treated separately (not shown).
Figure 7 shows the July 2009 CALIOP VFM at 1 km ver-tical intervals over northern Africa, the tropical North At-lantic, and the Caribbean. At 0–1 km, the CALIOP VFM is dominated by desert dust over most of northern Africa. Downwind of the source region, we see a mixture of ma-rine and polluted dust extending into the Caribbean between 10 and 20◦N. In the Caribbean, we see a frequent
occur-rence of polluted dust, which extends over into the eastern Pacific. Moving up to 1–2 km, northern Africa is again dom-inated by desert dust and we see a greater fraction of pol-luted dust vs. marine aerosol downwind of the source re-gion associated with dust transport as part of the lofted Saha-ran air layer (SAL). Over the Caribbean and eastern Pacific, we again see a mixture of polluted dust and marine aerosol. At 2–3 and 3–4 km, northern Africa remains dominated by desert dust, and we see an increased fraction of polluted and desert dust with altitude both downwind of the source re-gion and over the Caribbean/eastern Pacific associated with dust-laden SAL transport. We also begin to see more regions where the grid cells are identified as clear in the CALIOP VFM, where no aerosol layers were detected throughout the month. Continuing upward to 4–5 and 5–6 km, aerosol lay-ers are less common, but we continue to see desert dust over northern Africa and a large fraction of desert and polluted dust downwind over the tropical North Atlantic. However, over the Caribbean, while both desert and polluted dust flags are present, there are relatively fewer grid boxes that contain dust aerosols at 5–6 km when compared to the tropical North
Atlantic and northern Africa, related to dust removal during transport from the Saharan source region to the Caribbean.
Figure 7 also shows the July 2009 MERRAero-CALIOP VFM. To reiterate, by comparing the MERRAero-CALIOP VFM to the CALIOP VFM, we can assess biases in our simulated dust transport. Over the Saharan source region, the MERRAero-CALIOP VFM flags desert dust over cen-tral northern Africa and is in agreement with the CALIOP VFM at all altitude ranges. Over the tropical North At-lantic Ocean at 0–1 km, the MERRAero-CALIOP VFM flags a mixture of desert and polluted dust and is comparable to the CALIOP VFM. However, at 1–2 km and above, the MERRAero-CALIOP VFM flags a broader dust plume that extends significantly farther north and south when compared to the CALIOP VFM, suggesting that dust transport is too liberal in MERRAero. Additionally, on the periphery of the transported Saharan dust plume, the MERRAero-CALIOP VFM flags significantly more aerosol layers as polluted dust in the transition from desert dust to marine aerosol, which is not seen in the CALIOP VFM. We recall that in MER-RAero the fraction of each individual aerosol species does not change when MODIS AOT is assimilated. Therefore, if the fraction of dust relative to other aerosol species is in-correct, this bias will be preserved after MODIS AOT is as-similated. Over the Caribbean and eastern Pacific Ocean, the CALIOP and MERRAero-CALIOP VFMs are comparable at 0–1 km, flagging a mixture of desert dust, polluted dust, and marine aerosol. Above 1 km, our MERRAero-CALIOP VFM flags a greater presence of desert dust and polluted dust when compared to the CALIOP VFM. This difference persists into the eastern Pacific, suggesting that, in addition to simulating a much broader Saharan dust plume, MERRAero transports dust too far west when compared to CALIOP.
Figure 7. (a–f)CALIOP (left), MERRAero-CALIOP (center), and MERRAero-Extinction (right) VFMs at 1 km intervals for July 2009.
Aerosol types include smoke (SM), polluted dust (PD), desert dust (DU), clean continental (C), and marine (M). The surface (SF) and regions with no data (ND) are also shown.
of desert dust surrounded by polluted dust (dust+sea salt) that compares more favorably to the CALIOP VFM than our MERRAero-CALIOP VFM. Comparing our MERRAero VFMs, we see that the MERRAero-CALIOP VFM dust plume is broader than the MERRAero-Extinction VFM over the tropical North Atlantic, suggesting that using the esti-mated particulate depolarization ratio alone in the CALIOP VFM algorithm potentially flags aerosol layers as dusty when the actual dust aerosol loading is small. Above 3 km, the MERRAero-CALIOP VFM continues to flag a broad re-gion of desert dust and polluted dust aerosol, while the MERRAero-Extinction VFM aerosol flags are very compa-rable to CALIOP. Over the Caribbean and eastern Pacific, our MERRAero-Extinction VFM slightly differs from the MERRAero-CALIOP and CALIOP VFMs and flags more marine aerosol pixels at the expense of desert and polluted dust. At 1–2 km, our MERRAero-CALIOP VFM is domi-nated by desert and polluted dust, while our MERRAero-Extinction VFM flags a mixture of desert dust, polluted dust, and marine aerosol. At 3 km and beyond, our
MERRAero-Extinction VFM flags fewer dusty aerosol layers with alti-tude, while our MERRAero-CALIOP VFM continues to flag desert dust and polluted dust over the Caribbean and east-ern Pacific. This feature again suggests that using the esti-mated particulate depolarization ratio alone is too permissive for flagging dust layers in the CALIOP VFM algorithm, par-ticularly in regions where the dust aerosol loading is low and multiple aerosol types are present.
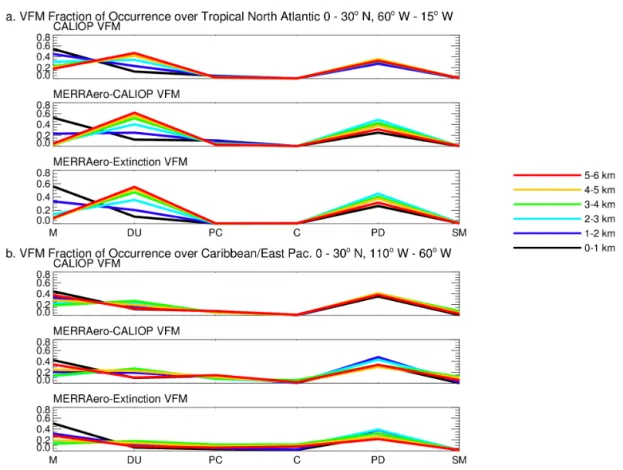
We note that Fig. 7 shows the mode aerosol types for July 2009, as VFM flags are not quantitative and cannot be aver-aged. Therefore, in Fig. 8, we show the fraction of occur-rence for each VFM flag over the tropical North Atlantic (0–30◦N, 60–15◦W, Fig. 8a) and the Caribbean/eastern
Pa-cific (0–30◦N, 110–60◦W, Fig. 8b). Over the tropical North
com-Figure 8.VFM fraction of occurrence over the tropical North Atlantic(a)and Caribbean/eastern Pacific(b). Aerosol types include marine
(M), desert dust (DU), polluted continental (PC), clean continental (C), polluted dust (PD), and smoke (SM).
parable to the CALIOP VFM over the tropical North At-lantic; however, when we compare our MERRAero-CALIOP and MERRAero-Extinction VFMs, we clearly see that the CALIOP VFM algorithm flags a greater occurrence of desert and polluted dust in regions that are not identified as dusty in our MERRAero-Extinction VFM. These features persist over the Caribbean/eastern Pacific; we again see a greater occur-rence of desert dust and polluted dust at the expense of ma-rine aerosol in our MERRAero-CALIOP VFM when com-pared to the CALIOP and MERRAero-Extinction VFMs.
6 Conclusions
In this study, we have explored the utility of the CALIOP VFM for evaluating Saharan dust transport for July 2009 in the NASA GEOS-5 aerosol reanalysis (MERRAero). The CALIOP VFM is particularly used for evaluating global aerosol transport models, as the VFM provides information regarding vertical location and aerosol type, which is chal-lenging to assess using traditional column measurements of AOT such as MODIS.
For our analysis, we first evaluated Saharan dust in our 0.5◦×0.625◦ MERRAero simulation for July 2009.
Com-pared to column AOT observations from MISR, MODIS Aqua, and AERONET, we showed that MERRAero
simu-lated the magnitude and timing of observed Saharan dust events during July 2009. Vertically, when compared to the CALIOP Level 3 gridded dust extinction product, MER-RAero captured the observed magnitude and vertical ex-tent of Saharan dust transport, although below 1 km altitude CALIOP reported extinction values that were much greater than those simulated in MERRAero. This finding is consis-tent with Amiridis et al. (2013), who demonstrated that the CALIOP feature-finding algorithm tends to exclude the ma-rine layer embedded within dust layers, leading to a high bias in the retrieved extinction. This result highlights the impor-tance of correctly identifying aerosol type when converting the backscatter profile to extinction via the lidar ratio. In our comparison to the CALIOP gridded Level 3 product, we dis-cussed how the classification of marine layers as desert dust can result in higher extinction values for a given backscatter, as the lidar ratio for dust is greater than for marine aerosol.
inputs. This direct application of the CALIOP VFM is a sim-ulation of how MERRAero quantities map to the CALIOP aerosol types following the CALIOP VFM algorithm logic and can be directly compared to the CALIOP VFM to as-sess transport biases for individual aerosol species in MER-RAero. Our second MERRAero VFM is based on the fun-damental outputs of the model, i.e., the speciated extinction, which leads to the so-called MERRAero-Extinction method. This approach required decisions regarding the prevalence of each individual type for it to be considered significant (e.g., in our case we assumed an aerosol type was signifi-cant if it contributed 25 % or more to the total extinction). Our MERRAero-Extinction VFM can be compared to our MERRAero-CALIOP VFM to evaluate the performance of the CALIOP VFM, which we demonstrated to have sig-nificant implications for the CALIOP extinction product in Fig. 4.
Our comparison of the CALIOP and our MERRAero VFMs for July 2009 yielded several regional differences that have implications for dust transport in MERRAero and un-derstanding limitations of the CALIOP VFM algorithm it-self. Over northern Africa our MERRAero-CALIOP VFM compared very favorably to the CALIOP VFM by identi-fying desert dust as the dominant aerosol type, indicating that Saharan dust distributions in MERRAero over northern Africa are representative of what is observed by CALIOP. Similarly, our MERRAero VFMs both compared favorably over northern Africa, and it is a region where the CALIOP VFM algorithm performed well. Over the tropical North Atlantic, Caribbean, and eastern Pacific, our MERRAero-CALIOP VFM compared well with the MERRAero-CALIOP VFM at low altitudes. However, above 1 km, the MERRAero-CALIOP VFM flags a significantly broader Saharan dust plume that extended further to the north, south, and west when com-pared to the CALIOP Saharan dust plume. Comparing our MERRAero VFMs downwind of the Saharan source region, particularly over the Caribbean, we found a greater occur-rence of desert dust and polluted dust in our MERRAero-CALIOP VFM in regions that were flagged as dust-free in our MERRAero-Extinction VFM. This finding is consistent with Amiridis et al. (2013), who found that the use of the es-timated particulate depolarization ratio and not the measured particulate depolarization ratio in the CALIOP VFM leads to an over-classification of dust/polluted dust layers.
Our construction of two MERRAero VFMs leads us to two major conclusions. The first conclusion that we found is MERRAero dust transport is too aggressive. This finding re-sulted from a comparison between the MERRAero-CALIOP VFM and the CALIOP VFM, as there was an increased prevalence of desert and polluted dust downwind of the Sa-haran source region in the MERRAero-CALIOP VFM. This result demonstrated the utility of using the CALIOP VFM for assessing biases in aerosol speciation in global models, as our AOTs were comparable to observations in this region, but our aerosol speciation in error.
Our second conclusion is that the CALIOP VFM algo-rithm is challenged when assigning an aerosol type when multiple aerosol types are present. This was demonstrated by comparing our CALIOP and MERRAero-Extinction VFMs from the MERRAero results (Fig. 7). Both of these synthetic VFMs see the same “truth” in the aerosol loading – that is, both are derived from the same aerosol distributions – and in certain areas show very dif-ferent type identifications. A clear example of this can be seen over the Gulf of Guinea, west of southern Africa, where the MERRAero-Extinction method VFM identifies elevated smoke layers between the surface and about 4 km, while the MERRAero-CALIOP VFM identifies marine aerosol. Lidar ratio assigned via these criteria would thus differ by more than a factor of 2 and so would lead to considerable er-ror in the assigned extinction if the type is misidentified as suggested here (Campbell et al., 2012; Ford and Heald, 2012; Kanitz et al., 2014). In our evaluation of the Saha-ran dust plume, direct comparison between our MERRAero VFMs showed that the CALIOP VFM algorithm is biased toward classifying marine-dominated aerosol layers with low aerosol loadings that are mixed with small contributions from dust as polluted dust. This result suggests that using the esti-mated depolarization ratio alone can lead to biases in aerosol typing – particularly when multiple aerosol types are present and when the aerosol loading is low.
Our second conclusion is dependent on how we construct our MERRAero-Extinction VFM, which is designed to be representative of the actual aerosol types simulated in MER-RAero. For the MERRAero-Extinction VFM, we first must make decisions regarding the mapping of GEOS-5 aerosols and aerosol mixtures to those of CALIOP. For our analysis, we only consider external mixing of aerosols. Internal mix-ing could impact the optical properties and lifetime of the aerosol via hygroscopic growth (Adachi and Buseck, 2008) in MERRAero. Additional uncertainty is potentially intro-duced through our threshold choices for the simulated extinc-tion thresholds used to construct the MERRAero-Extincextinc-tion VFM. We explored this sensitivity by varying the minimal aerosol species contribution to the total extinction between 10 and 40 % and found an increase in the occurrence of desert dust vs. polluted dust over the tropical North Atlantic as the threshold was increased (not shown). Only when the min-imum contribution from an individual aerosol species was lowered to 10 % did we see a substantial increase in the ex-tent of the Saharan dust plume. This supports our second conclusion and again highlights the challenge of classifying aerosol types when multiple aerosol types are present, as we found best agreement between our MERRAero VFMs when the minimum individual contribution to the total extinction was set at 10 % in our MERRAero-Extinction method.