www.atmos-meas-tech.net/9/1261/2016/ doi:10.5194/amt-9-1261-2016
© Author(s) 2016. CC Attribution 3.0 License.
The Aerosol Limb Imager: acousto-optic imaging of limb-scattered
sunlight for stratospheric aerosol profiling
B. J. Elash, A. E. Bourassa, P. R. Loewen, N. D. Lloyd, and D. A. Degenstein
Institute of Space and Atmospheric Studies, University of Saskatchewan, Saskatoon, Saskatchewan, Canada Correspondence to:B. J. Elash ([email protected])
Received: 26 October 2015 – Published in Atmos. Meas. Tech. Discuss.: 17 December 2015 Revised: 10 March 2016 – Accepted: 14 March 2016 – Published: 24 March 2016
Abstract.The Aerosol Limb Imager (ALI) is an optical re-mote sensing instrument designed to image scattered sunlight from the atmospheric limb. These measurements are used to retrieve spatially resolved information of the stratospheric aerosol distribution, including spectral extinction coefficient and particle size. Here we present the design, development and test results of an ALI prototype instrument. The long-term goal of this work is the eventual realization of ALI on a satellite platform in low earth orbit, where it can pro-vide high spatial resolution observations, both in the vertical and cross-track. The instrument design uses a large-aperture acousto-optic tunable filter (AOTF) to image the sunlit strato-spheric limb in a selectable narrow wavelength band ranging from the visible to the near infrared. The ALI prototype was tested on a stratospheric balloon flight from the Canadian Space Agency (CSA) launch facility in Timmins, Canada, in September 2014. Preliminary analysis of the hyperspec-tral images indicates that the radiance measurements are of high quality, and we have used these to retrieve vertical pro-files of stratospheric aerosol extinction coefficient from 650 to 1000 nm, along with one moment of the particle size dis-tribution. Those preliminary results are promising and devel-opment of a satellite prototype of ALI within the Canadian Space Agency is ongoing.
1 Introduction
Stratospheric aerosol plays an important role in the global radiative forcing balance by scattering solar irradiation and causing an overall cooling effect that depends on the particle size distribution and the concentration (Kiehl and Briegleb, 1993; Stocker et al., 2013). These climate effects are an
im-portant and recent focus of research due to the potential contribution of stratospheric aerosol to the so-called global warming hiatus (Solomon et al., 2011; Haywood et al., 2014; Fyfe et al., 2013), and efforts to quantify the variability and trends in the global stratospheric aerosol load are under-way with various ground-based and satellite data sets (Rieger et al., 2015; Ridley et al., 2014).
was in fact due to a series of relatively minor, mostly tropical, volcanic eruptions.
Satellite instrumentation capable of remote sensing strato-spheric aerosol has been in use since the 1970s, beginning with limb-sounding solar occultation measurements. These have provided a reliable, accurate, and essentially continu-ous long-term record of vertically resolved aerosol extinc-tion coefficient measurements, mostly from the series of Stratospheric Aerosol and Gas Experiment (SAGE) instru-ments (Russell and McCormick, 1989; Thomason and Taha, 2003). These SAGE measurements, which have a vertical resolution of approximately 1 km, have generally compared well with ground-based and in situ measurements, although there are challenges associated with determining microphys-ical parameters and comparison between instruments can be challenging (Russell and McCormick, 1989; Kovilakam and Deshler, 2015). However, solar occultation is generally a ro-bust and stable technique as it directly measures atmospheric optical depth, along with the exoatmospheric solar spec-trum with each scan, allowing for straightforward retrieval of aerosol extinction coefficient (Damadeo et al., 2013). The SAGE III mission came to an end in 2006 and the occulta-tion measurements have continued from the currently oper-ational MAESTRO and ACE-Imager instruments on SciSat (McElroy et al., 2007; Gilbert et al., 2007) and have had some success producing stratospheric aerosol extinction products (Vanhellemont et al., 2008; Sioris et al., 2010). Furthermore, a manifestation of SAGE III is planned for deployment on the International Space Station in 2016 (Cisewski et al., 2014).
More recently, limb-scattered sunlight measurements have been used for stratospheric aerosol retrievals. Although this technique has the advantage of being able to sample the at-mosphere throughout the sunlit hemisphere, it requires the use of a complex forward model of multiple scattering pro-cesses along with at least some a priori knowledge of the aerosol scattering cross section in order to retrieve the ex-tinction coefficient profile. The Optical Spectrograph and InfraRed Imaging System (OSIRIS) instrument (Llewellyn et al., 2004), which was launched in 2001 and is presently still operational, was the first satellite limb scatter instrument to retrieve stratospheric aerosol extinction (Bourassa et al., 2007). The current OSIRIS version 5.07 data product, which provides 750 nm extinction profiles at approximately 2 km vertical resolution, has been shown to agree relatively well, generally below 30 % below 30 km, with SAGE II and SAGE III occultation measurements (Bourassa et al., 2012b; Rieger et al., 2015). The SCanning Imaging Absorption spectroM-eter for Atmospheric CHartographY (SCIAMACHY) instru-ment on Envisat (Bovensmann et al., 1999) uses a retrieval technique essentially similar to OSIRIS to retrieve aerosol profiles at 750 nm with approximately 3 km vertical resolu-tion (Taha et al., 2011; Ernst et al., 2012; von Savigny et al., 2015) from scattered sunlight spectra. SCIAMACHY obser-vations ceased with the demise of Envisat in 2012 and
al-though OSIRIS continues to operate, it is now in the 14th year of a mission designed for 2 years.
The most recently launched limb scatter instrument is the Ozone Mapping Profiler Suite Limb Profiler (OMPS-LP) on the Suomi-NPP satellite. Although similar in spectral range and vertical resolution to OSIRIS, OMPS-LP is an imaging spectrometer that vertically images the limb in a single mea-surement. Both OSIRIS and SCIAMACHY are grating spec-trometers with a narrow field of view, such that limb pro-files are obtained by vertically scanning through a range of tangent altitudes. The imaging capability of OMPS provides a decrease in the time required to obtain a limb profile and so increases the along track sampling. Recent work on the feasibility of aerosol retrieval from OMPS-LP measurements show promising results (Rault and Loughman, 2013).
Several recent studies have highlighted the requirement for continued global stratospheric aerosol observations and es-pecially the need to resolve, both vertically and horizontally, aerosol in the lowermost stratosphere and the upper tropo-sphere. This is the case for tracking the evolution of aerosol from volcanic eruptions, which can have a substantial effect on the aerosol optical depth in the lowermost stratosphere (Ridley et al., 2014; Andersson et al., 2015). Furthering the understanding of the transport of aerosol near and across the tropopause would also benefit from higher spatial and tem-poral resolution observations. This is evident in the case of volcanic plumes, such as that from Nabro in 2011, the trans-port and origin of which has been studied extensively and the conclusions are somewhat controversial (Bourassa et al., 2012c, 2013; Vernier et al., 2013; Fromm et al., 2013, 2014; Fairlie et al., 2014; Clarisse et al., 2014). However, this is also the case for the formation of background-level aerosol, particularly in the region of the Asian and North American monsoons, which have been identified as a source of substan-tial, seasonal, and highly structured aerosol formation from precursor tropospheric source gases (Vernier et al., 2011a; Neely et al., 2014; Thomason and Vernier, 2013).
International Space Station in 2015 for an expected mission lifetime of 3 years.
Continued stratospheric aerosol observations from space are drastically needed though few, if any, planned missions with such capability are underway. In this paper we present the design and test of a prototype instrument for potential future satellite-based stratospheric aerosol observation. The Aerosol Limb Imager (ALI) concept is a relatively small, low-cost, low-power passive instrument, suitable for mi-crosatellite deployment, with the capability to provide high spatial resolution measurements, both vertically and hori-zontally, of the visible/near-infrared aerosol extinction co-efficient. The basic idea is to leverage the clear advantages of the limb scatter technique as a passive, and therefore low mass and power, means to obtain daily global cover-age, with a two-dimensional hyperspectral imager for filling cross-track observation.
The ALI instrument concept is built around the use of an acousto-optic tunable filter (AOTF), which is a novel filter-ing technology that provides the ability to rapidly select the central wavelength of an image with no moving parts. These filters, which have recently been developed as large-aperture, imaging quality devices, operate very efficiently in the red and near-infrared spectral range, which is a well-matched spectral range for limb scatter sensitivity to aerosol and cloud (Rieger et al., 2014). Additionally, the spectral bandpass of the AOTF has reasonable resolutions at these wavelengths such as 3–6 nm, which is very suitable for the broadband scattering characteristics of the aerosol limb signal. The two-dimensional imaging nature of the design provides the capa-bility to achieve at least sub-kilometre resolution at the tan-gent point, which is on the order of the scale size of the up-per troposphere and lower stratosphere aerosol features men-tioned above.
It should be noted that the basic instrument design con-cept of ALI is very similar to that of the Atmospheric Limb Tracker for the Investigation of the Upcoming Strato-sphere (ALTIUS) (Dekemper et al., 2012), which is a Bel-gian instrument concept from the BelBel-gian Institute for Space Aeronomy (BIRA). ALTIUS is designed to measure limb-scattered sunlight; however, it also has solar, stellar, and plan-etary occultation modes and is scientifically focused on trace gas measurements, particularly for ozone, whereas ALI is op-timized for aerosol observation.
2 ALI instrument design
ALI is a simple optical system that images essentially a sin-gle wavelength at a time through the use of an AOTF. The AOTF is a unique device that allows for the filtering with-out any moving parts and relatively low power consumption. However, the AOTF operation requires important instrument design considerations to account for its optical operation. For example, the diffractive qualities of the AOTF depend on the angle that light enters the device. Additionally, in practice the
AOTF output is limited to a single linear polarization, which reduces the system throughput and causes potential internal stray light in the system through the rejection of the other linear polarization. The following sections provide a brief in-troduction to the physical operation of the AOTF, consider-ations for implementation in a system designed specifically for aerosol, and an overview of the final ALI optical design. 2.1 Acousto-optical tunable filter
The primary filtering device behind ALI and the technology that allows for the two-dimensional spatial imaging is the AOTF, which is typically made from a birefringent crystal. A radio frequency (RF) wave is propagated through the crys-tal and forms an acoustic shear wave that interacts with an incoming beam of light in an effect similar to the diffraction of a specific wavelength. The use of an AOTF for an imaging system has several distinct advantages due to its low mass, fast stabilization times of a few microseconds, and no moving parts. Although many applications use small, non-imaging AOTFs with various configurations, large-aperture, birefrin-gent, non-collinear acousto-optic devices are typically used in imaging systems. A non-collinear device is one where the input light beam and the RF acoustic wave are not aligned. Thanks to recent advancements in non-collinear AOTF tech-nology these devices now have relatively high efficiency and robust imaging quality (Georgiev et al., 2002; Voloshinov et al., 2007).
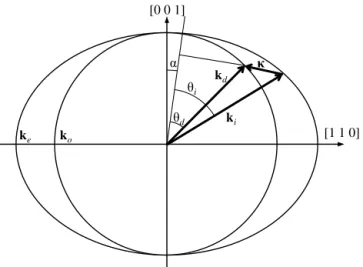
To create the diffraction of a specific wavelength, a mo-mentum matching criterion must be held where the wave vec-tors of the acoustic wave match the difference of the incom-ing and diffracted light wave vectors as seen in Fig. 1. This condition is known as the Bragg matching criterion and is given by
ki=κ+kd, (1)
where |ki| = 2π ni/λ is the wave number of the incident light,|kd| = 2π nd/λis the wave number of the diffracted light, and|κ| = 2π F /νis the wave number of the acoustic wave. The parametersλ,F, andνare the wavelength of light in vacuum, the frequency of the RF wave, and the phase ve-locity in the crystal respectively and the indices of refraction for the incident and diffracted light areniandndrespectively. Using the condition given in Eq. (1) and the wave vector di-agram gives the following relation for a birefringent material undergoing Bragg diffraction:
λ=1nν
F
sin2(θi+α) sinθi
, (2)
κ
kd
θd θi
ki [0 0 1]
ko
ke
α
[1 1 0]
Figure 1. The wave vectors generated by the AOTF experiment. From Eq. (1), the incident wave vector,ki, diffracted wave vector, kd, and acoustic wave vectorκare shown. The respective interac-tion angles for the incident and diffracted wave vectorsθiandθdare also presented.
AOTF is inversely related to the frequency of the RF wave. This equation also displays an important implication of the operation of the device that affects the design possibilities in an imaging system. That is, the wavelength of diffracted signal is dependent on the angle of incidence of the incoming wave. Therefore, passing the light beam through the AOTF at different incident angles will result in slightly different out-going diffracted wavelengths. Also, through the described in-teraction, the diffracted light goes through a 90◦rotation in polarization (Voloshinov, 1996).
For ALI prototyping purposes, a 10 mm×10 mm aperture imaging quality AOTF was acquired from Brimrose of Amer-ica (model number TEAFI10-0.6-1.0-MSD) with a Gooch and Housego driver (model number 64020-200-2ADMDFS-A). The AOTF is optically tuned for the wavelength octave of 600 to 1200 nm, corresponding to an RF range of 156 to 70 MHz. It is made from tellurium dioxide (TeO2), a birefrin-gent crystal with indices of refraction at 800 nm of 2.226 and 2.373 for the ordinary and extraordinary modes respectively (Uchida, 1971). The acousto-optic diffraction angle varies as the filtered wavelength is changed, so in order to achieve an essentially constant diffraction angle the rear surface of the crystal is cut at a specific angle, such that the refraction at this final surface compensates for the angular change with wave-length. For our specific sample, the diffracted extraordinary light beam is compensated in this way and is diffracted 2.7◦ from the input optical axis of the device with a minimum separation angle of 6.4◦between the zeroth and first order. The ordinary light beam also undergoes diffraction, but at a non-constant angle from the optical axis with respect to wavelength and is not imaged by the system. A schematic of the basic light paths through the AOTF is shown in Fig. 2a.
Acoust ic w ave
First order (o) Zeroth order (o)
Zeroth order (e) First order (e) Incident
wave
Acoust ic w ave
First order (o) Zeroth order (o)
Zeroth order (e) First order (e) Incident
wave
No acoustic Wave
Zeroth order (o)
Zeroth order (e) Incident
wave
(a)
(b)
(c)
Figure 2. (a)A representative AOTF undergoing Bragg diffraction with an unpolarized incident wave with a RF wave applied repre-sented by the arrow. After the diffraction event four output signals are formed: the zeroth-order and first-order ordinary (o) and extraor-dinary (e) signals. However, the only optical path that remains at a constant angle no matter the applied RF wavelength is the first-order extraordinary diffracted signal.(b)Two linear polarizers are added to the system: the first linear polarizer removes the ordinary polarization removing the outputs with the dotted lines and the sec-ond linear polarizer removes undiffracted extraordinary light shown by the dashed line.(c)The system in (b)without a RF wave so Bragg diffraction is not occurring. Once again the first linear po-larizer removes the ordinary polarization represented by the dotted line and the second linear polarizer removes the extraordinary light shown by the dashed line.
2.2 Instrument design
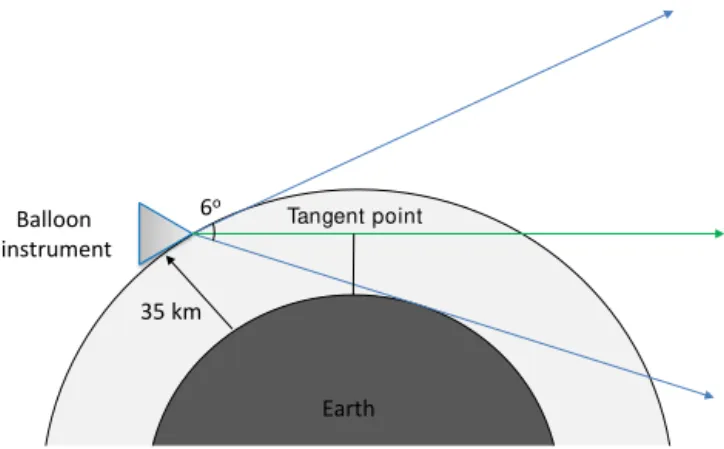
The ALI prototype that we have developed has been designed specifically for testing from a stratospheric balloon at a float altitude of approximately 35 km. In this geometry, a field of view that captures a vertical image of the limb from the hor-izontal at float down to the tangent line to the surface corre-sponds to 6◦(Fig. 3). This is substantially larger than similar imaging requirements from low earth orbit, where the same tangent altitude range would be covered by about a 1◦field of view. The target vertical resolution of the measured radiance profiles is 200 m in tangent altitude. A wavelength range of 600–1000 nm was decided upon for the prototype, mostly to align well with the spectral response of a standard and read-ily available CCD detector. We paid careful attention to stray light reduction including both internal scatter and out-of-field signal.
Earth Balloon
instrument
6o
35 km
Tangent point
Figure 3. ALI in a stratospheric balloon geometry showing the complete 6◦field of view in blue with a float altitude of 35 km. The green line shows a typical vertical line of sight where the tangent point or altitude is set by the minimum distance between the earth and the line of sight.
system. The telecentric system uses a layout that removes perspective from the image and object plane by creating a condition that requires the chief ray to be parallel to the op-tical axis in both object and image space. The telescopic sys-tem uses a simple two lens afocal syssys-tem to resize and col-limate the incoming rays of light into the AOTF. This limi-tation is mainly that the incoming light beams at the AOTF device must enter at less than the acceptance angle, which is defined by a threshold beyond which the diffraction effi-ciency falls off sharply. These AOTF layouts have been stud-ied previously (Suhre et al., 2004); however, they are briefly explained here in the context of our intended purpose of limb imaging aerosol. The upshot is that the telescopic, or afo-cal, system causes a wavelength gradient to be formed across the image plane, whereas the telecentric design overcomes this problem but has a larger spectral point spread function and a slight change in focus with wavelength. The optical design software Code V was used to assist in designing and analysing the performance of both of the optical layouts.
A telecentric layout leads to focused light bundles pass-ing through the AOTF. The filtered image then has a con-stant wavelength across the entire image with a larger spec-tral point spread function, since the diffracted wavelength is dependent on incident angle, as seen in Eq. (2). This lay-out has two inherent issues. First, it is sensitive to any sur-face defects of the crystal since the light path is focused very near the AOTF surfaces. Second, a shift in the location of the imaging focal plane occurs that is dependent on wave-length such that perfect focus can only be obtained for a sin-gle wavelength. Defocusing will occur at the image plane for all other wavelengths and in order to correct for this problem additional compensating optics would need to be added or the detector would need to be actively moved as the wave-lengths are scanned.
In the telescopic layout, collimated light for each line of sight passes through the AOTF. This results in a few funda-mental differences that both improve and degrade the imag-ing quality. First, the light passimag-ing through the AOTF from a single line of sight enters the AOTF at the same angle, so the image will have a narrower spectral point spread function than the telecentric counterpart. However, each line of sight will be diffracted with a different fundamental central wave-length due to the angular dependence in the AOTF diffraction (Eq. 2). The scanned spectrum then has better spectral res-olution than obtained with the telecentric system, but there will be a wavelength gradient radiating out from the centre of the image. Second, since light in this design passes through the AOTF collimated, the focal point of the image no longer changes with wavelength. Instead, a lateral displacement of each line of sight occurs based on the angle of incidence and the diffracted wavelength, which causes a slight change in magnification of the final image. The lateral displacement that occurs is given by the following relation:
δ=(n (λ)−1) t θ
n(λ), (3)
whereδis the displacement from the original path andtis the thickness of the crystal. However, this wavelength dependent change is less than a micrometre for the current ALI design and is considered negligible.
In light of the requirements for imaging aerosol, we have chosen a telescopic design for the ALI prototype. Since the wavelength gradient across the image is small compared to the slowly varying aerosol scattering cross section, the fixed image plane is preferable for the improvement it provides in spatial imaging, particularly as we desired to use as simple as possible an optical design.
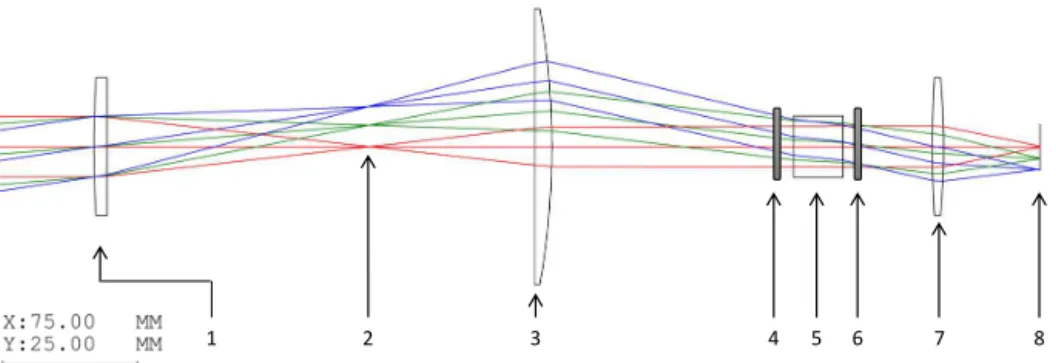
1 2 3 4 5 6 7 8
Figure 4.Ray tracing diagram of the telescopic lens system for ALI simulated by Code V optical design software. The elements in the system are the following: (1) 150 mm focal length plano-convex lens, (2) field stop, (3) 100 mm focal length plano-convex lens, (4) vertical linear polarizer, (5) Brimrose AOTF, (6) horizontal linear polarizer, (7) 50.4 mm focal length biconvex lens, and (8) imaging plane.
The extraordinary diffracted light is 2.7◦ from the opti-cal axis and to compensate, the entire optiopti-cal chain after the AOTF is mechanically aligned with this direction. The BEO forms the image of the signal on a QSI 616s 16 bit CCD with 1536 by 1024 pixels. A ray tracing diagram for ALI’s optical system was created using the CODE V opti-cal design software and can be seen in Fig. 4. No corrections were attempted to reduce chromatic or spherical aberrations within the system, and the system exhibits some coma due to the large field of view and the curvature of the lenses near the edge of the field of view. Analysis with Code V shows that the distortion due to these effects across the cen-tre two degrees of the field of view is a change of less than 1 % across the entire wavelength range. The final one de-gree shows a distortion of less than 4 %. An analysis was also performed to determine the minimum resolution required to achieve a modular transfer function (MTF) of 0.3 across the entire field of view for all wavelengths (Smith, 2000). To ob-tain the MTF across the entire field of view a 7-pixel run-ning average is required. This translates to an average verti-cal and horizontal resolution of 210 m across the entire ALI field of view at the tangent point. A tolerance study was also performed with Code V to assess the capability of the sys-tem within the tolerances of the mounting equipment, and it was found that the system was insensitive to tilts and offsets within the system.
The SASKTRAN-HR (Bourassa et al., 2008; Zawada et al., 2015) radiative transfer model was used to assist in determining exposure times and entrance pupil of ALI. This was performed by using ground-based sky measurements during a cloudless day at an azimuth of 90◦ from the sun at a variety of exposure times (0.01 to 60 s) and wavelengths (600 to 1000 nm). The sky measurements were used to es-timate typical exposure times. The SASKTRAN-HR model was used to compute the ratio of the modelled radiances from a balloon flight geometry to the ground-based geometry to scale the ground-based exposure times to those for balloon flight. The ALI entrance pupil was selected at 9.91 mm to yield flight exposure times on the order of 1 s. A summary
Table 1.ALI final system optical parameters.
Parameter Value
Effective focal length (mm) 74.3 Front end magnification 0.67 Back end magnification 1.27 Entrance pupil (mm) 9.91 Field of view (◦) 6.0×5.0
F number 7.5
Image size (mm) 9×7.5 Image size (pixels) 1000×800 Resolved image size 143×114 (averaged pixels)
Spectral range (nm) 650–950
of the optical specification for the ALI prototype is given in Table 1.
A long-standing concern in the design of limb scatter in-struments is the effective rejection of out-of-field stray light. This is due to the bright surface very near to the targeted limb in combination with the exponentially dropping limb signal with tangent altitude. For ALI test observations from the stratospheric balloon, a front end baffle was incorporated. This was designed to minimize the percentage of out-of-field light that can reach the aperture without encountering at least three baffle surfaces. To further reduce the unwanted sig-nal, each baffle maintains a height-to-pitch ratio greater than 0.5 (Fischer et al., 2008). The baffle is 300 mm long with a cross section of 70 mm×70 mm and contains seven veins spaced throughout the length. The effectiveness of the baffle was measured against that of a simple aperture through lab-oratory testing yielding an approximately 8-fold decrease in measured out-of-field stray light.
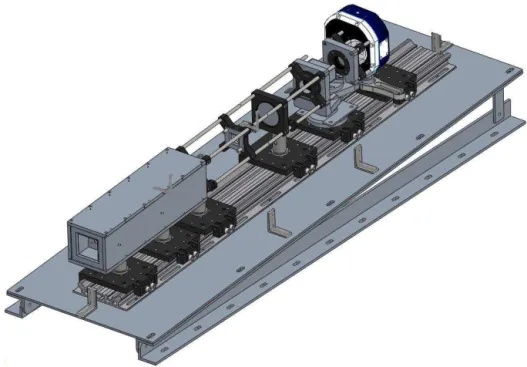
Figure 5.An isometric view of the complete ALI system with the baffle and 3◦slant required to correctly position the field of view. Light tight case absent from diagram.
off-the-shelf optics the operating temperature of ALI during the mission was not actively controlled, although the instru-ment temperature is monitored in several locations along the optical chain and at the detector for later analysis. A sim-ple covering of insulating foam with a reflective coating was used to reduce temperature extremes due to the cold ambient environment and direct solar heating.
Software and controlling hardware for the instrument was developed for autonomous or commanded control during the balloon flight. A Debian Linux operating system with C++ -based software controls the hardware and science data collec-tion operacollec-tion. The onboard computer is a VersaLogic PC-104 OCELOT computer with fanless operation and a ther-mal operating range of −40 to 85◦C. The onboard sys-tem provides two-way communication to a ground-based sta-tion through UDP protocol and sends data, including images and housekeeping information, to the ground, and it receives commands from ground control.
It should be noted that our choice of a telescopic optical layout for ALI is actually the opposite choice of that made for the ALTIUS design, which uses a telecentric optical lay-out. For that instrument, the need for spectral resolution for trace gas retrieval makes the decision to use telecentric optics quite clear (Dekemper et al., 2012). Given that basic design difference, the overall optical specifications are quite similar between the ALI and ALITUS prototype instruments (again see Table 1 for ALI specifications), although two key differ-ences are noted. First, by using a telescopic layout the maxi-mum field of view for ALI is determined by choosing lenses to ensure light enters ALI within the acceptance angle of the
AOTF. This allows for a larger possible field of view than with a telecentric system where the field view is defined by the aperture of the AOTF. Second, the F number for ALTIUS is 14.32 compared to 7.5 for ALI, which allows ALI to in-crease light throughput at the cost of slightly higher aberra-tions in the final image. Dekemper et al. (2012) report that the visible channel of ALTIUS was breadboarded and tested by taking ground-based measurements of a smoke stack plume. They used the measurements to retrieve NO2 slant column density using 10 s exposure times; however, they note that an increase in measurement frequency would improve the in-strument capabilities. This also factored into our decision to use telescopic optics to increase throughout for ALI.
3 Calibration
A series of pre-flight laboratory calibrations were performed in two stages. First, the AOTF was characterized to calibrate it with respect to wavelength registration and spectral point spread function. Second, the instrument was characterized as a complete system to provide calibrated radiance. The fol-lowing calibration measurements were performed on ALI:
– AOTF wavelength calibration
– AOTF point spread function and diffraction efficiency – stray light calibration
3.1 AOTF wavelength calibration
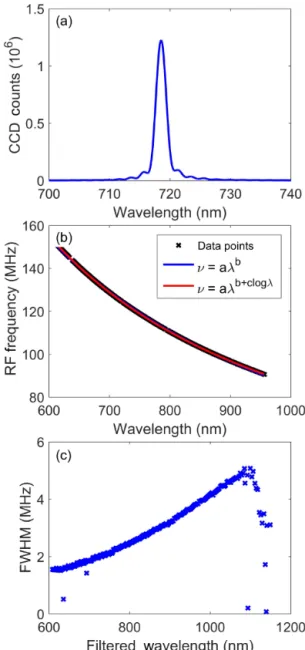
The relationship between the applied acoustic wave fre-quency and the diffracted wavelength, which is known as the tuning curve, defines the wavelength registration to the RF wave of the collected images. This was determined in the laboratory setting by filling the AOTF aperture with colli-mated light and observing the diffracted, or filtered, signal with a HORIBA iHR320 spectrometer and Synapse 354 308 1024×256 pixel CCD. The grating used with the spectrome-ter had a spectral resolution of 1.2 nm, which is less than the factory-specified resolution of the AOTF. Images were taken at a constant exposure time at a set of acoustic wave radio frequencies spaced every 150 kHz from 75 to 160 MHz. This corresponds to approximately one image every 1 nm. A typ-ical spectrum recorded with the iHR320 is shown in Fig. 6a. The fringes that are visible in the spectrum in Fig. 6a are a known acousto-optic effect (Xu and Stroud, 1992) and for ALI amount, to 8 to 14 % of the total signal depending on wavelength and incident angle. The maximum value of each image is then taken to be the central wavelength at each re-spective acoustic wave frequency.
These central wavelengths for the full set of spectra were empirically found to follow a power function of the form
F =aλb+clogλ. (4)
The fit of the data to this function form agrees to less than 0.1 % throughout the whole wavelength range such that the final tuning curve was as determined as
F =exp(19.793) λ−3.381+0.168 logλ, (5) whereλis in nanometres andF is in MHz with a 0.1 % er-ror in the central wavelength (see Fig. 6b). Even with con-sidering the temperature change, the AOTF would experi-ence a maximum wavelength drift of 2.5 nm during the mis-sion, which is acceptable for the slowly varying broadband scattering cross section of aerosol. Furthermore, it should be noted that even though the AOTF optical range is 600 to 1200 nm, our analysis only measured wavelengths from 600 to 1080 nm due to the low quantum efficiency of the CCD beyond this range.
3.2 AOTF point spread function and diffraction efficiency
The spectral point spread function and diffraction efficiency of the AOTF were also determined in a similar fashion. The same set of experimental data that was used for the wave-length registration was used to find the spectral point spread function by finding the full width at half maximum for each obtained spectrum. These range from 2 to 5 nm, increasing monotonically with wavelength, and are shown in Fig. 6c. This spectral resolution is well within the specification re-quired in order to retrieve aerosol information as the aerosol
Figure 6. (a) A spectrum taken from the AOTF from the point spread function when the tuning frequency of the AOTF was at 124.96 MHz.(b)The calibration curves for the AOTF tuning curve which contains the data points recorded and fit curve.(c)The full width half maximum for each of the determined wavelengths for the AOTF. The full width half maximum at 600 nm is 1.5 nm and as the wavelengths get longer it increases to 4.9 nm at 1080 nm.
scattering cross section varies relatively slowly across the visible and near-infrared spectral range.
calibra-tion, and the second is measurements of the intensity of the incident collimated light beam. The light in both experiments was linearly polarized and aligned with the polarization axis of the AOTF; for the second set the AOTF was simply re-moved from the optical chain. It should be noted that the at-tenuation of the AOTF crystal itself was not determined in-dependently and is combined with the diffraction efficiency. We are more concerned about signal throughput of the device so the combination of the effects is acceptable. The incident light source was then measured with the same iHR320 spec-trometer and Synapse CCD. By taking the ratio of the inten-sity at the diffracted wavelength to the incident inteninten-sity the diffraction efficiency was determined. It was found to vary between 54 and 64 % across the measured spectral range. It should be noted that the diffraction efficiency changes also with respect to incoming angle and this experimental deter-mination only measured the diffraction efficiency at normal incidence (Xu and Stroud, 1992).
3.3 Stray light
A laboratory experiment to characterize the stray light in the ALI system was also performed. Two types of stray light ex-ist: the first is out-of-field stray light, i.e. a signal that enters the optical path that originates outside of the field of view. The second is internal stray light, which is caused by scat-tering, reflections, or other imperfections in the optical ele-ments. As mentioned above, stray light removal is quite crit-ical for limb scatter measurements.
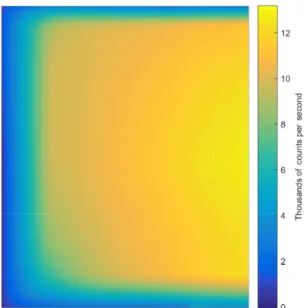
The use of the AOTF has the potential to increase the amount of internal stray light due to the fact that the un-diffracted beam and the unmeasured polarization also prop-agate through the system. However, the diffraction interac-tion only occurs when the acoustic wave signal is applied, so without the acoustic wave the recorded measurement only contains the stray light in the system. Using this characteris-tic, the stray light of the system was measured in the lab-oratory. A 250 W quartz-tungsten light source was passed through a dispersing screen and onto the entrance aperture of ALI, effectively filling the entire aperture and all an-gles within the field of view. Using a variety of exposure times, ranging from 0.1 to 60 s, and wavelengths from 650 to 950 nm in 25 nm intervals, this diffuse source was imaged twice: once with the AOTF in its off state, with no driving acoustic wave, and once with the AOTF in its on state, with the acoustic wave applied (see Fig. 2c). For each pair of mea-surements the image with the “AOTF-off” only contains stray light in the system, and the “AOTF-on” image contains the stray light combined with the image of the diffuse source. Subtracting the AOTF-off image from the AOTF-on image yields a final image that contains only the image of the dif-fuse source. A typical example of a resulting image is shown in Fig. 7. The observed vignetting is caused by the aperture of the AOTF and is expected from the ray trace model. Note that this method also removes any dark current associated with
Figure 7.A calibration image after stray light removal has been performed where the measured wavelength is 750 nm with a 1 s ex-posure time. Vignetting can be seen as moving away from centre of the image. Additionally, the last 1◦of the horizontal field of view on the right side is lost due to strong contamination from reflections within the system.
the detector. This two-image method was used operationally during the balloon measurement campaign such that images captured had a corresponding AOTF-off image immediately obtained with the same exposure time. For the calibration im-ages an average stray-light-to-signal ratio of 2.5×10⁻²was noted.
3.4 Relative flat-fielding calibration
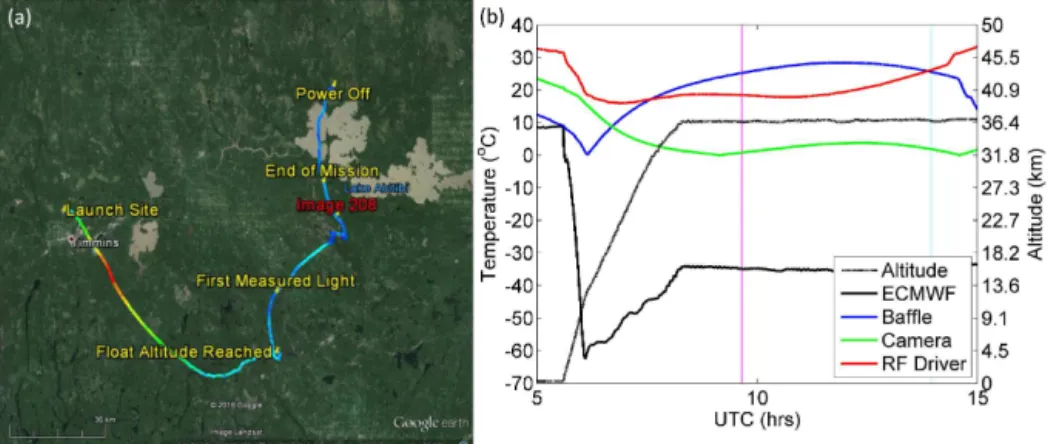
Figure 8. (a)The GPS data from ALI during the Nimbus 7 mission, generated via Google Earth; the colour of the line represents the absolute speed of the gondola during the mission and the blue, green, and red colours represent speeds of approximately 10, 70, and 140 km h−1. Important landmarks are noted on the image. The end of mission represent the end of the aerosol mission. No GPS data were collected from ALI after power down. The location of image 208 is the red label.(b)The temperature and altitude profiles from the NIMBUS 7 flight; the time of image 208 is shown by the cyan vertical line and first light measured by ALI is represented by the magenta vertical line.
the bulb using a method by Kosch et al. (2003). No absolute calibration was performed due to the lack of availability of an appropriately calibrated source.
4 Stratospheric balloon flight
4.1 Flight conditions and measurement modes
The Canadian Space Agency (CSA) balloon launch base is in Timmins, Ontario (48.47◦N, 81.33◦W). ALI was inte-grated onto a CNES pointed gondola and used on-board sub-systems, including communications and power. The CNES gondola is an actively pointed gondola with azimuthal point-ing precision better than 1′ with the use of an onboard star tracker. ALI was orientated so it would be maintained at 90◦ from the azimuthal direction of the sun, with an over-all southern field of view during the mission.
On 19 September 2014 at 05:35 UTC (01:35 LT) ALI was launched as part of the Nimbus 7 mission from the CSA Timmins balloon launch facility. During the launch, the sky was clear with light winds, allowing for a safe and unevent-ful launch. The ascent of the gondola occurred in darkness and reached its flight altitude of 36.5 km at 08:17 UTC. First light was observed by ALI at 09:39 UTC and spectral images were recorded until 14:42 UTC. A visualization of the flight path with major landmarks noted can be found in Fig. 8a. Temperature profiles for the ambient atmosphere and instru-ment are shown in Fig. 8b. The black curve is the ambient atmospheric temperature at the gondola altitude and location during the flight as obtained from ECMWF reanalysis (Dee et al., 2011).
During the mission, ALI operated in two primary acquisi-tion modes: a calibraacquisi-tion mode and an aerosol imaging mode. The first mode, the calibration mode, was primarily used dur-ing ascent when the gondola was in the darkness and
inter-mittently between the aerosol mode during sunlit conditions. During this mode the filtering of the AOTF was not enabled and the system imaged essentially only dark current during the ascent in darkness and stray light during sunlit condi-tions. Eight exposures are taken in the calibration mode with 0.05, 0.1, 0.5, 1, 2, 3, 5, and 10 s exposure times. The second operational mode, the aerosol mode, recorded measurements in a cycle that contained 13 pairs of images across the spec-tral range (650–950 nm every 25 nm), the pairs being a cali-bration image with the AOTF-off and an image of the limb. Each cycle took approximately 12 min with each measure-ment set taking approximately 45 s to acquire with exposure times varying between 0.5 and 6 s.
4.2 Limb measurements
di-Figure 9. (a)Final calibrated 750 nm image, taken at 13:57 UTC, located at 48.55◦N, 80.00◦W with a solar zenith angle and solar scattering angle of 63 and 98◦respectively.(b)The same 750 nm image with the mean of the profile removed from the image leaving the residual signal that shows thin clouds in the troposphere.
rection, there is also some indication of horizontal variation in radiance significantly above the cloud level, possibly due to real atmospheric variability in the aerosol layer. It should also be noted that some high-altitude stray light is also visible in this mean residual image that was not observed in the labo-ratory tests. For the high altitudes in the range of 27 to 30 km, the expected ratio of signal to stray light was estimated to be between 2 and 3 but for the campaign the ratio of signal to stray light for some regions dropped down slightly below 1. This may be due to contamination from scattering from a baf-fle vein or a nearby component of the gondola, although the true cause is unknown at this point.
For ease of further analysis and to increase the precision of the measurements to a minimum of 0.6 MTF, the images were averaged into cells of 25 pixels horizontally and av-eraged vertically onto a 1 km tangent altitude grid. The ra-diance profiles from the centre column of the images for all measurements obtained during the flight are shown in Fig. 10. The first sets of profiles, the dashed lines, which start near 0 and move toward larger values, are the measurements that were recorded near and during sunrise so the gradual in-crease is therefore expected. Measurements obtained for so-lar zenith angles less than 90◦ are represented by the solid
lines. These radiance profiles follow a similar, and expected, exponential shape, with some variability at tangent altitudes below 12 km corresponding largely to changing cloud condi-tions.
A full cycle of 13 spectral images (numbers 204–216) were used in Fig. 11 to show the spectrum of relative cali-brated radiances at selected tangent altitudes. The estimated uncertainty in the radiance is represented by the shading. The uncertainty is approximately 5 % from 5 to 20 km and in-creases up to 8 % from 20 to 35 km. The error term includes the CCD read, DC offset, dark current, stray light removal, and flat-fielding correction error terms. The spectra display the expected and relatively smooth fall off in intensity with increasing wavelength with Chappuis ozone absorption seen at the lower wavelengths; however, the reason for the peak in the spectra at 875 nm is not known and may be due to an inconsistency in the pre-flight calibration.
4.3 Retrieval methodology
As a first application of the ALI measurements, we have applied a slightly modified version of the standard OSIRIS stratospheric aerosol extinction retrieval (Bourassa et al., 2012b) to the flight measurements. This inversion algo-rithm, which is applied from the tropopause to 30 km al-titude, assumes log-normally distributed hydrated sulfuric acid droplets in order to calculate the aerosol scattering cross sections from the Mie scattering solution (Wiscombe, 1980). The modelled radiances for the nonlinear inver-sion were computed with the SASKTRAN high-resolution (SASKTRAN-HR) radiative transfer engine (Bourassa et al., 2008; Zawada et al., 2015) using the newly developed vec-tor module for polarization. The output of SASKTRAN-HR gives the Stokes vectors for the radiance in the model refer-ence frame, which are then rotated into the instrument’s coor-dinate system. Once rotated, the polarization signal required to match the ALI measurement is the vertical polarization given by
Iv= 1
2(I−Q) , (6)
whereI andQare Stokes parameters defined byI = hEx2i+ hEy2iandQ= hE2xi − hEy2i. The variablesExandEyare the horizontal and vertical components of the electric field in the instrument reference frame.
The relative radiance measurements from ALI are used to create measurement vectors,y, as specified in Bourassa et al. (2012b) in the form
y=log
Iv(z, λ)
Iv(zref, λ)
−log
Iv, rayleigh,model(z, λ)
Iv, rayleigh,model(zref, λ)
, (7)
Figure 10.Averaged ALI relative radiance vectors from 12 of the 13 wavelengths from the NIMBUS 7 flight. Each panel presents the radiance vectors from a different wavelength measured which is denoted in the top right corner. The dashed lines are radiance profiles where the solar zenith angle is greater than 90◦and solid lines are profile where the solar zenith angle is less than 90◦. The separation between each consecutive radiance vector at each wavelength is approximately 2◦in solar zenith angle.
Figure 11.Level 1 relative radiances spectrally from 650 to 950 nm as measured from ALI at approximately 14:20 UTC, consisting of images 204 to 216 looking 90◦in the azimuth from the sun facing southwards. These spectral profiles are presented at several tangent altitudes with a horizontal look direction of 0◦. The shading repre-sents the error on the radiances.
the ALI measurements, the highest possible tangent altitude where the signal is above the noise threshold is approxi-mately 30 km tangent height and typical values forzrefwere
between 27 and 30 km. The second term in Eq. (7) uses mod-elled radiances from SASKTRAN-HR with only the molec-ular atmosphere to approximately remove the Rayleigh sig-nal. This is done to improve the speed of the convergence of the retrieval (Bourassa et al., 2012b). An initial guess state, x, for the aerosol extinction and an assumed particle size distribution profile are set in the SASKTRAN-HR model. The forward model vector is then constructed similarly to the measurement vector and used in combination with the measurement vector to update the aerosol extinction coeffi-cient profile using the multiplicative algebraic reconstruction technique (MART) algorithm:
xin+1=xinX j
yj
F zj
, Wij (8)
wherexi is the aerosol extinction at each model altitude,i, andjdenotes a tangent altitude from the measurements.Wij is an element of the weighting matrix that relates the im-portance of each element of the measurement vector to each shell altitude. This method is described in detail by Bourassa et al. (2007).
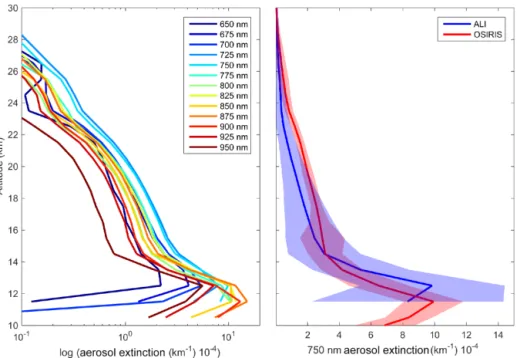
Figure 12.Left is the retrieved aerosol extinction profiles from the last complete imaging cycle consisting of images 205 to 216 from the 0.0◦horizontal line of sight. Right is the 750 nm ALI aerosol extinction in blue compared to the 750 nm extinction measured by OSIRIS in red with its error represented by the respective shading.
A much faster method to use the Jacobian to determine the error has been performed (Bourassa et al., 2012a) but makes an assumption that the gain matrix is equal to the inverse of the Jacobian, as typically the averaging kernel is close to the identity matrix. However, this method adds additional uncer-tainty to the error estimate and, with a limited set of balloon data, it is possible to calculate the gain matrix directly. The error at each retrieved altitude is then given by
E=GSǫGT, (9)
whereSǫ is the covariance matrix of the measurement vec-tor and Eis the covariance of the retrieved aerosol profile (Rodgers, 2000). The reported precision for ALI aerosol ex-tinction retrievals is the square root of the diagonal ofE.
Using the retrieved extinction profiles for the complete spectral range, we have attempted a determination of the Angström exponent using a method similar to that outlined by Rault and Loughman (2013) for the OMPS-LP analysis. In this method, the independently retrieved extinction pro-files at each wavelength and altitude are fit with a straight line in log-wavelength, log-extinction space. The slope of this line corresponds to the Angström exponent. This is then used to find the best match to the spectral dependence of the Mie scattering cross section in order to update the par-ticle size distribution. With only one piece of information, the mode width of the log-normal distribution is fixed to 1.6 and the mode radius is updated. The extinction retrievals are then performed again at each wavelength and the process is iterated until the Angström exponent, corresponding to the determined mode radius, converges.
Ideally, the ALI measurements would be used indepen-dently to also retrieve ozone in the Chappuis band. However, due to the spectral range of the prototype, only a small frac-tion of the long wavelength side of the absorpfrac-tion band was captured. For this analysis, we have not retrieved the ozone profile but have set the ozone profile in SASKTRAN-HR to an average of the five closest coincident ozone profiles mea-sured by OSIRIS at the ALI location and time. The surface albedo used is also from the OSIRIS scans since the two in-struments share a similar measurement method and should determine a similar albedo for the cloudy conditions. Prefer-ably albedo would be determined from ALI following the method of Bourassa et al. (2012b); however, due to the lack of an absolute calibration this was not possible.
4.4 Results
The above retrieval method was applied to a complete cy-cle of ALI spectral images (numbers 204–216 of the balloon mission). The retrieved aerosol extinction profiles can be seen in the left panel of Fig. 12. Note the log scale. The dif-ference between the measurement and forward model vectors was less than 2 % for the majority of the retrieval region, ap-proximately 13 to 28 km, across all wavelengths. Note the be-haviour of decreasing extinction with increasing wavelength, as expected due to the dependence of the cross section with respect to particle size.
measurement error and neglects any model and atmospheric state errors. From the calibration on ALI the uncertainty was between 5 and 8 % depending on altitude and is composed of approximately 3–5 % from the flat-fielding calibration; the last 1–3 % is attributed primarily to dark current, DC offset, and stray light calibrations. When calculating the measure-ment vector, the covariance is based on the uncertainty in the radiance at the retrieved altitude and the reference altitude. The covariance of the measurement vector, as seen in Eq. (9), is given by
Sǫ,ij =
δI
v(zj,λ)
Iv(zj,λ)
2
+δIv(zref,λ)
Iv(zref,λ)
2
, ifi=j
δIv(zref,λ)
Iv(zref,λ)
, otherwise.
(10)
This results in relative error in the measurement vectors of approximately 10–15 % for the cross terms and 25–35 % for the diagonal terms. Propagating this uncertainty though the retrieval method results in large uncertainty on the retrieved aerosol extinction around 40–70 % dependent on the altitude. Reducing the error in the relative calibration would greatly improve the overall uncertainty in the ALI retrievals since it contributes the current largest factor to the calibrated radi-ances.
The 750 nm aerosol extinction determined by ALI is com-pared to the retrieved aerosol extinctions by OSIRIS. In the right panel of Fig. 12 the red curve is the average 750 nm aerosol extinction profile of the same five coincident OSIRIS scans used for the ozone profile. The retrieved extinction pro-files from ALI and OSIRIS are within the total retrieval un-certainty. It is encouraging that the instruments follow the same overall profile shape including the stratospheric layer and the steep increase below 15 km. Aerosol is notoriously difficult to validate in remote sensing with various technique and instrument geometries, and the SAGE II, SAGE III, and OSIRIS differences are generally below 20–30 % up to 30 km (Bourassa et al., 2012b; Rieger et al., 2015). However, given the retrieved uncertainty, the OSIRIS profile is only outside the upper error bound of ALI by less than 10 % be-tween 20 and 25 km. There are also several possible system-atic errors not accounted for in the inversion, including the choice of retrieval altitude ranges, particle size distribution and particle composition, stray light, and the high-altitude aerosol load. The solar scattering angle for a measurement can also have an effect on the retrieved profile due sensitivity to the scattering cross sections from the particle size distri-butions. For the ALI image the solar scattering angle is 98◦ and for the five OSIRIS scans they are 77, 89, 90, 91, 92, and 93◦. With the exception of the forward scatter angles of 77 and 89◦from OSIRIS, the scattering angles between OSIRIS and ALI are similar and should not cause a large effect on the retrieved profiles. Furthermore, there may be further is-sues to explore with the polarized measurement and forward model. Regardless, the results are encouraging.
The particle size method outlined above was also ap-plied to this measurement set. The retrieved extinction at
Figure 13.The top panel shows the convergence of two sample par-ticle size retrievals; blue and red represent an initial state of 0.08 and 0.12 µm mode radius respectively. Both initial states converge to the same value over approximately three iterations in the particle size retrieval method. The middle panel shows the final Angström ex-ponents determined from images 204–216. The shading represents the error associated with the least squares fit. The bottom panel shows a typical least squares fit of the retrieved extinction values over wavelength to determine the Angström exponent at model al-titude of 14.5 km.
parame-ters are certainly within an expected range (Angström coeffi-cient of 2.1–3.4), although there is a relatively large error bar on the retrieved value, limiting the usefulness of the retrieved particle size information for background aerosol. However, with these error bars, even this limited spectral range would have the sensitivity to detected particle size changes as seen by OSIRIS and SAGE II over recent decades due to small volcanic perturbations (Rieger et al., 2014).
5 Conclusions
The ALI prototype, which is a telescopic acousto-optic im-ager, has been used to successfully measure two-dimensional spectral images of the atmospheric limb from stratospheric balloon. The observed radiances appear to be of high qual-ity and show both vertical and horizontal features of the cloud and aerosol layers. Aerosol extinction coefficient pro-files were retrieved from the ALI data that show reasonable agreement with OSIRIS satellite measurements.
No large-scale issues were found with the instrument performance; however, some future changes would be rec-ommended. First, an absolute calibration of the instrument would allow ALI to determine the albedo directly, as is done with OSIRIS. This would remove some of the uncertainty in the model inputs and likely yield higher-quality results. This is simply a matter of having access to the calibration equipment. Also, even with the baffle and the robust method of removing stray light with the cycling of the AOTF, some stray light was still observed in the obtained images. Impact and mitigation of this should be tackled in future iterations of the instrument.
Acknowledgements. This work would have not been possible without funding from the CSA to design and build ALI through the FAST program as well as the CSA building and managing the launch facility in Timmins, Ontario. Also, thanks to CNES for funding and overseeing the launches at Timmins in 2014. The optical design analysis was performed in thanks to Synopsys for the use of a Code V software license. The CALIPSO data were obtained from the NASA Langley Research Center Atmospheric Science Data Center. Thanks as well to Nick Lloyd for help in development of the flight code; without his efforts, this work would have not been accomplished.
Edited by: J. Joiner
References
Andersson, S. M., Martinsson, B. G., Vernier, J.-P., Friberg, J., Brenninkmeijer, C. A., Hermann, M., van Velthoven, P. F., and Zahn, A.: Significant radiative impact of volcanic aerosol in the lowermost stratosphere, Nature, 6, 7692, doi:10.1038/ncomms8692, 2015.
Beuttell, R. G. and Brewer, A. W.: Instruments for the mea-surement of the visual range, J. Sci. Instrum., 26, 357–359, doi:10.1088/0950-7671/26/11/302, 1949.
Bourassa, A. E., Degenstein, D. A., Gattinger, R. L., and Llewellyn, E. J.: Stratospheric aerosol retrieval with op-tical spectrograph and infrared imaging system limb scatter measurements, J. Geophys. Res., 112, D10217, doi:10.1029/2006JD008079, 2007.
Bourassa, A. E., Degenstein, D. A., and Llewellyn, E. J.: SASK-TRAN: a spherical geometry radiative transfer code for efficient estimation of limb scattered sunlight, J. Quant. Spectrosc. Ra., 109, 52–73, doi:10.1016/j.jqsrt.2007.07.007, 2008.
Bourassa, A. E., McLinden, C. A., Bathgate, A. F., Elash, B. J., and Degenstein, D. A.: Precision estimate for Odin-OSIRIS limb scatter retrievals, J. Geophys. Res., 117, D04303, doi:10.1029/2011JD016976, 2012a.
Bourassa, A. E., Rieger, L. A., Lloyd, N. D., and Degenstein, D. A.: Odin-OSIRIS stratospheric aerosol data product and SAGE III intercomparison, Atmos. Chem. Phys., 12, 605–614, doi:10.5194/acp-12-605-2012, 2012b.
Bourassa, A. E., Robock, A., Randel, W. J., Deshler, T., Rieger, L. A., Lloyd, N. D., Llewellyn, E. T., and Degen-stein, D. A.: Large volcanic aerosol load in the stratosphere linked to Asian monsoon transport, Science, 337, 78–81, 2012c. Bourassa, A. E., Robock, A., Randel, W. J., Deshler, T., Rieger, L. A., Lloyd, N. D., Llewellyn, E., and Degenstein, D. A.: Response to comments on “Large volcanic aerosol load in the stratosphere linked to Asian monsoon transport”, Science, 339, 647–647, 2013.
Bovensmann, H., Burrows, J., Buchwitz, M., Frerick, J., Noël, S., Rozanov, V., Chance, K., and Goede, A.: SCIAMACHY: mission objectives and measurement modes, J. Atmos. Sci., 56, 127–150, 1999.
Charlson, R. J., Ahlquist, N., Selvidge, H., and MacCready Jr., P.: Monitoring of atmospheric aerosol parameters with the integrat-ing nephelometer, JAPCA J. Air Waste Ma., 19, 937–942, 1969. Chazette, P., David, C., Lefrere, J., Godin, S., Pelon, J., and Mégie, G.: Comparative lidar study of the optical, geometrical, and dynamical properties of stratospheric postvolcanic aerosols, following the eruptions of el chichon and mount pinatubo, J. Geophys. Res., 100, 23–195, 1995.
Chuang, T., Burns, P., Walters, E. B., Wysocki, T., Deely, T., Losse, A., Le, K., Drumheller, B., Schum, T., Hart, M., Puffen-burger, K., Ziegler, B., and Hovis, F.: ”Space-based, multi-wavelength solid-state lasers for NASA’s Cloud Aerosol Trans-port System for International Space Station (CATS-ISS), Proc. SPIE, 8599, Solid State Lasers XXII: Technology and Devices, 85990N, doi:10.1117/12.2005545, 2013.
Cisewski, M., Zawodny, J., Gasbarre, J., Eckman, R., Topiwala, N., Rodriguez-Alvarez, O., Cheek, D., and Hall, S.: The strato-spheric aerosol and gas experiment (SAGE III) on the interna-tional space station (ISS) mission, Proc. SPIE, 9241, 924107– 924107-7, doi:10.1117/12.2073131, 2014.
Clarisse, L., Coheur, P.-F., Theys, N., Hurtmans, D., and Clerbaux, C.: The 2011 Nabro eruption, a SO2plume height analysis us-ing IASI measurements, Atmos. Chem. Phys., 14, 3095–3111, doi:10.5194/acp-14-3095-2014, 2014.
Dee, D. P., Uppala, S. M., Simmons, A. J., Berrisford, P., Poli, P., Kobayashi, S., Andrae, U., Balmaseda, M. A., Balsamo, G., Bauer, P., Bechtold, P., Beljaars, A. C. M., van de Berg, L., Bidlot, J., Bormann, N., Delsol, C., Dragani, R., Fuentes, M., Geer, A. J., Haimberger, L., Healy, S. B., Hersbach, H., Hlm, E. V., Isaksen, L., Kllberg, P., Khler, M., Matricardi, M., McNally, A. P., Monge-Sanz, B. M., Morcrette, J.-J., Park, B.-K., Peubey, C., de Rosnay, P., Tavolato, C., Thpaut, J.-N., and Vitart, F.: The ERA-interim reanalysis: configuration and perfor-mance of the data assimilation system, Q. J. Roy. Meteor. Soc., 137, 553–597, doi:10.1002/qj.828, 2011.
Dekemper, E., Loodts, N., Opstal, B. V., Maes, J., Vanhelle-mont, F., Mateshvili, N., Franssens, G., Pieroux, D., Bingen, C., Robert, C., Vos, L. D., Aballea, L., and Fussen, D.: Tunable acousto-optic spectral imager for atmospheric composition mea-surements in the visible spectral domain, Appl. Optics, 51, 6259– 6267, doi:10.1364/AO.51.006259, 2012.
Deshler, T., Hervig, M., Hofmann, D., Rosen, J., and Liley, J.: Thirty years of in situ stratospheric aerosol size distribu-tion measurements from Laramie, Wyoming (41 N), us-ing balloon-borne instruments, J. Geophys. Res., 108, 4167, doi:10.1029/2002JD002514, 2003.
Deshler, T., Anderson-Sprecher, R., Jger, H., Barnes, J., Hof-mann, D. J., Clemesha, B., Simonich, D., Osborn, M., Grainger, R. G., and Godin-Beekmann, S.: Trends in the nonvolcanic component of stratospheric aerosol over the period 1971–2004, J. Geophys. Res., 111, D01201, doi:10.1029/2005JD006089, 2006.
Ernst, F., von Savigny, C., Rozanov, A., Rozanov, V., Eichmann, K.-U., Brinkhoff, L. A., Bovensmann, H., and Burrows, J. P.: Global stratospheric aerosol extinction profile retrievals from SCIAMACHY limb-scatter observations, Atmos. Meas. Tech. Discuss., 5, 5993–6035, doi:10.5194/amtd-5-5993-2012, 2012. Fairlie, T. D., Vernier, J.-P., Natarajan, M., and Bedka, K. M.:
Dispersion of the Nabro volcanic plume and its relation to the Asian summer monsoon, Atmos. Chem. Phys., 14, 7045–7057, doi:10.5194/acp-14-7045-2014, 2014.
Fischer, R. E., Tadic-Galeb, B., and Yoder, P. R.: Optical System Design, 2nd Edn., McGraw-Hill, New York, USA, 2008. Fromm, M., Nedoluha, G., and Charvt, Z.: Comment on “Large
vol-canic aerosol load in the stratosphere linked to Asian monsoon transport”, Science, 339, p. 647, doi:10.1126/science.1228605, 2013.
Fromm, M., Kablick, G., Nedoluha, G., Carboni, E., Grainger, R., Campbell, J., and Lewis, J.: Correcting the record of vol-canic stratospheric aerosol impact: nabro and sarychev peak, J. Geophys. Res., 119, 10343–10364, doi:10.1002/2014JD021507, 2014.
Fyfe, J. C., Gillett, N. P., and Zwiers, F. W.: Overestimated global warming over the past 20 years, Nature Climate Change, 3, 767– 769, 2013.
Georgiev, G., Glenar, D. A., and Hillman, J. J.: Spectral charac-terization of acousto-optic filters used in imaging spectroscopy, Appl. Optics, 41, 209–217, doi:10.1364/AO.41.000209, 2002. Gilbert, K., Turnbull, D., Walker, K., Boone, C., McLeod, S.,
Butler, M., Skelton, R., Bernath, P., Chateauneuf, F., and Soucy, M.-A.: The onboard imagers for the Canadian ACE SCISAT-1 mission, J. Geophys. Res., 112, D12207, doi:10.1029/2006JD007714, 2007.
Haywood, J. M., Jones, A., and Jones, G. S.: The impact of vol-canic eruptions in the period 2000–2013 on global mean tem-perature trends evaluated in the HadGEM2-ES climate model, Atmos. Sci. Lett., 15, 92–96, doi:10.1002/asl2.471, 2014. Hofmann, D., Barnes, J., O’Neill, M., Trudeau, M., and Neely, R.:
Increase in background stratospheric aerosol observed with lidar at Mauna Loa observatory and Boulder, Colorado, Geophys. Res. Lett., 36, L15808, doi:10.1029/2009GL039008, 2009.
Junge, C. E., Chagnon, C. W., and Manson, J. E.: Strato-spheric aerosols, J. Atmos. Sci., 18, 81–108, doi:10.1175/1520-0469(1961)018<0081:SA>2.0.CO;2, 1961.
Kiehl, J. T. and Briegleb, B. P.: The relative roles of sulfate aerosols and greenhouse gases in climate forcing, Science, 260, 311–314, doi:10.1126/science.260.5106.311, 1993.
Kosch, M., Mäkinen, S., Sigernes, F., and Harang, O.: Absolute op-tical calibration using a simple tungsten light bulb: experiment, in: Proceedings of the 30th Annual European Meeting on At-mospheric Studies by Optical Methods, August 2003, Longyear-byen, Norway, 50–54, 2003.
Kovilakam, M. and Deshler, T.: On the accuracy of stratospheric aerosol extinction derived from in situ size distribution measure-ments and surface area density derived from remote SAGE II and HALOE extinction measurements, J. Geophys. Res., 120, 8426– 8447, doi:10.1002/2015JD023303, 2015.
Llewellyn, E., Lloyd, N. D., Degenstein, D. A., Gattinger, R. L., Petelina, S. V., Bourassa, A. E., Wiensz, J. T., Ivanov, E. V., McDade, I. C., Solheim, B. H., McConnell, J. C., Haley, C. S., von Savigny, C., Sioris, C. E., McLinden, C. A., Grifoen, E., Kaminski, J., Evans, W. F. J., Puckrin, E., Strong, K., Wehrle, V., Hum, R. H., Kendall, D. J. W., Matsushita, J., Murtagh, D. P., Brohede, S., Stegman, J., Witt, G., Barnes, G., Payne, W. F., Piche, L., Smith, K., Warshaw, G., Deslauniers, D. L., Marc-hand, P., Richardson, E. H., King, R. A., Wevers, I., Mc-Creath, W., Kyrola, E., Oikarinen, L., Leppelmeier, G. W., Auvi-nen, H., Megie, G., Hauchecorne, A., Lefevre, F., de La Noe, J., Ricaud, P., Frisk, U., Sjoberg, F., von Scheele, F., and Nordh, L.: The OSIRIS instrument on the Odin spacecraft, Can. J. Phys., 82, 411–422, doi:10.1139/p04-005, 2004.
McElroy, C. T., Nowlan, C. R., Drummond, J. R., Bernath, P. F., Barton, D. V., Dufour, D. G., Midwinter, C., Hall, R. B., Ogyu, A., Ullberg, A., Wardle, D. I., Kar, J., Zou, J., Nichi-tiu, F., Boone, C. D., Walker, K. A., and Rowlands, N.: The ACE-MAESTRO instrument on SCISAT: description, perfor-mance, and preliminary results, Appl. Optics, 46, 4341–4356, doi:10.1364/AO.46.004341, 2007.
Murphy, D. M., Froyd, K. D., Schwarz, J. P., and Wilson, J. C.: Observations of the chemical composition of stratospheric aerosol particles, Q. J. Roy. Meteor. Soc., 140, 1269–1278, doi:10.1002/qj.2213, 2014.
Neely, R. R., Yu, P., Rosenlof, K. H., Toon, O. B., Daniel, J. S., Solomon, S., and Miller, H. L.: The contribution of anthro-pogenic SO2emissions to the Asian tropopause aerosol layer, J. Geophys. Res., 119, 1571–1579, doi:10.1002/2013JD020578, 2014.
Ridley, D. A., Solomon, S., Barnes, J. E., Burlakov, V. D., Desh-ler, T., Dolgii, S. I., Herber, A. B., Nagai, T., Neely, R. R., Nevzorov, A. V., Ritter, C., Sakai, T., Santer, B. D., Sato, M., Schmidt, A., Uchino, O., and Vernier, J. P.: Total vol-canic stratospheric aerosol optical depths and implications for global climate change, Geophys. Res. Lett., 41, 7763–7769, doi:10.1002/2014GL061541, 2014.
Rieger, L. A., Bourassa, A. E., and Degenstein, D. A.: Stratospheric aerosol particle size information in Odin-OSIRIS limb scatter spectra, Atmos. Meas. Tech., 7, 507–522, doi:10.5194/amt-7-507-2014, 2014.
Rieger, L. A., Bourassa, A. E., and Degenstein, D. A.: Merging the OSIRIS and SAGE II stratospheric aerosol records, J. Geophys. Res., 120, 8890–8904, doi:10.1002/2015JD023133, 2015. Rodgers, C.: Inverse Methods for Atmospheric Sounding: theory
and Practice, Series on Atmospheric, Oceanic and Planetary Physics: 1999, World Scientific, River Edge, NJ, USA, 2000. Rogers, R. R., Hostetler, C. A., Hair, J. W., Ferrare, R. A., Liu,
Z., Obland, M. D., Harper, D. B., Cook, A. L., Powell, K. A., Vaughan, M. A., and Winker, D. M.: Assessment of the CALIPSO Lidar 532 nm attenuated backscatter calibration us-ing the NASA LaRC airborne High Spectral Resolution Lidar, Atmos. Chem. Phys., 11, 1295–1311, doi:10.5194/acp-11-1295-2011, 2011.
Russell, P. and McCormick, M.: SAGE II aerosol data validation and initial data use: an introduction and overview, J. Geophys. Res., 94, 8335–8338, 1989.
Sawamura, P., Vernier, J. P., Barnes, J. E., Berko, T. A., Wel-ton, E. J., Alados-Arboledas, L., Navas-Guzmn, F., Pap-palardo, G., Mona, L., Madonna, F., Lange, D., Sicard, M., Godin-Beekmann, S., Payen, G., Wang, Z., Hu, S., Tri-pathi, S. N., Cordoba-Jabonero, C., and Ho, R. M.: Stratospheric AOD after the 2011 eruption of Nabro volcano measured by lidars over the Northern Hemisphere, Environ. Res. Lett., 7, 034013, doi:10.1088/1748-9326/7/3/034013, 2012.
Sioris, C. E., Boone, C. D., Bernath, P. F., Zou, J., McElroy, C. T., and McLinden, C. A.: Atmospheric chemistry experiment (ACE) observations of aerosol in the upper troposphere and lower strato-sphere from the Kasatochi volcanic eruption, J. Geophys. Res., 115, D00L14, doi:10.1029/2009JD013469, 2010.
Smith, W. J.: Modern Optical Engineering, McGraw-Hill, New York, USA, 2000.
Solomon, S., Daniel, J. S., Neely, R. R., Vernier, J.-P., Dutton, E. G., and Thomason, L. W.: The persistently variable background stratospheric aerosol layer and global climate change, Science, 333, 866–870, doi:10.1126/science.1206027, 2011.
Stocker, T. F., Qin, D., Plattner, G.-K., Tignor, M. M., Allen, S. K., Boschung, J., Nauels, A., Xia, Y., Bex, V., and Midgley, P. M.: Climate Change 2013, The Physical Science Basis, Cambridge University Press, Cambridge, UK and New York, USA, 2013. Suhre, D. R., Denes, L. J., and Gupta, N.: Telecentric confocal
optics for aberration correction of acousto-optic tunable filters, Appl. Optics, 43, 1255–1260, doi:10.1364/AO.43.001255, 2004. Taha, G., Rault, D. F., Loughman, R. P., Bourassa, A. E., and von Savigny, C.: SCIAMACHY stratospheric aerosol extinction pro-file retrieval using the OMPS/LP algorithm, Atmos. Meas. Tech., 4, 547–556, doi:10.5194/amt-4-547-2011, 2011.
Thomason, L. W. and Taha, G.: SAGE III aerosol extinction measurements: initial results, Geophys. Res. Lett., 30, 1631, doi:10.1029/2003GL017317, 2003.
Thomason, L. W. and Vernier, J.-P.: Improved SAGE II cloud/aerosol categorization and observations of the Asian tropopause aerosol layer: 1989–2005, Atmos. Chem. Phys., 13, 4605–4616, doi:10.5194/acp-13-4605-2013, 2013.
Uchida, N.: Optical properties of single-crystal paratellurite (TeO2), Phys. Rev. B, 4, 3736–3745, doi:10.1103/PhysRevB.4.3736, 1971.
Vanhellemont, F., Tetard, C., Bourassa, A., Fromm, M., Dodion, J., Fussen, D., Brogniez, C., Degenstein, D., Gilbert, K. L., Turn-bull, D. N., Bernath, P., Boone, C., and Walker, K. A.: Aerosol extinction profiles at 525 nm and 1020 nm derived from ACE imager data: comparisons with GOMOS, SAGE II, SAGE III, POAM III, and OSIRIS, Atmos. Chem. Phys., 8, 2027–2037, doi:10.5194/acp-8-2027-2008, 2008.
Vernier, J.-P., Thomason, L., and Kar, J.: CALIPSO detection of an Asian tropopause aerosol layer, Geophys. Res. Lett., 38, L07804, doi:10.1029/2010GL046614, 2011a.
Vernier, J.-P., Thomason, L. W., Pommereau, J.-P., Bourassa, A., Pelon, J., Garnier, A., Hauchecorne, A., Blanot, L., Trepte, C., Degenstein, D., and Vargas, F.: Major influence of trop-ical volcanic eruptions on the stratospheric aerosol layer during the last decade, Geophys. Res. Lett., 38, L12807, doi:10.1029/2011GL047563, 2011b.
Vernier, J.-P., Thomason, L. W., Fairlie, T. D., Minnis, P., Pa-likonda, R., and Bedka, K. M.: Comment on “Large volcanic aerosol load in the stratosphere linked to Asian monsoon trans-port”, Science, 339, p. 647, doi:10.1126/science.1227817, 2013. Voloshinov, V.: Spectral and polarization analysis of optical images by means of acoustooptics, Optics Laser Technology, 28, 119– 127, doi:10.1016/0030-3992(95)00079-8, 1996.
Voloshinov, V. B. and Mosquera, J. C.: Wide-aperture acousto-optic interaction in birefringent crystals, Opt. Spectrosc.+, 101, 635– 641, doi:10.1134/S0030400X06100225, 2006.
Voloshinov, V. B., Yushkov, K. B., and Linde, B. B. J.: Improve-ment in performance of a TeO2 acousto-optic imaging spectrom-eter, J. Opt. A-Pure Appl. Op., 9, 341–347, doi:10.1088/1464-4258/9/4/006, 2007.
von Savigny, C., Ernst, F., Rozanov, A., Hommel, R., Eichmann, K.-U., Rozanov, V., Burrows, J. P., and Thomason, L. W.: Improved stratospheric aerosol extinction profiles from SCIAMACHY: val-idation and sample results, Atmos. Meas. Tech., 8, 5223–5235, doi:10.5194/amt-8-5223-2015, 2015.
Winker, D. M., Hunt, W. H., and McGill, M. J.: Initial perfor-mance assessment of CALIOP, Geophys. Res. Lett., 34, L19803, doi:10.1029/2007GL030135, 2007.
Wiscombe, W. J.: Improved mie scattering algorithms, Appl. Op-tics, 19, 1505–1509, 1980.
Xu, J. and Stroud, R.: Acousto-Optic Devices: Principles, Design, and Applications, Vol. 12, Wiley-Interscience, New York, USA, 1992.