www.nat-hazards-earth-syst-sci.net/14/1/2014/ doi:10.5194/nhess-14-1-2014
© Author(s) 2014. CC Attribution 3.0 License.
Natural Hazards
and Earth System
Sciences
Comment on
“Comparative study on earthquake and ground based transmitter
induced radiation belt electron precipitation at middle latitude”,
by Sideropoulos et al. (2011)
J.-A. Sauvaud1, M. Parrot2, and E. Slominska3
1IRAP-UMR5277, CNRS-University of Toulouse, Toulouse, France 2LPC2E, UMR7328, CNRS-University of Orléans, Orléans, France 3Space Research Center (CBK), Academy of Sciences, Warsaw, Poland
Correspondence to:J.-A. Sauvaud ([email protected])
Received: 19 June 2013 – Published in Nat. Hazards Earth Syst. Sci. Discuss.: 26 July 2013 Revised: 4 November 2013 – Accepted: 17 November 2013 – Published: 2 January 2014
Abstract.We show that many, if not all, electron bursts with energy dispersion claimed to be earthquake precursors by Sideropoulos et al. (2011) are due to the cyclotron resonance of electrons with monochromatic waves from VLF transmit-ters. The geographic distribution of the VLF-related electron bursts is established during a period in 2007, when the pow-erful NWC transmitter is off and 20 more transmitters are operating.
1 Introduction
Recently a number of papers have appeared in the litera-ture claiming that earthquakes are preceded by the detection of electron bursts onboard the low altitude sun-synchronous satellite Demeter. Several of these papers present case studies and include some statistics (e.g., Sideropoulos et al., 2011, Anagnostopoulos et al., 2012), while others are based only on statistical studies (e.g., Zhang et al., 2010, 2013). While case studies allow a careful examination of the presented results, statistical studies are almost immune to examination of the initial data, allowing the authors to claim earthquake precur-sors using energetic particle data and VLF data. These works raise the question: Can precipitation bursts ever be uniquely identified as earthquake precursors?
The aim of this comment is to show that many, if not all, electron bursts with energy dispersion, measured along the
orbit of Demeter and presented as an earthquake precursor by Sideropoulos et al. (2011), result from the cyclotron res-onance of radiation belt electrons with monochromatic VLF waves emitted by powerful VLF transmitters. The paper is di-vided into two parts. In the first part we will examine bursts presented as examples of earthquake precursors when the NWC (North West Cape) transmitter in Australia is switched on. In the second part we will examine a published case per-taining to periods when NWC is switched off, i.e., from 1 July 2007 to 22 January 2008. During that period, geographi-cal distributions of VLF transmitters and of the induced elec-tron bursts are presented and modeled.
This study shows that the measured electron bursts show-ing a wisp structure are not associated with earthquakes, but with cyclotron resonance of electrons with monochromatic waves emitted by VLF transmitters.
In a recent paper, Anagnostopoulos et al. (2011) studied four cases of Demeter data showing electron bursts when the NWC transmitter was operating. It emits a power of 1 MW at 19.8 kHz, in the North West Cape of Australia. The ef-fect of this transmitter on energetic radiation belt electrons measured onboard the low-orbiting polar spacecraft DEME-TER was reported by Sauvaud et al. (2008) and Gamble et al. (2008). More recently, a paper by Selesnick et al. (2013) provided a full simulation of the effect of the NWC waves on the radiation belt electrons based on a stochastic model of electron transport that includes pitch angle diffusion, radial diffusion, energy loss, and azimuthal drift.
The main signature of the interaction of energetic electrons with the transmitter monochromatic waves as seen at 700 km altitude is the formation of a wisp feature. The enhancements are initially observed within a few degrees west of NWC and are present in 95 % of the orbital data east of the transmitter up to the South Atlantic Anomaly for time periods when the transmitter is broadcasting and located in nightside (Gamble, 2008; Sauvaud et al., 2008).
Studying electron bursts, Sideropoulos et al. (2011) did not take advantage of the fine energy resolution of the IDP en-ergetic electron instrument onboard Demeter (see Sauvaud et al., 2006, 2013), and reached conclusions about electron burst based only on the examination of the variations along the Demeter orbit of three integral fluxes in the energy bands 92–526, 526–971 and 971–2350 keV (the energy range 72– 90 keV, which is polluted by electronic noise, has been ex-cluded). However, the energy-dispersed electron structure caused by NWC is only clearly apparent in the energy–time spectrograms of the IDP instruments, with 128 (256) energy channels in survey (burst) mode. In Fig. 1a and b we show such measurements, for two cases studied by Sideropoulos, together with the electric component of waves in the fre-quency range from 10 kHz to 20 kHz provided by the ICE in-strument onboard Demeter and with the three integral energy fluxes discussed above. Figure 1a and b should be compared with Figs. 1a and 2a of Sideropoulos et al. (2011).
Fig. 1. (a)Energetic electrons and wave data along a half-orbit on 2 November 2006. The top panel gives the variations in the electron fluxes in three energy ranges (90–526 keV, 526–971 keV and 971– 2350 keV). The middle panel shows the electron energy time spec-trogram and the bottom panel gives the frequency–time specspec-trogram of the electric component of the VLF waves in the frequency range from 10 to 20 kHz.(b)Same as(a)for a pass on 13 August 2005.
Figure 1a presents measurements for which the electron bursts detected around 14:30 and 14:53 UT on 2 November 2006 have been attributed by Sideropoulos et al. (2011) to the near-equatorial resonance of electrons with the waves emitted by the NWC transmitter. The energy–time spec-trogram of electrons presented in Fig. 1a indeed shows at 14:30 UT the typical energy-dispersed structure expected for such resonance, here in the Southern Hemisphere. Later dur-ing the same half-orbit, around 14:53 UT, the measurements are made slightly westward of the NWC transmitter, which results in a less marked structure.
Fig. 1c.Detailed frequency–time spectrogram of the electric com-ponent of the waves in the 0–5000 Hz range measured onboard Demeter from 13:14:50 and 13:15:10 UT on August 13 2005, when Demeter is in burst mode (see Fig. 1b). Whistlers with frequency– time dispersion can be clearly distinguished. Their dispersion is however small, which comes from the fact that lightnings occur be-low the spacecraft, in the same hemisphere. Bebe-low the local proton gyro frequency (500 Hz), a number of proton whistlers, also related to lightnings, are visible. Using the WWLLN lightnings database, it was verified that Demeter encountered a number of lightnings over a very large region of thunderstorms during this northern pass over Asia.
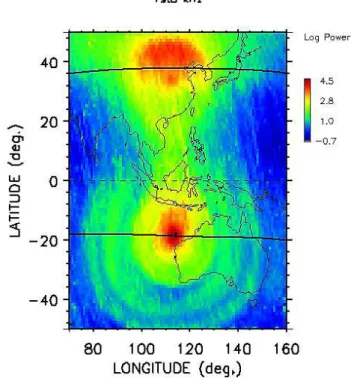
electron bursts two times, at conjugate locations in the North-ern and SouthNorth-ern hemispheres, around 13:01 and 13:20 UT. It must be stressed that the energy-dispersed nature of the bursts is clearly visible in Fig. 1b and that they are very similar to the structures displayed in Fig. 1a. However, Sideropoulos et al. (2011) attributed these bursts to a “clear example” of a precursor to an earthquake occurring on 16 August 2005 in Japan. They associated the electron burst with the enhanced VLF signal recorded in the Northern Hemisphere between 13:17 and 13:25 UT and noted that an-other VLF burst was also seen in the Southern Hemisphere. Two main remarks must be made regarding this association: (i) the considered VLF waves being largely distributed in frequency, they should resonate with electrons in a broad range of energies, which is clearly not observed, and (ii) the power of the natural VLF waves is weak compared with the NWC signal. In order to illustrate this fact, Fig. 2 presents the nightside distribution of the VLF waves in a frequency range 15–25 kHZ in the vicinity of Australia and in the con-jugate hemisphere. Just above NWC the average wave power is above 104µV2cm−2s, while the power of the natural VLF waves recorded onboard Demeter around 13:20 UT is less than 10 µV2cm−2s. The effect of NWC is thus expected to be completely dominant.
The measured VLF waves in Fig. 1b are examined in detail as in Fig. 1c. These emissions are made up of discrete packets
Fig. 2.Distribution of the electric power of the NWC transmitter at Demeter altitudes. The power of the NWC transmitter is 104higher than that measured at 13:20 UT on 13 August 2005 in the frequency range 10–19 kHz (see Fig. 1). The black curves indicate theL=1.4 contours at the satellite altitude.
of whistler waves, measured when Demeter is in burst mode. At the lowest frequencies, below the local proton gyro fre-quency, proton whistlers are detected. They are known to oc-cur immediately after an upwardly propagating whistler has been generated by a lightning discharge. We have been able to check, using the WWLLN database, that Demeter passes over a large region where numerous lightnings occur in the Asian sector. It is thus natural to attribute the VLF signal detected by Demeter to the effect of lightnings instead of in-voking a hypothetical precursor to an earthquake (see also Inan et al., 2007; Parrot et al., 2013).
Furthermore, the electron bursts, when displayed in a energy–time spectrogram, show the typical dispersion struc-ture resulting from their interaction with monochromatic waves. Recently, Selesnick et al. (2013) performed a full simulation of the effect of the NWC waves on the radiation belt electrons based on a stochastic model of electron trans-port that includes pitch angle diffusion, radial diffusion, en-ergy loss, and azimuthal drift. They showed that the Demeter electron-dispersed structures are in agreement with their cal-culations.
the computation of wave-particle interaction described in the text. The dashed lines are for a plasmaspheric plasma density enhanced (lower curve) and divided by a factor 1.3 (upper curve).
energy change expected from a simple model of equatorial cyclotron resonance.
Whistler-mode waves from NWC are at fixed-frequency ω, with the index of refractionµ=kc/ωgiven by
µ2=1+ ω 2 p
ω(|cosθ| −ω (1) for wave numberk, wave normal angleθ, plasma frequency ωp, and electron cyclotron frequency. The condition for electron-wave cyclotron resonance is
ω−kkvk=
n
ϒ , (2)
wherenis a positive or negative integer, or zero,kk=kcosθ,
vk=vcosα,vis the electron speed,γthe Lorentz factor, and
αis the local pitch angle. The wave normal is taken equal to 60◦. For equatorial resonance, the pitch angle of electrons is computed in a way that electrons have a 90◦ pitch angle at the satellite altitude. Following Selesnick et al. (2013), for evaluation of the plasma frequency, the plasma density is taken equal toA×103L−1.7cm−3, with A varying in the range 9000–18 000 cm−3. Note that the ionospheric density has been neglected, as above L=1.4 it represents only a weak part of the plasmaspheric one.
The results of the computations are displayed together with the measured electron energy spectrogram (Fig. 3). The computed energy resonance (white curves) well fit the measured electron dispersion shape. Here the A term in the plasma density relation is taken equal to 18 000 cm−3for the solid curve. The dashed curves are for an inner plasmaspheric density 30 % higher and 30 % lower.
From the comparison of the shape and location of the en-ergy structures and of the model enen-ergy band we conclude, following earlier works by Sauvaud et al. (2008), Gamble et al. (2008) and Selesnick et al. (2013), that the observed
in Fig. 4a that around 10:58 UT, besides the wisp structure, there is a weak vertical feature. It corresponds to the highest fluxes in the wisp structure itself (around 160 keV). Checking other wisps all around the Earth, we found several of these weak vertical structures, each time associated with the high-est fluxes inside the wisps. The signal at the lowhigh-est energies is due to the interaction of the wisp electrons with the collima-tor of the spectrometer; the resulting low energy population has indeed been measured during calibration in the accelera-tor, when 200 keV electrons are sent to the detector (Moreau, 2006). The high-energy counterpart is due to event pile-up at the charge pre-amplifier. Note that in Fig. 1a, the same effect is seen although less marked for the event at 14:31–14:32 UT, while this event according to Anagnostopoulos et al. (2011) is not associated with an earthquake.
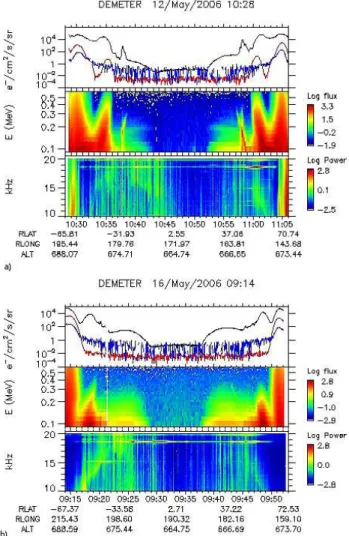
Furthermore, the intensification of VLF activity seen be-tween 10:32 and 10:45 UT in Fig. 4a (and bebe-tween 09:17 and 09:25 in Fig. 4b) has been studied as in the case presented in Fig. 1b. The burst data once again clearly show that whistlers associated with atmospheric lightnings are at the root of the VLF observations.
As stated in Sideropoulos et al. (2011), Fig. 4b shows no electron burst around 09:25 UT. At NWC, the sunset is at 17:50 LT, which corresponds to 09:50 UT. Further-more, accounting for the drift time of 100 keV electrons be-tween NWC and the satellite location adds a delay of about 1 h. Electrons should have thus left the NWC location at 08:25 UT, i.e., 16:25 LT, i.e., during daylight. At 16:25 LT, NWC is still in the day and the waves are strongly attenuated by the ionosphere (Cohen and Inan, 2012). It is thus expected that no clear electron structure resulting from wave-particle interaction can be detected. Later, when the spacecraft reach the conjugate hemisphere, a very weak structure can be seen in Fig. 4b around 09:43 UT in the energy–time electron spec-trogram for energies of about 300 keV. The transmitter is now in penumbra and a weak part of the wave power escapes the ionosphere and interacts with electrons.
Fig. 4. (a)Electron and wave (see Fig. 1) measurements on 12 May 2006 between 10:26 and 11:06 UT. Conjugate electron wisps are de-tected around 10:38 and 10:58 UT.(b)Same as(a)for 16 May 2006. This figure must be compared with Figs. 3 and 4 of Sideropoulos et al. (2011).
precipitation activity ceases a few hours before a great earth-quake”, as stated in Sideropoulos et al. (2011).
3 NWC off
Sideropoulos et al. (2011) also studied electron burst when the NWC transmitter is off. They presented a case (their Fig. 3) obtained on 18 September 2006 where two electron bursts are detected.
Figure 5 gives the Demeter measurements during that pe-riod in the same format as in Figs. 1a, b and 4a, b. A slightly dispersed electron structure is clearly seen at low energies around 13:14–13:15 UT. A conjugate enhancement in elec-tron fluxes is seen at the lowest energies around 12:53– 12:54 UT. Such electron flux enhancements are quite com-mon during the period when NWC was off, i.e., between
Fig. 5.Same format as Figs. 1 and 4, for 18 September 2007 be-tween 12:46 and 13:22 UT, when NWC was off.
1 July 2007 and 22 January 2008. Before claiming an earth-quake cause for such measurements, one has to check if these bursts can be produced from the interaction of electrons with other VLF transmitters.
The geographic distribution of the VLF transmitter is given in Figs. 6, 7 and 8. Figure 6 displays the power distri-bution measured at Demeter altitude between 15 and 25 kHz (see Parrot et al., 2009). In Fig. 6 the black lines indicate the L=2 contours in the Northern and Southern hemispheres. In the US sector, four main transmitters are operating: NPM at very low latitude, and NLK, NML and NAA atL values somewhat higher than 2. The emitted waves can be seen in the Southern Hemisphere aroundL=2. It means that if elec-trons resonate with these transmitters, the energy-dispersed structures should be detected at anLvalue of the order of 2. In Europe three main transmitters are detected: GQD in UK, HWU in France and DHO in Germany; in the south hemi-sphere, the corresponding waves are detected southward of South Africa aroundL=2. In the Asian sector three trans-mitters are detected, in the Southern Hemisphere NWC at L=1.4 and NTS atLslightly higher than 2. In the Northern Hemisphere: UBE atLequal to 2 is confused with the con-jugate waves of NTS. Except for NWC, all the transmitters were operating during the period when the data presented in Fig. 5 were obtained.
NDT 22.20 32.08 130.83
DHO 23.40 53.08 07.61
NAA 24.00 44.65 −67.29
NLK 24.80 48.20 −121.92
TBB 26.70 37.43 26.70
JJY-40 40.00 37.37 140.85
NAU 40.80 40.80 −67.18
NSC 45.90 38.00 13.50
NML 46.37 46.36 −98.34
WWVB 60.00 40.56 −105.07 JJY-60 60.00 33.46 130.17
Fig. 6. Average distribution of electric power in the 15–25 kHz range measured during night passes during 3 yr (2007–2009). The corresponding transmitters are indicated by their international code. The two black lines indicate theL=2 contours in the Northern and the Southern hemispheres.
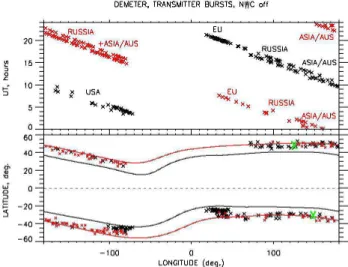
The result of a search for dispersed electron structure dur-ing a three-month period from July to September 2007, when NWC was off, is presented in Fig. 9. The upper panel shows the distribution of the electron bursts in a UT–longitude dia-gram. As expected from the sun-synchronous orbit of Deme-ter, the bursts are found along straight lines resulting from the rotation of the Earth below the satellite. UT is always UT = 10-long/15 and UT = 22-long/15. Red symbols are for measurements made near 10:00 LT and black ones for mea-surements made near 22:00 LT. The black (red) double traces correspond to nightside (dayside) passes of the spacecraft crossing first a northern structure and about one hour later the
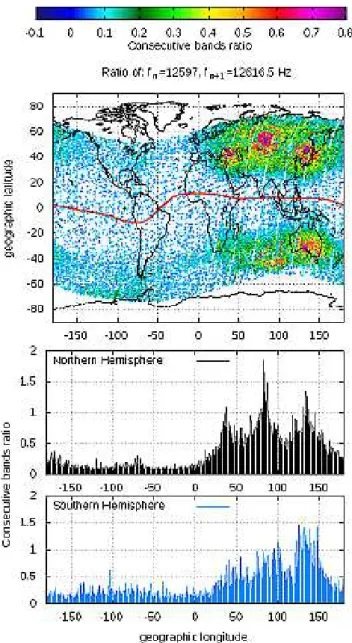
Fig. 7.Top panel: position of the three Russian transmitters emit-ting in the Northern Hemisphere at 11.8, 12.8 and 14.8 kHz. Mid-dle panel: consecutive frequency band ratio for the Northern Hemi-sphere. Bottom panel: same for the Southern HemiHemi-sphere.
conjugate structure in the Southern Hemisphere, after flying over the dayside (nightside) part of the Earth. Single traces correspond to structures with no conjugate. The structures are thus well organized in a UT–longitude space, indicating a probably geographic origin. The bottom panel of Fig. 9 gives the latitude–longitude distribution, with superposed curves giving theL=2 andL=1.5 locations in the Northern and Southern hemispheres. The structures are mainly grouped alongL=2, with two notable exceptions: in the US sector at longitudes from−100 to−70◦and in the South African
sec-tor at longitudes between 10 and 40◦, where they are located
Fig. 8. Average distribution of electric power in the 25–60 kHz range measured during night passes during 3 yr. The correspond-ing transmitters are indicated by their international code. The two black lines indicate theL=1.5 contours in the Northern and the Southern hemispheres.
Let us suppose that each structure is resulting from the interaction of electrons with VLF waves emitted by human transmitters. For the waves to reach the magnetosphere, the station must be in darkness or at the beginning of the day, in order for the electron density in the D-region of the iono-sphere not to be high enough to prevent the escape of VLF power inside the magnetosphere (Cohen and Inan, 2012). Taking this into account it becomes simple to find the ori-gin of the structures. Their oriori-gins are indicated in the upper panel of Fig. 9. US stand for United States, EU for Europe. Russia and Asia are also indicated. There are no structures recorded over the Atlantic; this comes from the fact that there the electrons drifting from the other part of the Earth are pre-cipitating, due to the lowering of their mirror point in the Southern Hemisphere.
It is also remarkable that nightside passes over Europe do not show electron structures, while in the conjugate region there are a number of recorded electron structures. We at-tribute this to the weak field in the South African sector, located on the eastern side of the South Atlantic Anomaly, where electrons resonating with the waves emitted by the Eu-ropean transmitter can be detected in the low B-field region at the satellite altitude. To illustrate this interpretation, we show in Fig. 10 a pass over South Africa where three succes-sive electron bursts are recorded. The most probable causes of the two structures at the highestLshells are the French FUG and Turkish TBB transmitters, respectively emitting at 22.67 and 21.75 kHz, while the Italian NSC station causes the electron wisp, at lowerLshell. Note in Fig. 10 that there is a similar effect at a longitude of about−100◦, where the
elec-trons emitted by the low-latitude NAU transmitter are only detected in the Southern Hemisphere, at the western border of the South Atlantic Anomaly.
Finally, Fig. 9 clearly shows that the location of the elec-tron bursts (green symbols) detected as an earthquake precur-sor by Sideropoulos et al. (2011) are exactly superposed on the traces of electron bursts due to the cyclotron resonance of electrons with VLF transmitters.
Fig. 9. UT–longitude (top) and latitude–longitude distribution of electron burst during the three months (July–August, September 2007) when the NWC transmitter is off. The red symbols indicate measurements made around 10:00 local time, while the black sym-bols are for 22:00 local time. The red and black curves in the bot-tom panel show respectively theL=2 andL=1.5 locations in the Northern and Southern hemispheres. The green crosses correspond to the measurement of electron bursts presented in Sideropoulos et al. (2011) as due to a precursor to an earthquake. The regions where the bursts are produced are indicated in the top panel.
Fig. 10.Multiple electron wisps resulting from the cyclotron in-teraction of human VLF with electrons from the inner belt. Com-puted energy dispersions of electrons resonating with monochro-matic waves emitted at 45 900, 26 400 and 21 750 Hz are shown by the white curves.
4 Discussion and conclusion
models, are indeed seen at all longitudes, except at those cor-responding to the South Atlantic Anomaly.
A careful examination of the cases presented in Sideropou-los et al. (2011) as earthquake precursors thus indicate that all bursts containing wisp structure are consistent with be-ing caused by ground transmitters. Furthermore, VLF inten-sifications observed over large regions with a power much lower than that of the NWC transmitter appear to be due to lightnings. Note also that electron bursts at low energies (E <200 keV) without wisps have been registered in asso-ciation with whistler waves generated by lightnings (Inan et al., 2007; Gemelos et al., 2009).
The results presented here shed some doubt on earthquake studies performed with the Demeter data without explor-ing the possibility that electron bursts could be linked with VLF transmitters (Anagnostopoulos, 2011; Sideropoulos et al., 2011; Zhang et al., 2010, 2013). Furthermore, the fact that VLF transmitters are nearly continuous from many lo-cations, whereas large earthquakes occur only occasionally, places a heavy burden of justification on any interpretation of electron bursts favoring earthquakes.
Supplementary material related to this article is available online at
http://www.nat-hazards-earth-syst-sci.net/14/1/2014/ nhess-14-1-2014-supplement.pdf.
Acknowledgements. The authors thank the referees for helpful
sug-gestions and comments on the dispersed nature of electron bursts. Data display software has been provided by Emmanuel Penou (http://clweb.cesr.fr/).
Edited by: F. Masci
Reviewed by: R. Selesnick and Y. Chen
The publication of this article is financed by CNRS-INSU.
Thomson, N. R., Stewart, S. L., Mccormick, R. J., Parrot, M., and Berthelier, J.-J.: Radiation belt electron precipitation by man-made VLF transmissions, J. Geophys. Res., 113, A10211, doi:10.1029/2008JA013369, 2008.
Gemelos, E. S., Inan, U. S., Walt, M., Parrot, M. and Sauvaud, J.-A.: Seasonal dependence of energetic electron precipitation, Ev-idence for a global role of lightning, Geophys. Res. Lett., 36, L21107, doi:10.1029/2009GL040396, 2009.
Koons, H. C., Edgar, B. C., and Vampola, A. L.: Precipitation of inner zone electrons by whistle-mode waves from VLF transmit-ters UMS and NWC, J. Geophys. Res., 86, 640–648, 1981. Li, X., Yugian, M., Wang, P., Wang, H., Lu, H., Zhang, X., Huang,
J., Shi, F., Yu, X., Xu, Y., Meng, X., Wang, H., Zhao, X., and Parrot, M.: Study of the North West Cape electron belts ob-served by DEMETER satellite, J. Geophys. Res., 117, A04201, doi:10.1029/2011JA017121, 2012.
Moreau, T.: Etude numérique et développement de spectromètres embarquables de particules chargées, Ph.D. Thesis, University Paul Sabatier, Toulouse, 2003.
Parrot, M., Inan, U. S., Lehtinen, N. G., and Pinçon, J. L. Pen-etration of lightning MF signals to the upper ionosphere over VLF ground-based transmitters, J. Geophys. Res., 114, A12318, doi:10.1029/2009JA014598, 2009.
Parrot, M., Sauvaud, J. A., Soula, S., Pinçon, J. L., and Velde, O.: Ionospheric density perturbations recorded by DEMETER above intense thunderstorms, J. Geophys. Res., 118, 5169–5176, doi:10.1002/jgra.50460, 2013.
Piša, D., N˘emec, F., Santolik, O., Parrot, M., and Rycroft M.: Additional attenuation of natural VLF electromagnetic waves observed by the DEMETER spacecraft resulting from pre-seismic activity, J. Geophys. Res.-Space, 118, 5286–5295, doi:10.1002/jgra.50469, 2013.
Sauvaud, J. A., Moreau, T., Maggiolo, R., Treilhou, J.-P., Jacquey, C., Cros, A., Coutelier, J.-J., Rouzaud, J., Penou, E., and Gan-gloff : M., High-energy electron detection onboard DEMETER: The IDP spectrometer, description and first results on the inner belt, Planet. Space. Sci., 54, 502–511, 2006.
during geomagnetic storms, J. Geophys. Res., 118, 1723–1736, doi:10.1002/jgra.50125, 2013.
Selesnick, R. S., Albert, J. M., and Starks, M. J.: Influ-ence of ground-based VLF radio transmitter on the in-ner electron radiation belt, J. Geophys. Res., 118, 628–635, doi:10.1002/jgra.50095, 2013.
Sidiropoulos, N. F., Anagnostopoulos, G., and Rigas, V.: Compara-tive study on earthquake and ground based transmitter induced radiation belt electron precipitation at middle latitudes, Nat. Hazards Earth Syst. Sci., 11, 1901–1913, doi:10.5194/nhess-11-1901-2011, 2011.
Zhang, X., Fidani, C., Huang, J., Shen, X., Zeren, Z., and Qian, J.: Burst increases of precipitating electrons recorded by the DEME-TER satellite before strong earthquakes, Nat. Hazards Earth Syst. Sci., 13, 197-209, doi:10.5194/nhess-13-197-2013, 2013. Zhang, Z., Li, X., Wu, S., Ma, Y., Shen, X., Chen, H., Wang, P., You,