©2014 Science Publication
doi:10.3844/ajassp.2014.381.390 Published Online 11 (3) 2014 (http://www.thescipub.com/ajas.toc)
Corresponding Author: Lombardi Mara, “Sapienza” University of Rome, Safety Engineering, Italy
THE MANAGEMENT OF UNCERTAINTY:
MODEL FOR EVALUATION OF HUMAN
ERROR PROBABILITY IN RAILWAY SYSTEM
Lombardi Mara, Guarascio Massimo and Rossi Giuliano
“Sapienza” University of Rome, Safety Engineering, Italy
Received 2013-10-02; Revised 2013-10-16; Accepted 2013-12-30
ABSTRACT
The methodology of quantitative risk assessment in use in the railway industry refers the RAMS approach, as expected in EN 50126, to define the failure of the system. From the probability of failure follows the evaluation of the failure consequence, the check of the accident occurrence and finally, the analysis of the achievable accident scenarios to quantify the damage as result thereof. In this approach, the central concept is the failure phenomenon, i.e., the deviation of the proper performance of a function by a system component. The case-study is referred to the maintenance procedure, necessary to ensure safe use of the railway infrastructure. The homogeneous treatment of human behaviour in the proposed risk model involves the definition of the function of reliability (or failure) of “human component” since the maintenance procedure of railway system shows a high probability of human error. The paper analyzes a series of control checks for back analysis testing of accident occurrences and highlights the opportunity to perform quantitative risk analysis comparing alternative designs of railway system by analogical analysis methods. In this analysis the evaluation of human error according to combined techniques of risk analysis and Ishikawa’s theory is relevant because in the railway industry organized procedures of good practice usually have been employed.
Keywords: Contextual Control Model (CoCoM), Quantitative Risk Analysis (QRA), Reliability, Availability, Maintainability and Safety (RAMS), Comparative Assessment, Uncertainty Management, Safety Integrity Level (SIL), Human Reliability Analysis (HRA)
1. INTRODUCTION
Functional reliability or safety, in case of failure, are fundamental performance requirements of engineering system. The reliability and safety analysis are aimed, respectively, to provide methods for assessing whether a component or a system will be operative for duration (or occasion) in which the user requires it and otherwise, if the failure will constitute hazard to people or material assets.
The maintenance procedure, necessary to ensure the usability and safety of the railway infrastructure, shows particular risk factors. To these the need to carry out together the work and the movement of train is added.
Although it may involve the interruption of the movement on the rail track affected by the work, the neighbouring rail track is operating.
The rules on the protection of the maintenance work clearly define the safety requirements, taken to prevent an interference between the event “transit of the train” and “occupation of the rail track by the operator”, which would result in the accident. However, the procedures and regulations are not sufficient to control the human behaviour.
The interference of events can be due to several factors:
• Diversion of support guard, in the case of protection system of sighting
• Stroke of support guard or worker • Lack of respect for rules and procedures
Maintenance workers perform well known procedures: The extreme habit determines the undervaluation of risks and safety procedures. Whenever a worker fails a procedure without consequence, loses the ability to comply safety requirements.
2. SAFETY AND HUMAN FACTOR
The homogeneous treatment of human behaviour in the risk model involves the definition of the function of reliability or failure.
The consolidated techniques of Human Reliability Analysis consider the human factor as part of the process, producing two types of errors:
• Analytical model: Difficulty of numbering the possible behaviours in a limited and representative group of events
• Theoretical model: Loss of relationships between the individual worker and the work environment, consisting of tools, equipments, colleagues, but also individual and common meanings
Frequently the best procedure of control and safety does not ensure the standard of expected performance if one has not guaranteed the effectiveness. Typical deficit is the loss of control of the working procedure. It is not only predictive of major disasters but also of serious accidents.
The cold management provides: The activities are defined, the functions are planned, the roles are assigned. The working procedure is often coded and described with reference to engineering good practice.
The hot management provides: The execution in the field is carried in a procedure compliant but always different: The phenomenon is due to accidents, inexperience, minor errors. Sometimes the working procedure takes place so radically different from what was planned. Often the workers, which implement a dangerous degraded procedure, are well aware of this.
In the construction industry (the most important working sector with the highest injury rate per worker) the cluster analysis and multivariate analysis show degraded procedures of work.
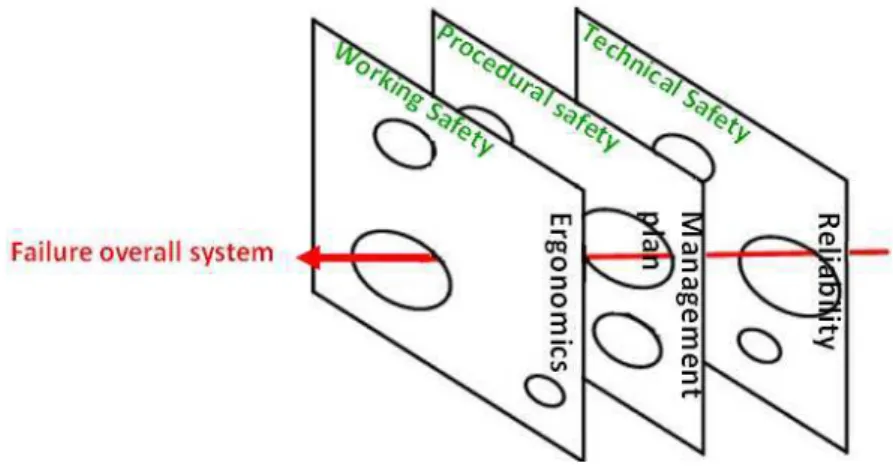
According to know Reason’s Swiss cheese model, therefore, it is possible to define not random deficit and therefore more properly failures of safety systems (Fig. 1).
3. SYSTEM SAFETY ANALYSIS (SSA)
The algebra of graphs, as approach to the study and management of complex systems, is justified by the effectiveness of link between decision-making structures and time variables.
The graphic solution can be useful for the study of the system, in order to make:
• Analysis “ex-post”, aimed at identifying the causes that have created a given phenomenon or problem • Analysis “ex-ante”, aimed at identifying the
conditions that may lead to the achievement of certain goals
The idea at the base of graph, which represents the procedure of the railway infrastructure maintenance, is to use basic connections to produce representations of complex system.
The model can describe:
• The logic interaction of relevant variables • The elements of the system sensitive to the action • The scenarios that originate from alternative
hypotheses of evolution of the initial state
The proposed approach fits well into the framework of analytical techniques commonly used in technical approach.
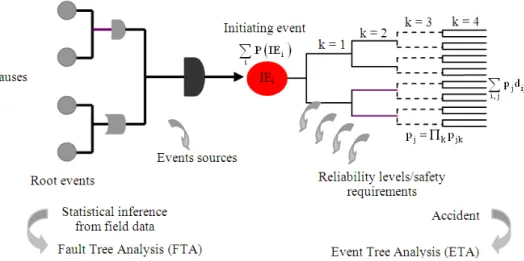
The convergent use of reliability techniques Reliability, Availability, Maintainability and Safety (RAMS) and advanced analysis of Human Factor (HF) (Dhillon, 2011), included in the model of risk analysis structured according to the rules of graphic algebra (Fig. 2), allows to represent all configurations that can be assumed by the system, all the undesirable outcomes due to degradation or deviations by the expected result and all resulting accident scenarios.
Defined R the configuration of a working system (i.e., that meet the needs of purpose under specified conditions (the specified conditions are the safety working conditions)) and R* the failure condition, S the safety configuration (which does not express negative effects to persons or property exposed (properly the safety refers to the state in which the risk (i.e., the probability of damage to persons or property) is lower than a acceptability threshold)) and S* the risk condition, the analysis of the system safety level consists of:
• Reliability assessment, aims to evaluate the probability of the R configuration PR (and
therefore of its complement Pf = 1-PR), operating
according to RAMS approach with reference to the reliability of technological components or HRA approach with reference to the reliability of human behavior
• Qualitative/quantitative risk assessment, aims to evaluate the results of R* configurations, considering the conditions of the fault development towards S and S* states, through the qualification or quantification of the final scenarios in terms of probability of occurrence and consequential damages, according to Quantitative Risk Analysis (QRA)
The algebraic solution of the risk analysis consists of sequential steps of increasing complexity: The characteristic variables are random variables.
The RAMS approach offers a set of consolidated procedures resulting from the qualitative and quantitative analysis (Fig. 3). The assessment involves the identification of the Safety Integrity Level (SIL) of the subsystem.
The implementation of the procedures requires the evaluation of the elementary components reliability and the realization of algebraic overall model that, starting from the single performance, evaluates the effect of the local-level system failure.
Whereas the RAMS attribution on the elementary components has a linearly increasing burden of analysis when the number of components increases, the logic flow explaining the system complexity increases exponentially: This results in a significant operational difficulties in the evaluation of SIL with reference in complex technological systems, ground-devices and board-ground-devices.
These evaluations require the analysis to discriminate between failure and accident, usually solved by the FMEA/FMEA HazOp procedures, from which a finite set of major accidents is obtained.
Finally there is the need to manage the uncertainty of the accident scenarios models selected, that should be, with parametric approach, the groups of achievable scenarios, each of which is characterized by a number of significant parameters, numerable in the real field.
The issue is to define a representative set of analysis scenarios numerable, finite and limited (able to summarize the set of achievable scenarios, each of which is characterized by an order of infinity).
Furthermore, the evaluations are often based on specific simulations or analogical reconstructions when there are no reliable data inferred from the real cases.
This analytical construction gives a quantitative indicator that cannot be reproduced through alternative approaches, because of the variability of the model definition.
The compliance of the analytical process does not solve the issue of the estimating random indicators.
Fig. 2. P( IEi) = Probability of the ith IEi pj = Probability of the jth hazard scenario pjk = Reliability of the kth safety requirement
Fig. 3. Reliability and Safety flow chart
4. GRAPHICAL SYNTAX
CHARACTERIZATION: RAILWAY
MAINTENANCE PROCEDURE
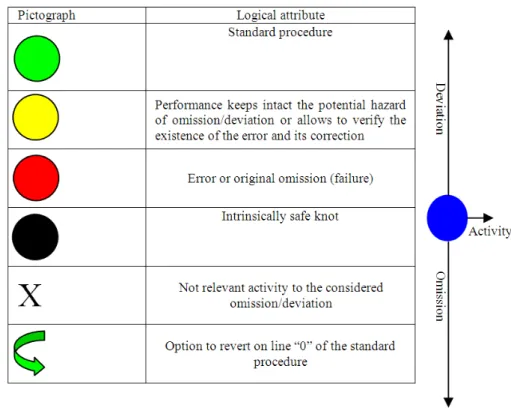
The diagram is divided into two half-spaces: At the top have been identified, for each elementary activity of railway infrastructure maintenance (EASHW, 2010), the consequences of a possible deviation (with respect to the standard procedure defined in accordance with regulations, best practices and
common sense rules-green knot in the graph) on the follow-up actions, which will be diverted.
In lower half-space was instead taken the omission of single elementary activity. Even in this case have been evaluated the consequences of the omission on subsequent activities, potentially affected by error.
will not produce the necessary inputs to the conclusion of a subsequent activity, which will emphasize the lack allowing the worker to adjust it.
For example, the primary activity “Defining the requirements of the workers” will be a fail-safe knot for the omission of the previous activity of “Selection of required equipment”: If you do not define what are the necessary equipments to carry out procedures, when should be defined the requirements of the workers you will highlights the omission, allowing the correction. In the graphical representation, it was decided to draw the intrinsically safe knots with a black dot.
When a deviation or omission occurs, subsequent elementary activity may not be affected by the failure of the previous activity. For example, if an error occurs in the “definition of the technical offices”, the next activity of “identification of human resources” is not affected by the itself error: The two activities are independent. This state has been graphically transposed using the symbol “X”.
Finally, a primary deviation or omission (red knot in the graph) can have an impact on one or more subsequent activities, leading to two alternatives:
• Existence of error, allowing the correction and then going back on line “0” of the correct procedure
• Execution of fallacious activity, that maintains the potential hazard of omission or deviation, propagating to subsequent steps of procedure
For example, the “the failure of lead time” affects the activity of “interference management”; if this second activity of the procedure is successful, shows the primary omission. However is not assured that this is done (as demonstrated by the analysis of really occurred accidents) and the error could spread to the following activities. This negative effect of subsequent steps has been graphically transposed using a yellow dot.
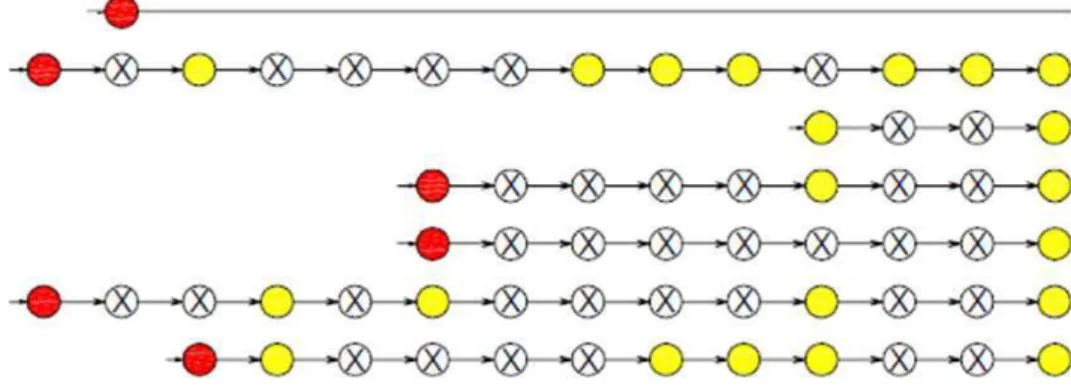
The procedural and graphical syntax is shown in Fig. 4. The overview of the procedure, qualified only in omissions half-space (Fig. 5 and 6), shows the exponential complexity of the graph.
The attribution of transition probability can be obtained by literature data in the case of simple activities, that are isolated, or by performance characteristics of technological sub-systems, where there is a technical function.
The choice of the probability of failure is main for diverted activity, that is non-isolated, i.e., true degradations, represented by dotted red line that connects all deviations/omissions.
Fig. 5. Structure of the OMISSIONS half-space-Ishikawa’s diagram: Degraded procedure in the Ishikawa’s diagram
Fig. 7. Exploded Ishikawa’s diagram-accident occurrence in railway maintenance procedure
In any event, the degradation is a mode of procedure which is not randomly generated: The errors follow one another according to a distorted implementation of working procedure. The assessment of the probability of occurrence is referred to each working activity.
The analysis of predictors of organizational discomfort (minor injuries, occupational diseases and predictors of work-related stress) measures the probability of the degraded working procedure and then the loss of importance of safety procedures.
For this purpose it is appropriate to adopt an integrated approach for the quantification through consistent and representative indicators, that measure the level of safety by a complex system, composed by technological, organizational and human resources.
The purpose of the analysis is the risk management of typical run over accident, by examining the interference between ordinary operating management and construction activities: The final part of the graphical diagram has been schematized according to the logic of event tree, in order to define the probability of occurrence of incidental scenarios whereas the rail track overall occupancy conditioned by the transit of the train.
The exploded diagram that includes all possible omissions and deviations was recreated in the event of railway maintenance procedure (Fig. 7).
5. COGNITIVE RELIABILITY AND
ERROR ANALYSIS METHOD (CREAM):
TRANSITION PROBABILITIES OF THE
PROCEDURAL STATES
The maintenance procedure shows a high probability of human error because of human factors and variability of the working site, which is characterized by uncontrolled risk factors, i.e., noise, lighting and
environment conditions. Workers have also restricted concept of the work and although receive adequate training, they commit “violation errors”.
The scenario of a procedure determines the degree of cognitive control on to be performed action, which in turn will determine the probability of Human Error (HEP) (Ying-Jie et al., 2010).
The model includes the assumption that the conditions of work are most important that the activity itself.
The cognitive model used in the CREAM is the Contextual Control Model (“CoCoM”) (Sun et al., 2012) which considers separately the connection of cognitive functions (“competence”) and the cognitive processes that produce the evolution (“control”).
This model includes four levels of control:
• Strategic: Represents the top-level of control, the worker can “strategically” decide about the different options
• Tactical: The human performance follows a certain rule or procedure
• Opportunistic: The most relevant features of the working site determine the following activity. Often the result is insufficient
• Scrambled: The choice of the following activity is irrational or random. The cognitive level is very low and one acts according to a logic “trial-and-error” to the extreme condition of “zero control”
Initially the “Common Performance Conditions” (CPC) for overall performance are defined.
Nine factors represent the possible imposed constraints by the quality of the work site:
• Adequacy of working support
• Availability of procedures and operational planning
• Concurrent work goals • Available time • Time of day
• Appropriate training and accrued experience • Partnership of working group
Each of these “Common Performance Conditions” (CPC) is associated with an aim that qualifies the main effect on the probability of failure: positive effect will decrease the HEP, negative effect will increase it. Some CPC however depend on others: The model includes the used synergism by the secondary CPC and the resulting change on the primary CPC.
The outcome of the evaluation allows to associate to each component knot of the maintenance procedure, probability of failure on the range of values defined by Hollnagel in the description of the procedure for the development of the method (Groth and Mosleh, 2011).
The choice of the cognitive model “CoCoM” is justified by the special attention that the model imposes on environmental variables and the operating environment.
The suggested range by Hollnagel varies, depending on the mode of evaluated control: Given the uncertainty of the probability of human behaviour failure, this is the expected result.
6. RESULTS
Probability values, resulting from the application of the model “CoCoM”, were normalized according to a qualitative approach (likelihood of omission or deviation): Each considered event, that is represent in the Ishikawa’s diagram, was evaluated according to a range of probability (Table 1) and dependence on the previous knots (Sun et al., 2011).
The centred value has been associated with mean value of probability, the extreme values of the range were associated with “low” and “high” probability. The evaluation for halfway point was obtained by interpolating the extreme values with the mean values.
The variables for the Event Tree Analysis are:
V1: Protection System;
V2: Safety distance from the adjacent rail track; V3: Working procedure according to briefing; V4: Compliance to technical rules;
V5: Empty rail track according to procedure;
V6: Train in transit; V7: Collision accident.
The event tree on the working procedure “maintenance on partial-protection of working site” represents all the possible combinations between these seven variables according to the target of work, the protection of the site and the stopped working before the transit of the train.
The variables V1 and V2 have been considered independent. The variables V3, V4 and V5 have been considered dependent on the assumed value by the variables V1 and V2 according to a no standardized law, which considers an attribution knot to knot.
The variable V6 has been considered the main indicator of the danger flow, dependent on the variables V1, V3, V4 and V5. The dangerous transit, complementary to failure, is characterized by a probability of occurrence equal to:
Vi i
IP p(t _ p)
3
=
∑
(1)The variable V7, finally, was considered dependent on variable V2.
The following tableshows the result of the event tree knot of level V6. The hazard index takes values on a logarithmic scale (from the maximum value equal to 1 to the minimum value equal to 10−4)
In the Table 2 are shown the values of IP allocated to the events of the variables V1, V3, V4, V5.
The variable V6 equals 1 in the case of maintenance procedure in compliance with the regulations about the safety distance from operating rail track.
The variable V7, finally, was considered dependent on variable V2.
The following Table 3 shows the result of the event tree analysis. The probability of hazardous and/or dangerous scenarios was evaluated by Equation (1).
The evaluation shows that:
• The proposed procedure of event tree analysis has happened in safety conditions in 99.8% of cases • In 0.2% of cases a transit under unsafe conditions
without consequences occurs: The failure of protective measures in working procedures without, however, injury for exposed workers
Table 1. Probability depending on the control model of likelihood
Low Medium-low Medium Medium-high High Opportunistic 1×10⁻² 1,33×10⁻¹ 2,55×10⁻¹ 3,8×10⁻¹ 5×10⁻¹ Tactical 2,55×10⁻³ 2,55×10⁻² 5×10⁻² 7,5×10⁻² 1×10⁻¹
Table 2. Hazard Index
Events V1 V3-V4 V5 1 1×10⁻⁴ 1×10⁻⁴ 1×10⁻⁴
2 1×10⁻² 1×10⁻³ 1×10⁻² 3 1×10⁻¹ 1 1×10⁻³
4 1 1×10⁻² 1
Table 3. Probability of hazardous and/or dangerous scenarios (Safety distance from the adjacent rail track)
P (safe transit) 9,976E-01 P (hazardous transit without collision accident) 2,360E-03 P (dangerous transit with collision accident) 2,680E-06
Table 4. Probability of hazardous and/or dangerous scenarios (V2 is not considered)
P (safe transit) 9,973E-01 P (hazardous transit without collision accident) 2,410E-03 P (dangerous transit with collision accident) 2,680E-04
The following Table 4 shows the results obtained using the same event tree for the evaluation of the case of maintenance of active rail track, thus the variable V2 (Safety distance from the adjacent rail track) was not considered. The probability of hazardous and/or dangerous scenarios was evaluated by Equation (1).
The result is representative of the case of railway maintenance activity used until December 31 2011 (now no longer allowed as result of the Decree October 2010 Italian Authority Railway Safety). The probability of impact for work occasions seems to reproduce accurately the accident rate recorded in Italian Railway System in the years 2005-2011, with about an accident registered on the average per year, compared with work occasions approximately equal to 103 maintenance works.
7. DISCUSSION
The explorative analysis has been applied on a limited sample of incidents/accidents that occurred at trains or workers involved in maintenance activities through the application of multiple correspondences analysis. This activity showed a comforting context on the proposed models, which turn out to be applicable to the analysis of Ishikawa’s chains derived from investigations of accidents.
Referring to the final considerations (both in terms of validated innovative hypotheses and in terms of testing of consolidated models) the research showed that:
• The graphs’ theory is the best logical structure to formalize the procedures organized in phases numerable and predictable, as is the analyzed case of standardized working procedures in the railway system • The multiple correspondence analysis shows the
existence of repeating failure patterns of safety procedures, confirming Reason’s theory
• The indicators related to procedural failure suggest a considerable stability, that supports the hypothesis of redundancy of procedures for railway safety: The redundancy, however, shows a tendency to failure when the activities are conducted in accordance with procedural mode modified to good practice compared to the theoretically predicted mode • The indicators related to the failure of the workers in
the context of the specific maintenance procedure suggests a random failure without dragging effect: The analysis has shown the existence of a reliable assets of professional skill of maintenance workers
Thus the study, although implicitly due to unavailability of failure, accident and injury data, suggests that:
• The graphs’ syntax is applicable to the present case study
• It is possible to represent the space of events of accident/incident that can be involved in the case of railway maintenance activities
• The integration between the Ishikawa’s model and Event Tree Analysis is possible and effective • Referred to the maintenance procedures the accident
rate derived from Ishikawa’s model integrated with Event Tree Analysis well approximates the rate derived from analysis of available accidents. In this sense, the analysis may be considered predictive
8. CONCLUSION
any working procedure. This method can, especially when applied to less complex procedures, make a complete analysis of the procedure scenarios and it is particularly useful for the check of accuracy of the working procedure in the working management.
Further it is possible, in the periodic final word, to verify the reproducibility of deviations, failures and omissions for individual working unit, in order to improve the reliability of the expected performance, operating on the relevant variables.
The Event Tree Analysis, adopted for the representation of the complete graph with reference to the steps of working procedure of maintenance (considering the transit of the train, which is the flow of danger, as an external event), allows to verify the hypothesis of dependence of some variables. The decisive event, assessed on the hypothesis of maintenance activity on partial traffic stop and protection of the working site on sighting of the train in transit, measure with good accuracy the rate of accidents.
The cognitive model “CoCoM” not allows to estimate human error rate significantly more stable than the traditional methods based on human reliability; However, the method is relevant because, when specifically applied and supported by expert judgment and external comparisons, can direct towards logical choices of Human Reliability Error to be verified on the basis of consolidated experience. The goal is to find a competent model of calibration and check of developed hypotheses, making explicit the expert judgment.
The uncertainties inherent in evaluation of specific Human Reliability Error can be reduced with a research approach integrated between engineers experts in the process of organization and psychologists experts in the human behaviour.
The future implementation of research involves:
• The evaluation of the applicability of the Ishikawa’s diagram to larger samples of injuries
• The application of the Ishikawa’s diagram to more complex work procedures which are not rigidly organized
9. REFERENCES
Dhillon, B.S., 2011. Human Error in Rail and Road Transportation Systems. In: Transportation Systems Reliability and Safety, Dhillon, B.S. (Ed.), CRC Press, ISBN-10: 1439846413, pp: 161-172.
EASHW, 2010. Maintenance and occupational safety and health: A statistical picture. European Agency for Safety and Health at Work.
Groth, K.M. and A. Mosleh, 2011. Deriving causal Bayesian networks from human reliability analysis data: A methodology and example model. J.
Risk Reliab., 226: 361-379. DOI:
10.1177/1748006X11428107
Sun, R., Y. Chen, X. Liu, T. Peng and L. Liu, 2011. A method of analysis integrating HCR and ETA modeling for determining risks associated with inadequate flight separation events. J. Aviat.
Technol. Eng., 1: 19-27. DOI:
10.5703/1288284314632
Sun, Z., Z. Li, E. Gong and H. Xie, 2012. Estimating human error probability using a modified CREAM. Reliab. Eng. Syst. Safety, 100: 28-32. DOI: 10.1016/j.ress.2011.12.017