Risk communication with pictographs: The role of numeracy and
graph processing
Rebecca Hess
∗Vivianne H. M. Visschers
†Michael Siegrist
†Abstract
We conducted three studies to investigate how well pictographs communicate medical screening information to per-sons with higher and lower numeracy skills. In Study 1, we conducted a 2 (probability level: higher vs. lower) x 2 (reference information: yes vs. no) x 2 (subjective numeracy: higher vs. lower) between-subjects design. Persons with higher numeracy skills were influenced by probability level but not by reference information. Persons with lower nu-meracy tended to differentiate between a higher and a lower probability when there was no reference information. Study 2 consisted of interviews about the mental processing of pictographs. Higher numeracy was associated with counting the icons and relying on numbers depicted in the graph. Study 3 was an experiment with the same design as in Study 1, but, rather than using reference information, we varied the sequence of task type (counting first vs. non-counting first) to explore the role of the focus on numerical information. Persons with lower numeracy differentiated between higher and lower risk only when they were in the non-counting first condition. Task sequence did not influence the risk perceptions of persons with higher numeracy. In sum, our results suggest that pictographs may be useful for persons with higher and lower numeracy. However, these groups seem to process the graph differently. Persons with higher numeracy rely more on the numerical information depicted in the graph, whereas persons with lower numeracy seem to be confused when they are guided towards these numbers.
Keywords: pictographs, numeracy, reference information, risk perception, risk communication.
1
Introduction
Patients are often confronted with difficult medical deci-sions. Many of these decisions have to be made based on numerical information (e.g., information about chances and risks of treatments, see Lipkus, Peters, Kimmick et al., 2010). Therefore, it is quite important that this infor-mation is understood correctly. Past research has shown that many people have difficulties understanding numeri-cal risk information (Gigerenzer & Edwards, 2003; Viss-chers, Meertens, Passchier et al., 2009), and that persons with low numeracy skills (the ability to understand num-bers) are especially challenged by numerical information (Lipkus & Peters, 2009; Peters, 2008). Therefore, not surprisingly, more and more studies show that low nu-meracy is associated with less understanding of medical information and unfavorable decision outcomes (see e.g., Donelle, Arocha, & Hoffman-Goetz, 2008; Schwartz, Woloshin, Black et al., 1997; Tanius, Wood, Hanoch et al., 2009; Zikmund-Fisher, Ubel, Smith et al., 2008).
Some of the data reported here were presented at the SRA-Europe Conference 2010 (London, June 2010). This work was partially sup-ported by the EC Contract No LSHB-CT-2004–5053243 (NoE SAFE).
∗ETH Zurich, Institute of Environmental Decisions (IED),
Con-sumer Behavior, Universitaetstrasse 22, 8092 Zurich, Switzerland. E-mail: [email protected].
†Consumer Behavior, Institute of Environmental Decisions (IED),
ETH Zurich
Different solutions have been proposed for improving the communication of medical information. Some au-thors suggest, for example, that numbers should be ex-pressed as frequencies (Gigerenzer & Edwards, 2003; Hoffrage, Lindsey, Hertwig et al., 2000) or, especially for persons with low numeracy, conveyed in graphs (Apter, Paasche-Orlow, Remillard et al., 2008; Nelson, Reyna, Fagerlin et al., 2008). One special type of graph com-bines these two recommendations for risk communica-tion because the graph a) shows frequency informacommunica-tion, and b) conveys numbers in a purely graphical way. These so-called pictographs show the number of people affected by a certain medical condition in a larger group of people (i.e., the denominator of mostly 100 or 1000, see Figure 1; for other examples of this type of graph, see also Ed-wards, Elwyn, & Mulley, 2002; Paling, 2003; Schapira, Nattinger, & McHorney, 2001). Therefore, this type of graph seems to be a promising tool for communicating medical information to persons with low numeracy.
Several studies show that pictographs help people with low numeracy understand medical information (Galesic, Garcia-Retamero, & Gigerenzer, 2009; Haw-ley, Zikmund-Fisher, Ubel et al., 2008; Zikmund-Fisher, Fagerlin, & Ubel, 2008). However, although pictographs seem to improve low-numerates’ direct understanding of the presented numbers (e.g., knowledge of how many persons are affected by a certain disease), it is not yet
clear how this graph influences low-numerates’ risk per-ception. The influence of pictographs on risk perception, however, may be crucial because perceiving a risk as ei-ther high or low might have a greater impact on behav-ioral intentions than understanding the numerical infor-mation alone (Zikmund-Fisher, Fagerlin, Keeton, et al., 2007).
Generally, pictographs seem to evoke lower risk per-ceptions than other presentation formats such as the Pal-ing perspective scale (PalPal-ing, 2003) or numerical fre-quencies (Galesic et al., 2009; Keller & Siegrist, 2009; Siegrist, Orlow, & Keller, 2008). Unfortunately, it is not possible to decide whether a reported risk perception is the “correct” one, because it is subjective in nature. To handle this difficulty, one can conduct an experiment to investigate whether different levels of probabilities evoke different levels of perceived risk (Keller & Siegrist, 2009; Siegrist et al., 2008). In this approach, participants are faced with either a higher or lower probability, and then estimate their perceived risk. We then analyze the ex-tent to which participants confronted with the higher risk perceive the risk as higher than participants confronted with the lower risk. Results of two previous studies fol-lowing this procedure using pictographs showed that a higher probability did not evoke a higher level of per-ceived risk than a lower probability (Keller & Siegrist, 2009; Siegrist et al., 2008). This result might suggest that, although some studies showed that pictographs seem to help persons with low numeracy to understand the num-bers depicted in a graph, pictographs may not help them to evolve clearly distinguishable risk perceptions to the same degree. Thus, the type of task used in a study may influence the evaluation of pictographs. The role of nu-meracy in this perception process is, to our knowledge, not yet fully understood. We therefore conducted three studies to examine the influence of numeracy on people’s perceptions and, as a new approach to this question, on people’s processing of numerical medical information de-picted in pictographs. To examine this issue, we chose the context of cancer screening test results, as some stud-ies have shown that numeracy is important in this area (Donelle et al, 2008; Hanoch, Miron-Shatz, & Himmel-stein, 2010; Schwartz et al., 1997).
Numeracy is defined as a person’s ability to understand and process numerical concepts (see e.g., Peters, 2008). It can be measured in two different ways. Objective measures assess people’s numeracy by letting them solve mathematical tasks (Lipkus, Samsa, & Rimer, 2001; Schwartz et al., 1997). One problem with using such objective measures in mail-in surveys is that the respon-dents might use helping devices such as calculators. This would then bias the resulting numeracy score. Further-more, respondents might find it annoying to fill in such questionnaires and, thus, might simply avoid them when
they have the opportunity to do so (Fagerlin, Zikmund-Fisher, Ubel et al., 2007). To cope with this problem, Fagerlin and colleagues (2007) developed the subjective numeracy scale, which assesses self-reported numeracy skills. This measure offers the advantage of shorter ad-ministration and less reluctance from participants than objective measures (Fagerlin et al., 2007). On the other hand, this measure relies entirely on self-reported numer-ical ability and preference. Moreover, although it is posi-tively correlated with objective numeracy (Fagerlin et al., 2007), it does not measure exactly the same construct as the direct measurement of mathematical skills in objec-tive numeracy measures.
In short, the aim of our first study was to exam-ine the influence of subjective numeracy on the per-ception of cancer screening test results presented in pictographs. Following Siegrist and Keller’s approach (Keller & Siegrist, 2009; Siegrist et al., 2008), we con-ducted an experiment to examine whether different levels of probabilities evoke different levels of perceived risk. To reach a deeper understanding into how pictographs might influence risk perception in relation to numeracy, we conducted a second study. We thereby directly exam-ined the processing of cancer screening results depicted in pictographs and its association with numeracy. Fi-nally, in Study 3, we explored the role of the sequence of the task (numerical understanding first vs. risk percep-tion first) in the context of risk communicapercep-tion with pic-tographs and numeracy. With this manifold procedure, we aim to broaden the existing knowledge about numer-acy in medical decisions by investigating the role of nu-meracy in risk perception. We aim to accomplish this by revealing the underlying process that might lead to differ-ences between persons with higher and lower numeracy.
2
Study 1
First, the size of the denominator of a pictograph may influence risk perception and understanding of the in-formation in the graph (Galesic et al., 2009; Zikmund-Fisher, Ubel, et al., 2008). Keller and Siegrist (2009) used rather low risks depicted in pictographs with large denominators (1 in 1000, 9 in 1000, 21 in 1000, 167 in 1000). In a focus group study about the perception of different formats of risk communication, participants preferred pictographs with small denominators to pic-tographs with large denominators because the partici-pants found the pictographs with small denominators eas-ier to interpret (Schapira et al., 2001). The denominator in Keller and Siegrist’s (2009) study may thus have been too large to efficiently depict such low risks because the large denominator of 1000 complicated the processing of the graphs. This might have made all of the risks seem equally low, even for persons with high numeracy. This mechanism could then have overshadowed a potentially beneficial effect of the pictographs. We therefore chose a smaller denominator in our study. More specifically, we aimed to investigate whether two levels of probability de-picted in a pictograph of 100 icons led to different risk perceptions. We hypothesized that persons confronted with a higher probability would report a higher risk per-ception than when confronted with a lower probability (Hypothesis 1). We expected a similar effect for persons with higher and lower numeracy.
Another factor that may influence the decision of whether a given probability is high or low may be the absence of additional information that puts a risk in a broader context (see Lipkus, 2007). In everyday life, comparing one’s own risks to those of others seems to be done automatically: when faced with test results in a medical context, people compare their personal test re-sults to what is communicated to them as the normal value (Adelsward & Sachs, 1996). In a study by Dillard and colleagues (2006), providing women with reference information in the form of higher risks of other women helped them to avoid overrating their own breast cancer risk. Furthermore, graphical or numerical reference risk information seemed to enable people to differentiate be-tween a higher and a lower risk (Siegrist et al., 2008). Thus, in Keller and Siegrist’s (2009) study, pictographs may have failed to convey the difference between higher and lower risk because of the lack of reference infor-mation. Adding reference information to the pictograph could therefore help to evoke a differentiating risk per-ception. Hence, we hypothesized that participants con-fronted with a higher probability would report higher risk perceptions compared with participants confronted with a lower probability when there is a second pictograph with reference information (Hypothesis 2). We expected to ob-serve the same effect for persons with higher and lower numeracy.
2.1
Method
2.1.1 Participants and procedure
Study 1 was an experiment that was part of a survey about health and nutritional information. The topic of the exper-iment reported here was different from the survey’s other content. Therefore, no carry-over effects were expected. The questionnaire was sent to a sample of households in the German-speaking part of Switzerland. The house-holds were randomly chosen from the Swiss telephone book. In total, 589 questionnaires were returned, which resulted in a response rate of 38%. Of these 589 ques-tionnaires, 56 were not completely filled in with regard to numeracy or the dependent variable of the experiment. Therefore, our analyses were based on the responses of 533 participants. Of the 533 participants, 296 (56%) were women; three persons did not specify their sex. Respon-dents were between 17 and 94 years old (M= 53.32 years,
SD= 15.69). In our sample, 42 persons (8%) had fin-ished primary or lower secondary school; 256 (48%), up-per secondary vocational school; 79 (15%), upup-per sec-ondary school; and 151 (28%), university/technical uni-versity. Five persons did not provide information about their educational level.
All respondents read the same hypothetical scenario about a woman (“Daniela”) who had a screening test for colorectal cancer. The doctor used a personalized picto-graph to inform her about the test results. This pictopicto-graph was shown in the questionnaire and consisted of an array of 100 icons (10x10) with grey and white icons, which represented the probability of Daniela having colon can-cer and the probability that she did not have cancan-cer, re-spectively (see Figure 1). At the end of the scenario, all participants estimated the risk of Daniela having cancer on a 6-point scale (1 = very low probability to 6 = very high probability). This part of the procedure was the same for all participants.
ver-Figure 1: Example for one of the conditions (lower prob-ability, reference information present) used in Study 1.
Please imagine the following hypothetical situation:
Daniela had a test at her general practitioner’s. This test identifies the probability of the presence of colon cancer. As soon as the test results are available, the doctor in-forms Daniela by means of the following figure that was prepared especially for her. The grey dots represent the probability that Daniela has colon cancer, the white dots the probability that Daniela does not have colon cancer.
Additionally, the doctor shows Daniela a figure that high-lights how high the average probability is for women in Daniela’s age group. The grey dots again represent the probability of the presence of colon cancer.
sions of the questionnaire, to which the participants were randomly assigned.
Because Study 1 was a mail-in survey, we could not directly control whether the respondents used calculators and filled in all questions. Therefore, we used the subjec-tive numeracy scale (SNS, Fagerlin et al., 2007) to mea-sure the participants’ numeracy. Another reason for
us-ing the SNS was that we assumed that more respondents would return the questionnaire with this scale than with an objective numeracy scale. The SNS is a self-reported measure of one’s ability to handle numbers, as well as one’s preference for numbers. The scale consists of 8 items (e.g., “How good are you at working with percent-ages?” “How often do you find numerical information to be useful?” assessed on 6-point scales) and results in an average numeracy score from 1 (low numeracy) to 6 (high numeracy).
2.1.2 Data analysis
To test whether probability level, reference information, and subjective numeracy influence risk perception, we utilized an analysis of variance (ANOVA). For ease of interpretation, we performed a median split on the sub-jective numeracy measure (higher vs. lower numeracy). However, as subjective numeracy is a continuous vari-able, we conducted an additional analysis of covariance (ANCOVA) with probability estimate as the dependent variable, the probability level and reference information as factors and subjective numeracy as a continuous co-variate. All statistical analyses were performed with SPSS version 17.0 (SPSS, Inc.).
2.2
Results
Mean subjective numeracy was 4.17 (SD= .87, scale 1– 6); the internal consistency of the SNS was good (8 items; Cronbach’s alpha = .82). We performed a median split on subjective numeracy (Mdn = 4.25), which resulted in a higher-numeracy group (n= 279) and a lower-numeracy group (n= 254).
The ANOVA showed that reference information did not play a significant role for risk perception, either as a main effect,F(1, 525) = .25,p= .62, or as an interaction effect with one or both of the other factors,Fs≤.89,ps
≥.35. We found significant main effects for probability level,F(1, 525) = 20.82,p< .001, as well as for subjec-tive numeracy,F(1, 525) = 4.66,p= .03, and a significant interaction effect for probability level x subjective numer-acy,F(1, 525) = 4.82,p= .03.
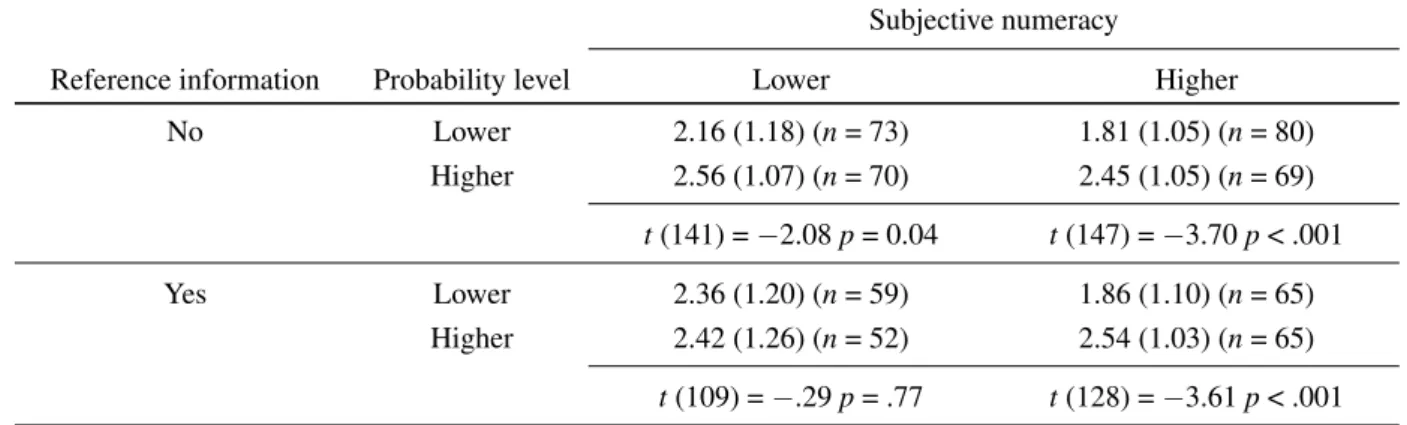
differ-Table 1: Means (SD) of the risk perceptions in the different conditions for persons with higher and lower subjective numeracy (Study 1).
Subjective numeracy
Reference information Probability level Lower Higher No Lower 2.16 (1.18) (n= 73) 1.81 (1.05) (n= 80)
Higher 2.56 (1.07) (n= 70) 2.45 (1.05) (n= 69)
t(141) =−2.08p= 0.04 t(147) =−3.70p< .001 Yes Lower 2.36 (1.20) (n= 59) 1.86 (1.10) (n= 65)
Higher 2.42 (1.26) (n= 52) 2.54 (1.03) (n= 65)
t(109) =−.29p= .77 t(128) =−3.61p< .001 Note: 6-point scale: 1 (very low) — 6 (very high).
entiate between higher and lower probabilities. However, when there was a reference information graph, persons with lower numeracy who had seen the lower risk did not have different risk perceptions than persons with lower numeracy who had seen the higher risk (see Table 1).
The ANCOVA showed a significant main effect for subjective numeracy,F(1, 525) = 4.06,p= .05, and a sig-nificant interaction effect of probability level x subjective numeracy on risk perception,F(1, 525) = 5.25,p= .02. All other effects, including the main effect for probability level, were not significant in the ANCOVA,Fs≤1.72,ps
≥.19. The interaction numeracy x probability level was thus significant in both analyses.
In sum, the analyses showed that persons with higher subjective numeracy differentiated between the two prob-ability levels, whereas persons with lower subjective nu-meracy did not, or at least not to the same degree. Adding reference information did not significantly influence the participants’ risk perceptions in the multivariate analy-ses. However, planned comparisons revealed a tendency for reference information to impede the ability of persons with lower numeracy to have different risk perceptions.
2.3
Discussion
The results of Study 1 suggest that persons with higher subjective numeracy perceived more risk when con-fronted with a higher probability than when concon-fronted with a lower probability. These results are partly in line with our first hypothesis. This contradicts the results of a previous study that suggest that pictographs neither influ-ence risk perception for persons with high numeracy nor for persons with low numeracy (Keller & Siegrist, 2009). This also seems to imply that pictographs can be use-ful for evoking a meaninguse-ful risk perception when some aspects of the pictograph are changed (probability level,
size of denominator).
Adding reference information, however, changed this picture in an interesting and rather surprising way. Per-sons with higher subjective numeracy differentiated be-tween the higher and the lower probability irrespective of the presence of reference information. For persons with lower subjective numeracy, on the other hand, reference information seemed to actually limit the perception of the difference between the higher and the lower probabili-ties. Our second hypothesis was thus not confirmed for the lower numeracy groups. On the contrary, our results seemed to suggest that pictographs that include reference information are not suitable for communication with per-sons with lower numeracy.
the idea that persons with higher numeracy pay more at-tention to the numerical information in pictographs than persons with lower numeracy, we conducted Study 2.
3
Study 2
We suggest that pictographs can be processed in differ-ent ways. Either one counts the icons and calculates how many persons are affected (focus on the numbers “be-hind” the graph), and/or one compares the marked icon area with the unmarked icon area (holistic processing of the graph). According to Peters’ (2008) model of nu-meracy and the comprehension and use of numeric risk information, persons with higher numeracy focus more on, and pay more attention to, numerical information than persons with lower numeracy. This implies that persons with higher numeracy may pay more attention to the ac-tual numbers “hidden behind the pictograph”, whereas persons with lower numeracy process the pictograph on a more holistic level. To test this idea, we analyzed in-terviews with laypeople about the processing of a pic-tograph (10x10 icons) in regard to counting the icons. We expected that higher numeracy would be related to a higher tendency to count the icons and to look for the actual numbers depicted in the graph.
3.1
Method
Study 2 consisted of face-to-face interviews with 52 per-sons from the general population. These interviews were conducted in the context of a larger study about the pro-cessing of various graphical risk communication formats. The participants were recruited from an earlier study in which they had been asked whether they would partic-ipate in this study. Fifty-two persons agreed to partici-pate (participation rate = 66%). Participation took about one hour (approximately 12 minutes of this hour were dedicated to the pictograph) and was financially compen-sated. Of the 52 participants, 16 (31%) were women. Respondents were between 22 and 73 years old (M = 52.25 years,SD= 13.95). Four (8%) had finished lower secondary school, 17 (33%) upper secondary vocational school, 6 (11%) upper secondary school, and 25 (48%) university/technical university.
The study took place in our test laboratory. All partic-ipants read a hypothetical scenario on a 15.4-inch com-puter screen about a man (“Hans”) who had a screen-ing test for lung cancer. As in Study 1, the test re-sult was communicated with a personalized pictograph (10x10 icons). The depicted probability for Hans having lung cancer was 14%, visualized as 14 marked icons in 100 (see Figure 2). All participants read the same sce-nario and looked at the same graph with the task to
es-Figure 2: Pictograph used in Study 2
timate the depicted probability level. After this, the ex-perimenter conducted an interview about the processing of the graph, particularly dealing with the question about whether the participant had counted the icons or not. The interviews were then transcribed and coded as either 1, meaning the icons were counted, or 0, meaning the icons were not counted (variable “counting”). Furthermore, we analyzed the transcripts in regard to whether the par-ticipants had spontaneously mentioned (i.e., without us asking for this information) the numbers depicted in the graph in the form of percentages or frequencies (coded as 1 “yes” or 0 “no”; variable “mentioning numbers”).
To measure numeracy, we applied the same subjective numeracy scale as in Study 1 (Fagerlin et al., 2007) and a short and modified version of the objective numeracy scale used by Lipkus and colleagues (2001). Because there had been ceiling effects when the original tasks were used in a Swiss sample (Keller & Siegrist, 2009), we made the tasks more difficult to achieve a more bal-anced distribution of scores.1 The scale we used
con-sisted of seven mathematical tasks, and resulted in a min-imum score of 0 and a maxmin-imum score of 7. Despite these changes, the distribution was negatively skewed. The mean subjective numeracy was 4.40 (SD= .74), and the mean objective numeracy was 5.44 (SD= 1.50). The in-ternal consistencies of both scales were acceptable, with Cronbach’s alpha = .81 (8 items) and .63 (7 items), re-spectively, and the two measures showed a significant positive correlation, r = .44, p = .001. All statistical
1For example, instead of asking, “If the chance of getting a disease
Table 2: Correlations of the coded processing variables with numeracy in Study 2.
Subjective numeracy
Objective numeracy Counting the icons .14 .34* Mentioning numbers .35* .11 Note: *p< .05
analyses were performed with SPSS version 17.0 (SPSS, Inc.).
3.2
Results
Thirty-four participants (65%) reported having counted the icons, and 14 (27%) reported that they had not counted the icons to estimate the probability. Four partic-ipants (8%) did not provide any or only unequivocal in-formation about having counted the icons or not. Thirty-one participants (60%) spontaneously mentiThirty-oned the de-picted numbers either as percentages or as frequencies, whereas 21 (40%) did not mention the exact numbers.
The correlations between these two variables and sub-jective/objective numeracy are shown in Table 2. As expected, numeracy was associated with counting the icons and mentioning the numbers depicted in the graph. However, counting the icons was only significantly as-sociated with objective numeracy, and mentioning the numbers was only significantly correlated with subjective numeracy. Subjective numeracy can be further broken down into ability and preference subscales (Fagerlin et al., 2007). Doing this showed that mentioning the num-bers was correlated with the ability scale (r= .44, p = .001), but not with the preference subscale (r= .15,p= .30). Neither the ability nor the preference subscale was significantly associated with counting the icons (rs≤.16,
ps≥.27).
3.3
Discussion
The results of Study 2 supported our hypothesis. We found that persons with higher objective numeracy counted the icons slightly more often than persons with lower objective numeracy, and persons with higher sub-jective numeracy were more likely to mention the num-bers depicted in the graph than persons with lower numer-acy. This finding is in line with previous research high-lighting that, overall, persons with higher numeracy focus more on numerical information and draw more meaning from these numbers than persons with lower numeracy (Peters, 2008). We assume that persons with lower nu-meracy may perceive the graph rather holistically (e.g.,
comparing the areas of the graph or judging the graph by a gut-feeling) because they pay much less attention to the numerical information than persons with higher numer-acy.
Further analyses of the subscales of subjective numer-acy showed that it was the self-reported ability and not the self-reported preference that was associated with the processing of the graph. Thus, it does not seem to be the liking of numbers that is related to the perception of the graph, but numeracy in the narrower sense, namely peo-ple’s mathematical skills.
In sum, Study 1 suggested that pictographs are useful for both persons with higher and lower subjective numer-acy. However, this effect seems to be more stable for persons with higher numeracy because they differentiated between the higher and the lower probability, irrespective of the presence of a reference information graph. Study 2 implied that persons with higher numeracy seem to con-centrate more on the numbers “behind the pictograph” than person with lower numeracy. Taken together, all of these results suggest that it may be useful to prompt per-sons with lower numeracy to count the icons of the picto-graph or to focus on the number depicted in the picto-graph to make the positive effect of pictographs also more stable for this group. To gain further insight into this relation-ship between processing pictographs and numeracy, we conducted Study 3.
4
Study 3
Prompting persons to count the icons of a pictograph may be effectively accomplished by carefully choosing the tasks that participants have to solve. On the one hand, a risk perception task, as we used in Study 1 (e.g., “how high is this probability?”), probably does not trigger a special type of processing. We therefore expect partici-pants to choose their default way of processing the picto-graph. Based on the results of Study 2, we assume that the default way of processing is focusing on numbers and counting the icons for persons with higher numeracy and perceiving the graph rather holistically for persons with lower numeracy. On the other hand, a numerical under-standing task, such as those used in previous studies (e.g., “how many people are affected?”), may trigger all partic-ipants to count the icons because the answer to this ques-tion is an explicit number (see Galesic et al., 2009; Haw-ley et al., 2008; Zikmund-Fisher, Fagerlin et al., 2008).
a higher probability depicted in a pictograph (i.e., repli-cation of the effect in Study 1; Hypothesis 1). Second, we expected that persons with lower numeracy who were triggered to count the icons would differentiate more strongly between a higher and a lower probability than persons with lower numeracy who had not been triggered to count the icons (Hypothesis 2). We did not expect this effect for persons with higher numeracy, because their de-fault way of processing the graph may be counting the icons. Therefore, we assumed that prompting to count the icons would have no further effect on this group of persons.
4.1
Method
4.1.1 Participants and procedure
An online questionnaire was sent to a panel of Swiss households and was answered by 601 persons. We ex-cluded eleven of the respondents because their data were incomplete in regard to risk perception or numeracy. Our analyses were thus based on the answers of 590 partic-ipants. Of these, 304 were women (52%). The partici-pants were between 18 and 69 years old (M= 38.69 years,
SD= 12.42). Thirty-two respondents (5%) had finished primary or lower secondary school; 248 (42%) upper sec-ondary vocational school; 142 (24%) upper secsec-ondary school; and 168 (29%), university/technical university.
We used the same scenario and the same graphs as in the no-reference conditions of Study 1 (upper part of Fig-ure 1). On the first screen, all respondents read the hy-pothetical text about “Daniela” who had been tested for colon cancer and who had the test results communicated to her by means of a 10x10-pictograph with grey and white icons representing Daniela’s probability of colon cancer. Three factors were used for a between-subjects design in this study. First, as in Study 1, the level of prob-ability participants saw on the screen was either lower (2 in 100) or higher (17 in 100). Following this procedure, we again examined whether the participants differenti-ated between the lower and higher probabilities in their risk perception. The second factor we manipulated was the order of the two tasks to test whether a task that trig-gers the counting of the icons influences how a risk is per-ceived. The two tasks were: a) a risk perception task with the question, “How high do you estimate the probability of Daniela having colon cancer?” and b) a numerical un-derstanding task with the question, “How many people similar to Daniela have cancer?”. The latter question was intended to trigger the counting of the icons. Half of the participants saw the risk perception task first and then, on a second screen, the numerical understanding task (the “non-counting first” condition). The other half saw the numerical understanding task first and then the risk
per-ception task (the “counting first” condition). This proce-dure resulted in four versions of the online questionnaire to which the participants were randomly assigned.
As a third factor, we took participants’ subjective nu-meracy into account, measured with the SNS (Fagerlin et al., 2007, see Study 1 for details about the scale). Using a median split, the respondents were again divided in two groups: a higher numeracy group and a lower numeracy group. Because this study was a self-administered online questionnaire, we did not measure objective numeracy for the same reasons as in Study 1, namely lack of control re-garding whether the participants used a calculator, and an increased percentage of drop-outs with objective numer-acy.
4.1.2 Data analysis
Again, we used the same analyses as in Study 1. For ease of interpretation, we performed a median split on subjec-tive numeracy and included these two numeracy groups (higher vs. lower), probability level (higher vs. lower) and task sequence (counting first condition vs. non-counting first condition) in an analysis of variance (ANOVA) with the probability measure from the risk perception task as the dependent variable. To test which of the cells were significantly different, we used independent t-tests. How-ever, as subjective numeracy is a continuous variable, we conducted an additional analysis of covariance (AN-COVA) with probability estimate as the dependent vari-able, the probability level and task sequence as factors and subjective numeracy as a continuous covariate. All statistical procedures were performed with SPSS version 18 (SPSS, IBM corp.).
4.2
Results
Mean subjective numeracy was 4.11 (SD= .90, scale 1– 6); the internal consistency of the SNS was good (8 items; Cronbach’s alpha = .83). We performed a median split on subjective numeracy (Mdn = 4.25), which resulted in a higher-numeracy group (n= 296) and a lower-numeracy group (n= 294).
The ANOVA showed significant main effects for task sequence,F(1, 582) = 9.08,p = .003, and for probabil-ity level,F(1, 582) = 40.16,p< .001. Furthermore, we found a significant 3-way interaction effect between nu-meracy, probability level, and task sequence,F(1, 582) = 5.53,p = .02. All other effects were non-significant,
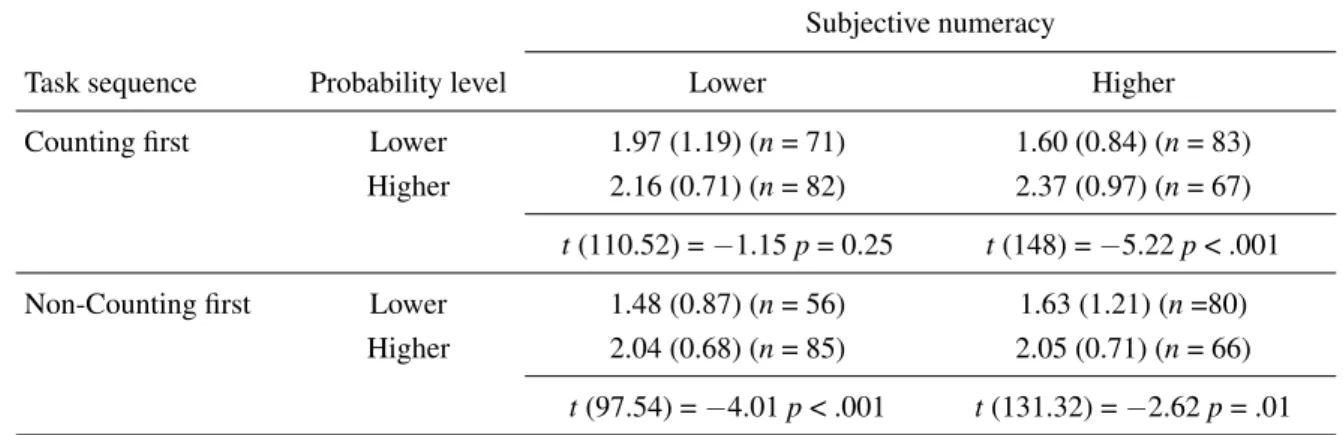
nu-Table 3: Means (SD) of risk perception in the different conditions for persons with higher and lower subjective numeracy (Study 3).
Subjective numeracy
Task sequence Probability level Lower Higher Counting first Lower 1.97 (1.19) (n= 71) 1.60 (0.84) (n= 83)
Higher 2.16 (0.71) (n= 82) 2.37 (0.97) (n= 67)
t(110.52) =−1.15p= 0.25 t(148) =−5.22p< .001 Non-Counting first Lower 1.48 (0.87) (n= 56) 1.63 (1.21) (n=80)
Higher 2.04 (0.68) (n= 85) 2.05 (0.71) (n= 66)
t(97.54) =−4.01p< .001 t(131.32) =−2.62p= .01 Note: 6-point scale: 1 (very low) — 6 (very high).
meracy, on the other hand, whether they had to solve the numerical understanding task first or the risk perception task affected their perceptions. Only persons with lower subjective numeracy who were in the non-counting first condition (risk perception task first) showed a significant difference between the risk perceptions of the two proba-bility levels. The risk perceptions of persons with lower numeracy in the counting first condition did not differ be-tween the lower and the higher probability level.
The ANCOVA confirmed the 3-way interaction effect between task sequence, risk level and subjective prob-ability, F(1, 582) = 4.77, p = .03. Furthermore, there was a significant 2-way interaction effect between task sequence and risk level, F(1, 582) = 4.52, p = .03. All other effects in the ANCOVA were non-significant, Fs
≤1.86,ps≤.17.
Furthermore, 257 of the 296 persons with higher nu-meracy (87%), and 217 of the 294 participants with lower numeracy (74%) gave the correct answer to the numerical understanding task (“2” or “17”). Significantly more per-sons with higher numeracy solved this task correctly than persons with lower numeracy,χ2(1,N= 590) = 15.82,p
< .001. Hence, this confirmed the assumption that people with higher numeracy are better able to solve numerical problems than those with lower numeracy.
To check whether the results of the ANOVA described above were influenced by whether the participants had correctly answered the numerical understanding task, we recalculated the analyses, this time only including partic-ipants who had given the correct answer. This procedure did not change the results: The main effects for task se-quence,F(1, 466) = 15.80,p< .001, and probability level,
F(1, 466) = 67.50,p< .001, remained significant, as well as the 3-way interaction effect,F(1, 466) = 8.78,p= .003. Overall, the analyses showed that task sequence was important for persons with lower numeracy to
differenti-ate between the higher and the lower probability. In the lower numeracy group, solving the risk perception task first seemed to result in different risk perceptions in line with the different probability levels, whereas when per-sons with lower numeracy had to solve the numerical un-derstanding first, they seemed to perceive the risks of the higher and lower probabilities as similar. Persons with higher subjective numeracy, on the other hand, differenti-ated between a higher and a lower probability irrespective of task sequence.
4.3
Discussion
in-formation numerically (e.g., knowledge about how many people are affected by a certain disease, Galesic et al., 2009; Hawley et al., 2008; Zikmund-Fisher, Fagerlin et al., 2008) but that the mechanism becomes more complex when it comes to evoking differentiating riskperceptions
(Keller & Siegrist, 2009). For persons with higher numer-acy, focusing on the numbers depicted in a graph seems to be intuitive and advantageous, whereas this procedure may be rather counter-intuitive and impeding for persons with lower numeracy.
5
General discussion
Researchers have recommended using graphical displays such as pictographs to improve communicating risk to persons with low numeracy (Apter et al., 2008; Nelson et al., 2008). Our results suggest that pictographs might be useful for persons with higher and lower numeracy—but for different reasons and under different conditions. To use pictographs for effective communication, it is help-ful to understand these reasons and conditions. Our re-sults imply that persons with higher numeracy may profit from this type of graph because they more often draw the exact numbers from it and turn these numbers into a subjective risk perception that enables them to differ-entiate between higher and lower levels risk. Thus, one could also provide this group with the numbers alone and the effect would probably be comparable. Persons with lower numeracy, on the other hand, seem to process this kind of graph differently. They seem to rely on a differ-ent type of information, and not on the numbers “hidden in the graph”. This is in line with Peters’ (2008) model of numeracy and the comprehension and use of numeric risk information. Even more, our results imply that guid-ing individuals with lower numeracy towards attendguid-ing to the numbers in the graph may even be counterproduc-tive and confusing for this group. All in all, our results suggest that pictographs for persons with lower numeracy should be as simple as possible to facilitate a processing of the graph that is relatively unaffected by numerical in-formation or calculations. Some additional verbal infor-mation about the meaning of the inforinfor-mation depicted in the pictograph, e.g., in the form of verbal labels, could also be useful for persons with lower numeracy to ease the understanding of this information (see Peters, Dieck-mann, Mertz et al., 2009). However, this should be done carefully because labeling numbers might influence a per-son’s behavioral intentions (Zikmund-Fisher et al., 2007). Overall, our studies provided rather clear indications of which information persons with lower numeracy do
notrely on when they look at pictographs: namely, the numbers. However, we could only assume which infor-mation theydorely on to build up their risk perceptions.
Based on the assumption that there are two basic ways of processing pictographs (focus on numbers and holistic processing), in Study 2, we suggested that persons with lower numeracy might perceive the graph rather holisti-cally. However, further studies are needed that explore the crucial parts of information that are used by persons with lower numeracy to build their risk perceptions.
Both Studies 1 and 3 showed differences between per-sons with higher and lower numeracy in the lower proba-bility condition, whereas the two groups gave rather simi-lar answers in the higher probability conditions. Our pro-cedure does not provide information about correct or in-correct answers because risk perception is subjective and, therefore, cannot be right or wrong. Thus, we cannot conclude from our results that persons with lower numer-acy understand small probabilities less than persons with higher numeracy. However, we can conclude that lower probabilities rather than higher probabilities seem to be processed and judged differently by persons with higher and lower numeracy. Further studies are needed to shed more light on this crucial aspect of communicating risk to persons with lower numeracy.
but not very highly. It is unclear whether we would have found the same results with an objective numeracy scale.
6
References
Adelsward, V., & Sachs, L. (1996). The meaning of 6.8: Numeracy and normality in health information talks.
Social Science and Medicine, 43, 1179–1187.
Apter, A. J., Paasche-Orlow, M. K., Remillard, J. T., Ben-nett, I. M., Ben-Joseph, E. P., Batista, R. M., Hyde, J., & Rudd, R. E. (2008). Numeracy and communica-tion with patients: They are counting on us.Journal of General Internal Medicine, 23, 2117–2124.
Dillard, A. J., McCaul, K. D., Kelso, P. D., & Klein, W. M. P. (2006). Resisting good news: Reactions to breast cancer risk communication. Health Communication, 19, 115–123.
Donelle, L., Arocha, J. F., & Hoffman-Goetz, L. (2008). Health literacy and numeracy: Key factors in cancer risk comprehension. Chronic Diseases in Canada, 29, 1–8.
Edwards, A., Elwyn, G., & Mulley, A. (2002). Explain-ing risks: TurnExplain-ing numerical data into meanExplain-ingful pic-tures.British Medical Journal, 324, 827–830.
Fagerlin, A., Zikmund-Fisher, B. J., Ubel, P. A., Jankovic, A., Derry, H. A., & Smith, D. M. (2007). Measuring numeracy without a math test: Develop-ment of the subjective numeracy scale. Medical De-cision Making, 27, 672–680.
Feldman-Stewart, D., Kocovski, N., McConnell, B. A., Brundage, M. D., & Mackillop, W. J. (2000). Per-ception of quantitative information for treatment deci-sions.Medical Decision Making, 20, 228–238. Galesic, M., Garcia-Retamero, R., & Gigerenzer, G.
(2009). Using icon arrays to communicate medical risks: Overcoming low numeracy.Health Psychology, 28, 210–216.
Gigerenzer, G., & Edwards, A. (2003). Simple tools for understanding risks: From innumeracy to insight.
British Medical Journal, 327, 741–744.
Hanoch, Y., Miron-Shatz, T., & Himmelstein, M. (2010). Genetic testing and risk interpretation: How do women understand lifetime risk results? Judgment and Deci-sion Making, 5, 116–123.
Hawley, S. T., Zikmund-Fisher, B., Ubel, P., Jancovic, A., Lucas, T., & Fagerlin, A. (2008). The impact of the format of graphical presentation on health-related knowledge and treatment choices. Patient Education and Counseling, 73, 448–455.
Hoffrage, U., Lindsey, S., Hertwig, R., & Gigerenzer, G. (2000). Medicine—Communicating statistical in-formation.Science, 290, 2261–2262.
Keller, C., & Siegrist, M. (2009). Effect of risk com-munication formats on risk perception depending on numeracy.Medical Decision Making, 29, 483–490. Lipkus, I. M. (2007). Numeric, verbal, and visual formats
of conveying health risks: Suggested best practices and future recommendations. Medical Decision Making, 27, 696–713.
Lipkus, I. M., & Peters, E. (2009). Understanding the role of numeracy in health: Proposed theoretical frame-work and practical insights.Health Education and Be-havior, 36, 1065–1081.
Lipkus, I. M., Peters, E., Kimmick, G., Liotcheva, V., & Marcom, P. (2010). Breast cancer patients’ treatment expectations after exposure to the decision aid program Adjuvant Online: The influence of numeracy.Medical Decision Making, 30, 464–473.
Lipkus, I. M., Samsa, G., & Rimer, B. K. (2001). Gen-eral performance on a numeracy scale among highly educated samples. Medical Decision Making, 21, 37– 44.
Nelson, W., Reyna, V. F., Fagerlin, A., Lipkus, I., & Peters, E. (2008). Clinical implications of numeracy: Theory and practice. Annals of Behavioral Medicine, 35, 261–274.
Paling, J. (2003). Strategies to help patients understand risks.British Medical Journal, 327, 745–748.
Peters, E. (2008). Numeracy and the perception and com-munication of risk. Annals of the New York Academy of Sciences, 1128, 1–7.
Peters, E., Dieckmann, N. F., Mertz, C. K., Vastfjall, D., Slovic, P., & Hibbard, J. H. (2009). Bringing meaning to numbers: The impact of evaluative categories on de-cisions.Journal of Experimental Psychology: Applied, 15, 213–227.
Schapira, M. M., Nattinger, A. B., & McHorney, C. A. (2001). Frequency or probability? A qualitative study of risk communication formats used in health care.
Medical Decision Making, 21, 459–467.
Schwartz, L. M., Woloshin, S., Black, W. C., & Welch, H. G. (1997). The role of numeracy in understanding the benefit of screening mammography.Annals of Internal Medicine, 127, 966–972.
Siegrist, M., Orlow, P., & Keller, C. (2008). The effect of graphical and numerical presentation of hypothetical prenatal diagnosis results on risk perception. Medical Decision Making, 28, 567–574.
SPSS, Inc./IBM corp., www.spss.com.
Tanius, B. E., Wood, S., Hanoch, Y., & Rice, T. (2009). Aging and choice: Applications to Medicare Part D.
Judgment and Decision Making, 4, 92–101.
Zikmund-Fisher, B. J., Fagerlin, A., Keeton, K., & Ubel, P. A. (2007). Does labeling prenatal screening test results as negative or positive affect a woman’s re-sponses? American Journal of Obstetrics and Gyne-cology, 197, 528e.1 - 528e.6.
Zikmund-Fisher, B. J., Fagerlin, A., & Ubel, P. A. (2008). Improving understanding of adjuvant therapy options by using simpler risk graphics. Cancer, 113, 3382– 3390.