ACPD
9, 17705–17751, 2009Fluorescent biological aerosol particle measured
with UV-APS
J. A. Huffman et al.
Title Page
Abstract Introduction
Conclusions References
Tables Figures
◭ ◮
◭ ◮
Back Close
Full Screen / Esc
Printer-friendly Version
Interactive Discussion
Atmos. Chem. Phys. Discuss., 9, 17705–17751, 2009 www.atmos-chem-phys-discuss.net/9/17705/2009/ © Author(s) 2009. This work is distributed under the Creative Commons Attribution 3.0 License.
Atmospheric Chemistry and Physics Discussions
This discussion paper is/has been under review for the journalAtmospheric Chemistry and Physics (ACP). Please refer to the corresponding final paper inACPif available.
Fluorescent biological aerosol particle
concentrations and size distributions
measured with an ultraviolet aerodynamic
particle sizer (UV-APS) in Central Europe
J. A. Huffman1, B. Treutlein1,*, and U. P ¨oschl1
1
Max Planck Institute for Chemistry, Biogeochemistry Department, Becherweg 27, 55128 Mainz, Germany
*
now at: Ludwig Maximilians University, Institute for Physical Chemistry, Munich, Germany
Received: 24 July 2009 – Accepted: 13 August 2009 – Published: 28 August 2009
Correspondence to: U. P ¨oschl (poeschl@mpch-mainz.mpg.de)
ACPD
9, 17705–17751, 2009Fluorescent biological aerosol particle measured
with UV-APS
J. A. Huffman et al.
Title Page
Abstract Introduction
Conclusions References
Tables Figures
◭ ◮
◭ ◮
Back Close
Full Screen / Esc
Printer-friendly Version
Interactive Discussion
Abstract
Primary biological aerosol particles (PBAPs), including bacteria, spores and pollen, are essential for the spread of organisms and disease in the biosphere, and numer-ous studies have suggested that they may be important for atmospheric processes, including the formation of clouds and precipitation. The atmospheric abundance and 5
size distribution of PBAPs, however, are largely unknown. At a semi-urban site in Mainz, Germany, we used an ultraviolet aerodynamic particle sizer (UV-APS) to mea-sure fluorescent biological aerosol particles (FBAPs), which can be regarded as viable bioaerosol particles representing a lower limit for the actual abundance of PBAPs. Flu-orescence of non-biological aerosol components are likely to influence the measure-10
ment results obtained for fine particles (<1 µm), but not for coarse particles (1–20 µm). Averaged over the four-month measurement period (August–December 2006), the mean number concentration of coarse FBAPs was∼3×10⁻²cm−3, corresponding to
∼4% of total coarse particle number. The mean mass concentration of FBAPs was ∼1 µg m−3, corresponding to ∼20% of total coarse particle mass. The FBAP number
15
size distributions exhibited alternating patterns with peaks at various diameters. A pro-nounced peak at ∼3 µm was essentially always observed and can be described by the following campaign-average lognormal fit parameters: geometric mean diameter 3.2 µm, geometric standard deviation 1.3, number concentration 1.6×10⁻²cm−3. This peak is likely due to fungal spores or agglomerated bacteria, and it exhibited a pro-20
nounced diel cycle with maximum intensity during early/mid-morning. FBAP peaks around ∼1.5 µm, ∼5 µm, and ∼13 µm were also observed, but less pronounced and less frequent. These may be explained by single bacterial cells, larger fungal spores, and pollen grains, respectively.
The observed number concentrations and characteristic sizes of FBAPs are con-25
ACPD
9, 17705–17751, 2009Fluorescent biological aerosol particle measured
with UV-APS
J. A. Huffman et al.
Title Page
Abstract Introduction
Conclusions References
Tables Figures
◭ ◮
◭ ◮
Back Close
Full Screen / Esc
Printer-friendly Version
Interactive Discussion
distribution patterns, and a persistent bioaerosol peak at∼3 µm. The measurement re-sults confirm that PBAPs account for a substantial proportion of coarse aerosol particle number and mass in continental boundary layer air. Moreover, they suggest that the number concentration of viable bioparticles is dominated by fungal spores or agglom-erated bacteria with aerodynamic diameters around 3 µm rather than single bacterial 5
cells with diameters around 1 µm.
1 Introduction
Biogenic aerosols are ubiquitous in the Earth’s atmosphere and they play important roles in atmospheric chemical and physical processes, climate, biological systems, and public health (Cox and Wathes, 1995; P ¨oschl, 2005; Jaenicke et al., 2007). Pri-10
mary biological aerosol particles (PBAPs) are pieces of biological material emitted or suspended directly from the biosphere to the atmosphere. The main types and char-acteristic size ranges of PBAP are viruses (0.01–0.3 µm), bacteria (0.1–10 µm), fungal and fern spores (1–30 µm), plant pollen (10–100 µm), and fragments of animal and plant matter (e.g. Gregory, 1978; Simoneit and Mazurek, 1982; Matthias-Maser and 15
Jaenicke, 1995; Jones and Harrison, 2004; Jaenicke, 2005; Elbert et al., 2007; Bauer et al., 2008). PBAPs can play an important role in public health by affecting aller-gies (Linskens and Cresti, 2000; Franze et al., 2005) and spreading disease to hu-mans and crops, both naturally and as agents of terrorism (e.g. Lacey and Dutkiewicz, 1994; Brown and Hovmoller, 2002; Ho and Duncan, 2005). Many organisms rely on 20
bioaerosols for the distribution and transfer of genetic material for reproductive pur-poses, as in the cases of plant pollen and fungal spores, which can also undergo transport over long distances (Elbert et al., 2007, and referencse therein). PBAPs may also influence climate and the hydrological cycle by initiating the formation of clouds and precipitation as cloud condensation and ice nuclei (Dingle, 1966; Schnell and Vali, 25
ACPD
9, 17705–17751, 2009Fluorescent biological aerosol particle measured
with UV-APS
J. A. Huffman et al.
Title Page
Abstract Introduction
Conclusions References
Tables Figures
◭ ◮
◭ ◮
Back Close
Full Screen / Esc
Printer-friendly Version
Interactive Discussion
2008; Rosenfeld et al., 2008; Ariya et al., 2009; Bowers et al., 2009; Pratt et al., 2009; Prenni et al., 2009).
Recent studies have found significant concentrations of DNA (ng m−3) and a wide range of bacteria and fungal spores in fine and coarse particulate matter from urban, rural, and high-alpine air (Despres et al., 2007; Fr ¨olich-Nowoisky et al., 2009). For trop-5
ical rainforest regions where both physicochemical processes in the atmosphere and biological activity at the Earth’s surface are particularly intense, Elbert et al. (2007) re-ported that fungal spores account for large fractions of coarse particle mass concentra-tions (∼30%) and estimated global emission rates of the order of 50 Tg a−1. Jaenicke et al. (2007) summarize measurements covering a variety of geographical locations 10
and particle size ranges showing that 15–74% of the total aerosol number as being PBAPs including∼20% in the semi-urban setting in Mainz, Germany (Matthias-Maser and Jaenicke, 1995; Kenny and Jennings, 1998; Gruber et al., 1999; Graham et al., 2003; Wiedinmyer et al., 2009). Continuous measurements of PBAP data have been limited, however, and so actual abundances, properties, as well as the origin of PBAPs 15
and their components are still poorly quantified and understood. Recent model stud-ies and literature reviews highlight the need for more measurement data to constrain regional and global emissions, transport, and abundance of PBAPs in the atmosphere (Burrows et al., 2009a, b; Heald and Spracklen, 2009).
In the past, most PBAP measurements were based on off-line techniques with low 20
time resolution (hours/days). Recently, the application of ultraviolet fluorescence to online aerosol analysis has allowed the detection of PBAPs in real-time, with time res-olution of minutes or less (Hairston et al., 1997; Kaye et al., 2005; Gabey et al., 2009). The ultraviolet aerodynamic particle sizer (UV-APS), also known as fluorescent APS (FLAPS), was first developed to quickly detect bioaerosols as possible agents of ter-25
ACPD
9, 17705–17751, 2009Fluorescent biological aerosol particle measured
with UV-APS
J. A. Huffman et al.
Title Page
Abstract Introduction
Conclusions References
Tables Figures
◭ ◮
◭ ◮
Back Close
Full Screen / Esc
Printer-friendly Version
Interactive Discussion
detection of fluorescence under these conditions indicates the presence of viable bi-ological material in the aerosol particles (Eng et al., 1989; Kell et al., 1991; Li et al., 1991; Hairston et al., 1997). Ho et al. (2002) showed that fluorescence signals from atmospheric aerosols are dominated by PBAPs, and there are no indications that inor-ganic materials contribute to aerosol fluorescence at the wavelengths used. Non-viable 5
organic material such as nutrient broth and peptone water can also exhibit fluores-cence in the operating wavelengths (Agranovski et al., 2003b). These substances are not likely to occur in the atmosphere, however, and if so they would most likely be of biological origin (albeit not viable) and thus qualify as components of PBAPs. Envi-ronmental stress has been found to reduce the fluorescence of biological organisms, 10
and the fluorescence signals of NAD(P)H can be influenced by binding to proteins (Hu-ber et al., 2000; Agranovski et al., 2003a). Further investigation will be required to achieve full understanding of the response of the UV-APS to different types of biogenic aerosol particles and to quantify potential interferences with non-biogenic particles and particle components (e.g. soot and polycyclic aromatic compounds, PAHs) that also 15
display fluorescence. As discussed below, such interferences may indeed influence the measurement results obtained for fine aerosol particles (<1 µm). Nevertheless, all available information suggests that coarse fluorescent particles (>1 µm) measured by the UV-APS can be regarded as “fluorescent biological aerosol particles” (FBAP) or viable bioparticles, respectively, and that their abundance represents a lower limit for 20
the actual abundance of primary biological aerosol particles.
Previous work has characterized the UV-APS in the laboratory with respect to aerosols containing marker biological molecules (Agranovski et al., 2004b; Agranovski and Ristovski, 2005), and also with respect to real-time measurement of bacteria (Brosseau et al., 2000; Agranovski et al., 2003a, b) and fungal spores (Kanaani et 25
ACPD
9, 17705–17751, 2009Fluorescent biological aerosol particle measured
with UV-APS
J. A. Huffman et al.
Title Page
Abstract Introduction
Conclusions References
Tables Figures
◭ ◮
◭ ◮
Back Close
Full Screen / Esc
Printer-friendly Version
Interactive Discussion
Kim et al., 2007), waste treatment plants (Lavoie et al., 2006; Nikaeen et al., 2009) and in various indoor environments (Burge, 1990; Moschandreas et al., 1996; Law et al., 2001). Recently, first fluorescence measurements of bioparticles have been reported for tropical rainforest air (Gabey et al., 2009).
In this study we have applied a UV-APS for the detection and sizing of FBAPs in ur-5
ban and rural continental aerosols over a four-month period from 3 August–4 December 2006. To our knowledge, this represents the first multi-month ambient measurement study involving an instrument for real-time bioaerosol detection using fluorescence and also the first in a semi-urban environment.
2 Methods
10
2.1 UV-APS operating principles and conditions
An ultraviolet aerodynamic particle sizer (UV-APS; TSI Inc. Model 3314, St. Paul, MN) was utilized for this study following standard, manual-advised procedures. Aerody-namic particle sizing in the diameter range (Da) of 0.54–19.81 µm (geometric mid-point diameter) is performed in the instrument by measuring the time of flight between two 15
red (633 nm) He-Ne lasers. Fluorescence of aerosol particles in the wavelength range of 420–575 nm is measured after excitation by a third ultraviolet laser at 355 nm. The particle counting efficiency of the instrument drops below unity atDa<0.7 µm (counting efficiency∼0.5 at 0.54 µm). Thus, concentration values reported for particles<0.7 µm should be considered as lower limit values. The instrument manufacturer specifies 20
the upper size limit of the UV-APS at 15 µm. Upon manufacturer calibration, however, polystyrene latex spheres (PSL, Duke Scientific) up to 20 µm, were properly sized by the UV-APS, though possibly with lower efficiency. As a result, particles detected be-tween 15–20 µm are included in our analyses, but the reported concentration values should again be considered as lower limit values. Aerosol sampling was performed 25
ACPD
9, 17705–17751, 2009Fluorescent biological aerosol particle measured
with UV-APS
J. A. Huffman et al.
Title Page
Abstract Introduction
Conclusions References
Tables Figures
◭ ◮
◭ ◮
Back Close
Full Screen / Esc
Printer-friendly Version
Interactive Discussion
the instrument, the total flow was split into an inner sample flow of 1.0±0.1 Lpm pass-ing through the nozzle and optical measurement cell and a sheath flow of 4.0±0.1 Lpm (pressure difference feedback control). The flow rates were regularly checked with external flow meters (TSI Inc. Model 4140 Thermal Mass Flowmeter and Sensidyne Gilibrator-2). The inner and total volumetric flow rates stayed generally within the range 5
of 1.0–1.1 Lpm and 4.9–5.0 Lpm, respectively. In the course of long term operation, a “Check Flow” signal on the instrument occasionally indicated that the actual flow rates exceeded the specified range. In such instances, the inner flow was found to have in-creased up to∼1.25 Lpm, while the total flow remained in the range 4.9–5.0 Lpm. The desired flow rates were re-established by cleaning the APS nozzle with compressed 10
air.
The instrument was controlled and the measurement data were recorded with an external computer connected via RS-232 ports using the manufacturer’s Aerosol In-strument Manager software (TSI AIM). Measurements were initiated every 5 min and integrated over a sample length of 299 s. Aerodynamic diameter, side scatter intensity, 15
and fluorescence intensity were measured for every detected particle, and results of every 5 min measurement bin were stored in individual sample data files (TSI *.A12 file format). The format and processing of the measurement data is described be-low. Five-minute sample measurements were continuously repeated over a period of four months from 3 August to 4 December, 2006 (122 days, 34 270 data points) and 20
only briefly interrupted for maintenance procedures (usually less than 30 min per week for flow check and nozzle cleaning as detailed in the instrument manual). The local time (LT) used for data analysis and plotting refers to Central European Summer Time (CEST) from the beginning of the reported measurements in August until 29 October and thereafter to Central European Time (CET). All times reported here are listed as LT. 25
2.2 Measurement location and sampling
eastward-ACPD
9, 17705–17751, 2009Fluorescent biological aerosol particle measured
with UV-APS
J. A. Huffman et al.
Title Page
Abstract Introduction
Conclusions References
Tables Figures
◭ ◮
◭ ◮
Back Close
Full Screen / Esc
Printer-friendly Version
Interactive Discussion
facing location), which is located on the campus of the Johannes Gutenberg University in Mainz, Germany (49◦59′31.07′′N, 8◦14′14.64′′E; 100 m a. s. l.). Towards the north and east, the university campus is surrounded by the city of Mainz and adjacent urban areas in the Rhine-Main metropolitan region. Towards the south and west, the univer-sity campus is surrounded by farm, grass, and forested land with small villages and 5
towns in a rural region extending over several hundred kilometres. Thus, air masses advected to the sampling locating during this study can be considered as typical central European mixtures of air from a metropolitan area and from a rural background region. Inside the laboratory, the UV-APS instrument was placed next to a window, through which ambient air was sampled using electrically-conductive silicon rubber tubing 10
(length 1.6 m, inner diameter 12 mm, sample flow residence time 2 s). Flow through the tube was considered laminar at all times, and so diffusion losses are considered negligible for all sampled particle sizes. From the instrument inlet on top of the UV-APS the sampling tube was smoothly bent through the window to minimize particle losses due to impaction (curvature radius∼1 m), where it terminated facing down and outward 15
(∼45◦), about 30 cm off the wall. It is possible that the sampled air masses were in-fluenced by dynamics involving the building structure, though no evidence of this was observed. Additionally, the sampling efficiency of large particles may have been influ-enced at the sampling tube inlet (especially at high wind velocities). Nevertheless, the frequent observation of large particles (up to 20 µm in diameter) and the variability and 20
consistency of the measurement data presented and discussed below confirm that the measurement results are not governed by the sampling conditions but characteristic for different types of ambient air advected to the measurement location.
2.3 Data processing
2.3.1 Data files and format 25
loga-ACPD
9, 17705–17751, 2009Fluorescent biological aerosol particle measured
with UV-APS
J. A. Huffman et al.
Title Page
Abstract Introduction
Conclusions References
Tables Figures
◭ ◮
◭ ◮
Back Close
Full Screen / Esc
Printer-friendly Version
Interactive Discussion
rithmically scaled with the lower cut-off and geometric mean diameters listed in supplemental Table S1 (see http://www.atmos-chem-phys-discuss.net/9/17705/2009/ acpd-9-17705-2009-supplement.pdf). The geometric width of the size channels, dlogDa, was 0.25 for the lowermost channel (<0.54 µm) and 0.03125 for all other 51 channels (up to 19.81 µm). For each detected particle, the fluorescence intensity mea-5
sured after the aerodynamic sizing was recorded on a relative scale of 64 channels, ranging from non-detectable (channel 1) to maximum (channel 64) fluorescence signal. The fluorescence intensity detector was used as adjusted and delivered by the manu-facturer and tested upon instrument setup with fluorescent polystyrene latex particles (0.5 µm, TSI p/n 2609 053). A typical multi-point size calibration curve for particles 10
<3.5 µm is shown in Fig. S1. Absolute fluorescence intensity data are not recorded by the UV-APS, and the instrument is not calibrated for quantitative number concentration detection.
The TSI AIM software was used to export the correlated data of particle number concentration (dN/dlogDa) and fluorescence versus aerodynamic diameter for each 15
5 min measurement from the original data file (TSI *.A12 format) into an ASCII text file (*.txt format with comma delimiter). Further processing, statistical analysis, and plot-ting of the data were performed with Igor software (Wavemetrics Inc., Version 6.0.5.0). A user-written Igor program was used to sum dN/dlogDa into two-dimensional matri-ces of particle size vs. measurement date and time for further analysis. Lognormal 20
fits were performed with the standard fitting algorithm of Igor [fit parameters: x0=Dg, width=2.303·√2logσg, A=2.303·N/(√π·width)].
2.3.2 Calculation of FBAP and total particle concentrations
Recently, Kanaani et al. (2007) suggested that all particles recorded by the UV-APS in fluorescence channels 2–64 can be regarded as viable aerosol particles. Agranovski 25
ACPD
9, 17705–17751, 2009Fluorescent biological aerosol particle measured
with UV-APS
J. A. Huffman et al.
Title Page
Abstract Introduction
Conclusions References
Tables Figures
◭ ◮
◭ ◮
Back Close
Full Screen / Esc
Printer-friendly Version
Interactive Discussion
number size distributions of fluorescent aerosol particles, dNF/dlogDa, for each size bin from the sum of the particle number concentrations from fluorescence channels 3–64, and we calculated the total particle size distributions dNT/dlogDa, from channels 1–64. For comparison we also calculated dNF/dlogDa using channels 2–64 as illus-trated in supplemental Figs. S2–S4. These show the enhancement of dNF/dlogDa is 5
strongly size dependent (Fig. S4), decreasing from a factor of 3.4 at 0.6 µm to a factor of 1.1 at 20 µm. As a result, by excluding fluorescence channel 2 we expect to obtain a conservative estimate and avoid over-counting the abundance of FBAPs, which in turn can be regarded as a lower limit for the atmospheric abundance of viable PBAPs. The integrated number concentration of coarse fluorescent particles (NF,c, >1 µm) is 10
on average 1.5 times higher than the integratedNF,cexcluding fluorescence channel 2 (Fig. S3a).
Some fraction of non-biological aerosol particles, including soot and PAHs, exhibit fluorescence and can be erroneously counted as FBAPs by this technique. This is most likely to occur at small (<1 µm) particle sizes where contribution from anthro-15
pogenic particles from combustion sources is dominant. If, for example, only a very small amount (e.g. 0.1%) of a non-biological particle mode with peak of 100 cm−3
at 0.75 µm exhibited fluorescence, a peak of 0.1 cm−3would appear in the fluorescent par-ticle number distribution. This peak may often be large enough to appear as a distinct peak in the distribution of fluorescent particles (Sect. 3.2). To investigate the contri-20
bution of non-biological particles that are counted by this technique (only considering fluorescence channels >3) the correlations between the integrated number concen-trations of fluorescent particles (NF) and total particles (NT) were plotted separately for particles less than 1.0 µm and greater than 1.0 µm (Fig. S5). The correlation of the sub-µm particles is systematically linear (R2=0.51, 34 270 data points), with most 25
ACPD
9, 17705–17751, 2009Fluorescent biological aerosol particle measured
with UV-APS
J. A. Huffman et al.
Title Page
Abstract Introduction
Conclusions References
Tables Figures
◭ ◮
◭ ◮
Back Close
Full Screen / Esc
Printer-friendly Version
Interactive Discussion
correlation ofNF withNT indicates that a large percentage of particles exhibiting fluo-rescence may be from anthropogenic sources as is the case for sub-µm particles, but not for supermicron particles. Similar correlations were also performed for smaller cut sizes. Goodness of fit values for these correlations increased with decreasing cut size, indicating an increasing influence of anthropogenic sources (e.g., Fig. S6 withR2=0.86 5
for particles<0.723 mm).
To avoid/minimize interference with non-biological fluorescent particles and for sim-plicity, we focus our analysis on coarse particles (>1 µm), and we exclude particles
<1 µm from the discussion of integral number concentrations. Accordingly, we take the integral number concentration of fluorescent particles larger than 1 µm, NF,c, as the 10
concentration of coarse FBAP. Similarly, NT,c refers to the total integral number con-centration of particles detected by the UV-APS larger than 1 µm. Particle mass size distributions (dM/dlogDa) were calculated for each size channel by multiplication of dN/dlogDa with the volume of an aerodynamically equivalent sphere with the geomet-ric midpoint diameter (Da,g) assuming a density of 1 g cm−3 and a shape factor of 1. 15
Integral mass concentrations of coarse FBAPs (MF,c) and total coarse particles (MT,c) were also calculated by integration of particle mass>1 µm.
2.4 Detection limits
For the interpretation and scaling of size distribution data and plots (Sect. 3.2) we have calculated the lowest detectable concentrations (LDC) measurable in each size chan-20
nel of the UV-APS during the 5 min sample measurements performed in this study. For the incremental particle number concentration per size channel (dN) as well as for the integrated particle number concentration (N), the LDC is given by the inverse of the sample volume passing through the measurement cell: LDCN=LDCdN=2×10⁻⁴cm−3.
With regard to size distributions, the lowest detectable value is given by division of 25
LDCdNthrough the geometric width of the size channel: LDCdN/dlogD
a=8×10
−4
cm−3for channel 1 (<0.54 µm, dlogDa=0.25) and LDCdN/dlogDa=6.4×10−
3
chan-ACPD
9, 17705–17751, 2009Fluorescent biological aerosol particle measured
with UV-APS
J. A. Huffman et al.
Title Page
Abstract Introduction
Conclusions References
Tables Figures
◭ ◮
◭ ◮
Back Close
Full Screen / Esc
Printer-friendly Version
Interactive Discussion
nels 2–52 (0.54–19.81 µm, dlogDa=0.03125), used for further analysis.
The LDC of particle mass scales with the third power of the aerodynamic diameter of detected particles. For each size channel LDCdM has been calculated by multipli-cation of LDCdN with the volume of the aerodynamic equivalent sphere with geometric midpoint diameter (Da,g) and density of 1 g cm−3. The values of LDCdM are listed in 5
Table S1, ranging from 3 pg m−3 (channel 1) to 0.8 µg m−3 (channel 52). The
corre-sponding values of LDCdM/dlogDa range from 11 pg m−3 to 26 µg m−3. The lowest de-tectable integrated mass concentration, LDCM, is effectively given by the lowest value of LDCdM in the range of size channels which have been used for data analysis in this study (channels 2–52): 17 pg m−3. The LDC values are the same for FBAPs and total 10
aerosol particles (TAPs, including non-fluorescent aerosol particles) and are listed here for individual measurements at the conditions of this study. The LDC of data points av-eraged over a longer time period will scale inversely with the number of measurements recorded (n). Note that all particle sizes given here areDa,g, but will be simplified asDa.
3 Results and discussion 15
3.1 Particle number and mass concentrations
3.1.1 Overview of number concentrations
To our knowledge, no other time series of bioaerosol measurements with similarly high time resolution extending over a similarly long period have been previously reported. Thus, we first outline characteristic features of the time series (Figs. 1–2) in a gen-20
ACPD
9, 17705–17751, 2009Fluorescent biological aerosol particle measured
with UV-APS
J. A. Huffman et al.
Title Page
Abstract Introduction
Conclusions References
Tables Figures
◭ ◮
◭ ◮
Back Close
Full Screen / Esc
Printer-friendly Version
Interactive Discussion
grated total coarse FBAP number (NF,c), and as a number ratio of integrated coarse FBAP to TAP (NF,c/NT,c). Figures similar to Fig. 1, each with a range of one month are shown in Fig. 2 in order to view temporal trends with more precision.
Through-out the measurement period the total coarse particle number concentration,
NT,c, varied mostly within a relatively narrow range of values between 0.37–1.30 cm−3 5
(25–75th percentiles), but also exhibited highly variable large spikes and strong diur-nal and day-to-day variations frequently exceeding one order of magnitude between adjacent days (supplemental Figs. S7–S8). Background concentrations consistently dropped to<0.4 cm−3between morning peaks during most of the campaign. The high-est total particle number concentrations were observed in November, with daily peaks 10
above 8 cm−3 and maxima up to 14 cm−3during 27 November–2 December. Several
events of highNT,c maxima (>4 cm−3) and high sustainedNT,cbackground (>2 cm−3) also occurred between 11 October–13 November, with the largest occurring the early mornings of 30 October and 1 November. The lowest values of NT,c were detected 13–14 November, with minima as low as 0.03 cm−3.
15
In contrast to total particles, the FBAP number concentration, NF,c, exhibited less pronounced spikes and showed more consistent diel and day-to-day behavior (Figs. 1a and 3b; 0.012–0.033, 25–75th percentiles). The highestNF,cconcentrations were ob-served 25–27, 30–31 October and 8 November, with maxima up to 0.85 cm−3 and >0.3 cm−3 each day. The lowest sustained (>6 h) values of NF,c were detected on 20
2 and 13 November when the concentration dropped to 0.0015 cm−3 and remained
below ∼0.005 cm−3 for 8 and 16 h, respectively. This period coincides with a several day period of highNT,c. The relative contribution of FBAP to TAP number, NF,c/NT,c, showed similar temporal behaviour toNF,c, but with more pronounced extremes due to the variability of the total number of coarse particles. NF,c/NT,c varied typically in the 25
ACPD
9, 17705–17751, 2009Fluorescent biological aerosol particle measured
with UV-APS
J. A. Huffman et al.
Title Page
Abstract Introduction
Conclusions References
Tables Figures
◭ ◮
◭ ◮
Back Close
Full Screen / Esc
Printer-friendly Version
Interactive Discussion
are inversely correlated, but with a high amount of scatter; asNT,c increases,NF,c/NT,c decreases.
The statistical distribution of 5 min number concentration measurements over the course of the campaign are shown in Fig. 3 and tabulated in Table 1. The monthly mean ofNT,cvaried by a factor of∼3 over the course of the measurement period, from 5
a minimum in September to a maximum in November. The months of October and November showed not only higher meanNT,cvalues, but also higher relative variability, reflected in the size of the 5–95th percentile bars in Fig. 3. The mean values of NF,c showed more consistency, however. September’s lowNF,c (0.018 cm−3) was the only monthly mean value outside the relatively narrow range of 0.026–0.032 cm−3.
10
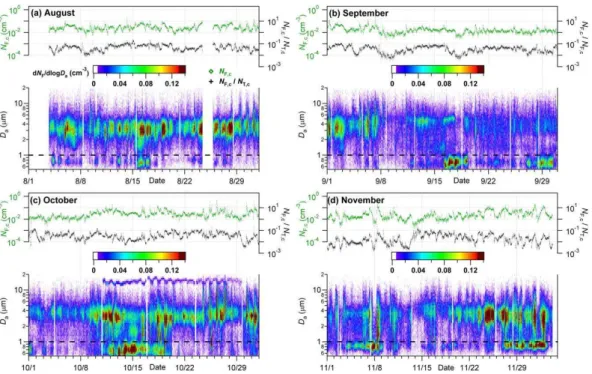
Diel (24-h) trends over the four-month measurement period were also analyzed. Fig-ure 4 shows plots similar to Fig. 1, but showing campaign median values for each hour of the day. A dailyNF,c peak of 0.029 cm−3 at 07:00 LT is clearly evident above a rel-atively flat background of 0.017–0.018 cm−3(Fig. 4a). NF,c/NT,c shows a similar trend, with a peak at 07:00 of 4.4% above an early morning background of 2.6%. A second, 15
minor peak of 3.9% in the FBAP coarse particle number ratio is evident at 17:00. This is a result of the corresponding decrease in NT,c at this time, while the NF,c is rela-tively constant. Figure 4b shows that the 07:00 peak in NF,c is a result of a peak in dNF/dlogDaat 3.2 µm. The peak at this size is the most prominent particle size through all hours of the day, but increases at night and is highest in the mid-morning (05:00– 20
10:00). Figure 5 shows the same diel plot, with each panel showing median values for one of the four individual months of the measurement period. This further highlights the consistency of the∼3 µmNF,c peak. In each plot of monthly median values the∼3 µm peak is dominant at all times of the day, but retains a diel cycle with a peak in the mid-morning. Of the four months ofNF,c measurements, August exhibits the highest 25
ACPD
9, 17705–17751, 2009Fluorescent biological aerosol particle measured
with UV-APS
J. A. Huffman et al.
Title Page
Abstract Introduction
Conclusions References
Tables Figures
◭ ◮
◭ ◮
Back Close
Full Screen / Esc
Printer-friendly Version
Interactive Discussion
diel maxima at 07:00 and 15:00. NF,c shows two peaks with relatively equal height (0.025 and 0.028 cm−3, respectively) caused by the increased concentration of∼3 µm particles. NF,c then drops offsteeply after 15:00 and rises steeply again immediately before 07:00. The November pattern also shows a more prominent peak at ∼0.8 µm during night time hours that is not as clearly seen in the other months. Size distributions 5
for selected periods will be discussed in detail in Sect. 3.2.
Diel plots ofNT,c are shown as an average for the campaign and for each month in supplemental Figs. S9–S10, respectively. The size-resolved dNT/dlogDa(lower panels) over the four months of measurement consistently shows a dominant peak at<1.0 µm during night-time hours. The maxima of dNT/dlogDaduring August and September oc-10
curred at 04:00, while the peak shifted increasingly earlier in October and November to 02:00 and 21:00, respectively (a second peak in September is also observed at 09:00). The diel cycles of TAPs in (semi-)urban environments are usually governed by bound-ary layer mixing effects and anthropogenic emissions (Garland et al., 2008, 2009). The diel cycles of FBAPs, however, are clearly different from those of TAP sources, 15
and variability of FBAP sources seems to dominate over boundary layer mixing effects. Steep increase in FBAP concentrations observed in the morning after sunrise (∼06:00 in August–∼08:00 in December) may suggest that a combination of high relative humid-ity and sunlight enhances the emission from bioaerosol sources (Elbert et al., 2007). Correlations of meteorological parameters with TAP and FBAP were performed and 20
show a qualitative increase inNF,c with relative humidity, but with variable time offset and low correlation coefficient. No statistically significant correlation was found with wind direction. Further statistical analysis will be performed in follow-up studies, but are beyond the scope of this work.
Overall, the results show that FBAPs account for a small but significant fraction (typ-25
natu-ACPD
9, 17705–17751, 2009Fluorescent biological aerosol particle measured
with UV-APS
J. A. Huffman et al.
Title Page
Abstract Introduction
Conclusions References
Tables Figures
◭ ◮
◭ ◮
Back Close
Full Screen / Esc
Printer-friendly Version
Interactive Discussion
ral background aerosol over vegetated continental regions (Jaenicke, 2005; Andreae, 2007; Jaenicke et al., 2007; Andreae and Rosenfeld, 2008; Martin et al., 2009).
3.1.2 Overview of mass concentrations
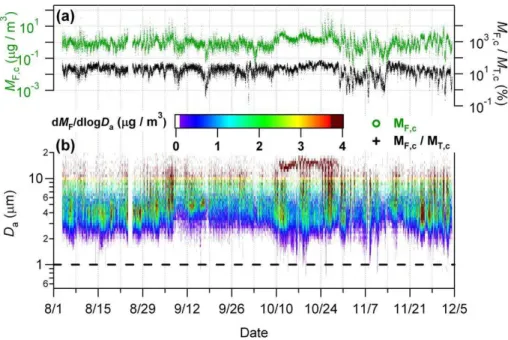
We also present here an overview of the estimated FBAP mass concentration over the course of the measurement period. Figure 6 shows the integrated total coarse particle 5
mass (MF,c), the fraction of integrated FBAP mass to TAP mass (MF,c/MT,c), as well as a time series of size-resolved measurements (dMF/dlogDa). Figures similar to Fig. 6, each with a range of one month are shown in supplemental Fig. S11 in order to view temporal trends with more precision.
MT,c (Figs. S12–S13) exhibited a pattern of large fluctuations and frequent (several 10
times per week) large peaks (>25 µg m−3) on top of a relatively clean background of
be-tween 1–4 µg m−3. The highest peaks came during a period from 25–27 October when daily morning maxima exceeded 100 µg m−3 each day and reached 270 µg m−3on 26 October. The periods from 28 August–1 September and 6–7 September also exhibited high dailyMT,cpeaks of>45 µg m−3. 2–3 October and 13–14 November exhibited the 15
lowestMT,c values at<1 µg m−3for∼12, 24 h, respectively and daily minima regularly dropped to<1.5 µg m−3over the course of the measurement period. MF,cvaried at con-stant background of 0.51–1.49 µg m−3(25–75th percentiles), also with frequent spikes
in concentration. The highest background concentration rose 9–28 October when lev-els rarely dropped below 0.8 µg m−3and peaked >40 µg m−3at least daily from 25–27 20
October. Temporal trends inMF,care only poorly reflected inMF,c/MT,ctemporal behav-ior, as the ratio is qualitatively dominated byMT,c. The fraction of FBAP to TAP coarse particle mass varied within a range of 11–27% µg m−3 (25–75th percentiles) over the course of the measurements. Events with very high FBAP mass fractions above 65% occurred at least once a month (peaking at 92% on 9 August) and>70% six times. 25
ACPD
9, 17705–17751, 2009Fluorescent biological aerosol particle measured
with UV-APS
J. A. Huffman et al.
Title Page
Abstract Introduction
Conclusions References
Tables Figures
◭ ◮
◭ ◮
Back Close
Full Screen / Esc
Printer-friendly Version
Interactive Discussion
mean values ofMT,c exhibited lower relative variability, but similar temporal trends as
NT,c, with a general increase through the course of the measurement months. Monthly meanMT,cvalues varied by a factor of∼1.5 from a minimum of 5.3 µg m−3in August to 8.2µg m−3in November. The 95th percentile values were 2.1–2.3 times higher than the mean values ofMT,c in each case. The monthly mean values of MF,c showed similar 5
relative variability asMT,c and MF,c, except in October when both mean MF,c values and relative variability were significantly higher. The mean value ofMF,c (1.9 µg m−3) in October represents the only month above the range of 0.92–1.1 µg m−3. Similar to
the trend inNF,c/NT,c,MF,c/MT,cshows a gradual decrease over the course of the four months measured, with highMF,cin October causing the only outlier. The mean values 10
are only marginally higher than the median values for MF,c/MT,c, indicating relatively low temporal variability. The median and mean for MF,c/MT,c over the course of the campaign were 18.5 and 19.5%, respectively. On average, the relative contribution of FBAP to TAP coarse particle mass was ∼5 times larger than the contribution of FBAP to TAP coarse particle number (∼3.9%). This is consistent with the observation 15
that FBAPs show enhanced prevalence among large aerosol particles (3–10 µm), as shown and discussed in Sect. 3.2.
Diel trends inMF,c were also analyzed and are shown in Fig. 8 for the entire cam-paign and in supplemental Fig. S14 for each individual month. Figure 8a shows that the lowestMF,cvalues occurred at night, with a temporally broad increase inMF,c from 20
∼05:00–14:00 and a maximum at 08:00 (1.17 µg m−3). The overall trend of night-time
lows with peak in mid-morning is similar to diel NF,c trend, but MF,c shows a greater relative increase from diel minimum to maximum compared withNF,c (66% and 79%, respectively), and the morning MF,c peak is temporally broader and extends later in the day. MF,c/MT,c exhibited a temporal trend similar toMF,c, but less pronounced and 25
ACPD
9, 17705–17751, 2009Fluorescent biological aerosol particle measured
with UV-APS
J. A. Huffman et al.
Title Page
Abstract Introduction
Conclusions References
Tables Figures
◭ ◮
◭ ◮
Back Close
Full Screen / Esc
Printer-friendly Version
Interactive Discussion
trend in overall integrated coarse particle mass. Though relatively few in particle num-ber, particles between 7–9 µm are consistent through day-light hours (∼07:00–17:00), however, and are the largest contributors to MF,c at those times. MF,c for August (Fig. S14a) shows the clearest morning peak compared to the other three months, but also shows relatively little diel cycle in MF,c/MT,c (18.0% minimum, 22.0% maxi-5
mum). As was also the case forNF/dlogDa, an afternoon peak of intermediate particle diameter became more apparent as each month progressed. The contribution of mass by the larger particles (7–9 µm) is most significant in September and November, and least significant in August. During all periods of investigation particles smaller than 3 µm, though often important in number, were negligible in terms of particle mass. 10
3.2 Size-distributions of particle number and mass
3.2.1 Exemplary particle size distributions
Figure 1b shows that FBAPs with Da≈3 µm were nearly ubiquitous during the cam-paign. The FBAP peak at∼3 µm exhibits a clear diel cycle (Fig. 4b), but rarely dis-appears completely. In addition to this peak, a variety of other FBAP peaks were fre-15
quently observed for varying lengths of time. Out of a wide range of different patterns and peaks in dNF/dlogDaobserved during the campaign, four characteristic modes of FBAP were most commonly found and clearly distinguishable. The peak diameters of these modes were typically around∼1.5 µm, ∼3 µm, ∼5 µm, ∼13 µm, respectively. In the following we highlight exemplary periods and size distributions illustrating charac-20
teristic features and the variability of the most commonly observed patterns and peaks in dNF/dlogDa.
Figure 9a–b (exemplary period # 1) illustrate the most frequently observed individual peaks in the dNF/dlogDa distribution, with maxima at 3 µm and 0.7 µm. As discussed in Sect. 2.3.2, the sub-µm peak in dNF/dlogDais likely due to fluorescent particle com-25
ACPD
9, 17705–17751, 2009Fluorescent biological aerosol particle measured
with UV-APS
J. A. Huffman et al.
Title Page
Abstract Introduction
Conclusions References
Tables Figures
◭ ◮
◭ ◮
Back Close
Full Screen / Esc
Printer-friendly Version
Interactive Discussion
observed during exemplary period #1 exhibits a much higher peak at the same di-ameter, and the ratio between dNF/dlogDa and dNT/dlogDaatDa=0.7 µm is similar to the near-constant proportion of fluorescent sub-µm particles observed throughout the campaign (∼0.1%, Fig. S5). Accordingly, we do not consider this and other sub-µm peaks in dNF/dlogDa as characteristic for FBAP and exclude them from further anal-5
ysis and discussion. With regard to the FBAP peak observed atDa≈3 µm, period #1 provides a relatively narrow example (nearly monodisperse withσg∼1.2) that may con-sist of particles from the same or similar sources (e.g., spores from similar types of fungi). In many other cases we observed broader peaks that seemed to comprise two or more types of FBAPs with slightly different diameters (Figs. S16–17) or overlapped 10
with other characteristic modes that are like to have originated from different sources and biological species.
Figures 9c–d (exemplary period #2) illustrate another frequently observed FBAP size distribution pattern, with a broad peak centered at ∼3 µm and a smaller peak at∼1.5 µm. Periods #1 and #2 both exemplify situations where the observed FBAP 15
size distribution was fairly stable over the course of<12 h, as opposed to events where short-term bursts of FBAPs extended over only a few hours (Figs. 10c–d, S16). Fig-ure 10a–b (exemplary period #3) illustrate a situation where the FBAP mode around
∼5 µm was not just overlapping with, but much more pronounced than the∼3 µm mode.
In this case the peak near 5 µm is exceptionally narrow, suggesting particles from the 20
same or similar sources as discussed above. In most other cases, the peaks around
∼5 µm were broader (Fig. S16) and likely composed of particles from a variety of diff
er-ent sources. Figure 10c–d (exemplary period #4) illustrate a situation where a narrow peak at ∼1.1 µm dominates the FBAP size distribution. This pattern was uniquely observed over a 35 min period on 17 August. The small particle size and the short du-25
ACPD
9, 17705–17751, 2009Fluorescent biological aerosol particle measured
with UV-APS
J. A. Huffman et al.
Title Page
Abstract Introduction
Conclusions References
Tables Figures
◭ ◮
◭ ◮
Back Close
Full Screen / Esc
Printer-friendly Version
Interactive Discussion
Figure 11a–d (exemplary periods #5 and #6) show FBAP size distributions with a dis-tinct and narrow peak at∼13 µm that appeared on 10 October and persisted until 29 October. Most likely the∼13 µm peak is due to pollen grains from a nearby tree that was blossoming during this exceptionally warm period in October 2006. In the relevant size range (12–17 µm), the FBAP peak (pollen grains) also dominated the total aerosol par-5
ticle concentration and size distribution with FBAP/TAP ratios in the range of 60–100% (25–75th percentile, mean 73%). Figure 11 also shows that the size resolution and sensitivity of the UV-APS are sufficient for separating and quantifying different types of FBAPs independent of the varying concentrations of TAP (and non-biological fluo-rescent particles<1 µm). Supplemental Fig. S18a–d shows that FBAP peaks around 10
∼1.5 µm,∼3 µm and∼5 µm could be observed, even during periods of very low aerosol
concentration levels.
3.2.2 Average size distributions
The number and mass size distributions for both TAPs and FBAPs averaged over the whole campaign are shown in Fig. 12. The TAP number size distribution dNT/dlogDa 15
was generally dominated by a peak at the lower end of the investigated size range (Da≈0.7 µm, Fig. 12a; monthly averages in Fig. S19). Note that this “peak” is likely due to a steep decrease in the UV-APS detection efficiency for small particles at Da
<0.7 µm; otherwise the distribution would likely increase to the lowest size bin. Sup-plemental Fig. S20 shows the campaign meanNT/dlogDasize distribution with a loga-20
rithmic y-axis in order to resolve characteristic features at the low values of dNT/dlogDa observed at large diameters. For example, a shoulder at ∼3 µm can be attributed to the corresponding FBAP peak inNF/dlogDa.
The campaign and monthly average size distributions of fluorescent aerosol parti-cles, dNF/dlogDa, are shown in Figs. 12c and 13a–d, respectively. The sub-µm peak 25
ACPD
9, 17705–17751, 2009Fluorescent biological aerosol particle measured
with UV-APS
J. A. Huffman et al.
Title Page
Abstract Introduction
Conclusions References
Tables Figures
◭ ◮
◭ ◮
Back Close
Full Screen / Esc
Printer-friendly Version
Interactive Discussion
size distributions of August and October this peak was even narrower and more in-tense. In the monthly averaged size distributions of September and November, how-ever, the peak was substantially broader and the maximum was shifted towards higher
Da, indicating the presence of different and more diverse types of FBAP. A small mode at∼1.5 µm is present in the mean FBAP distribution as well as in each monthly plot. 5
Lastly, an FBAP mode at∼13 µm can be seen in the mean FBAP number distribution. As discussed previously, this mode was small in number concentration, but was almost completely comprised of FBAP material.
The size distributions of TAP mass were much broader than those weighted by num-ber and also differed in the fact that they exhibited several more distinct local maxima. 10
The campaign mean TAP mass distributions (Fig. 12b) looked generally similar to each of the constituent months (Fig. S21) with a distinct peak at 0.8 µm, a broad peak with two local maxima centered between 3–8 µm, and an upward slope at particle diameters above∼12 µm. During August, September and November the same four peaks were observed in the TAP mass distribution as in the campaign mean, while in October an 15
additional peak at 13.8 µm was also observed, showing what are likely pollen particles observed during the month of October to be of high enough relative FBAP fraction to contribute noticeably to the monthly TAP mass distribution. The highest concentration at each of the two dominant TAP mass peaks were in November, when the monthly mean was 0.36 and 0.31 µg m−3for the 0.84 and 3.05 µm peaks, respectively.
20
The campaign mean FBAP mass distribution (Fig. 12d) was generally bimodal , with broad peaks centered at 4.4 and 7.8 µm. A sharper peak centered at 13.8 µm came from the October-specific pollen particles, not as clearly evident in any other month (Fig. S22). The August mean FBAP mass distribution (Fig. S22a) also shows a small shoulder at 13.8 µm, indicating that the source of the October particle peak may have 25
ACPD
9, 17705–17751, 2009Fluorescent biological aerosol particle measured
with UV-APS
J. A. Huffman et al.
Title Page
Abstract Introduction
Conclusions References
Tables Figures
◭ ◮
◭ ◮
Back Close
Full Screen / Esc
Printer-friendly Version
Interactive Discussion
in the TAP mass distribution were from some mechanical process that did not also produce particles containing measurable concentrations of viable biological material. In general, the size distributions of FBAP mass were shifted to larger particle sizes in September and October as compared with August and November.
3.2.3 Ratio of fluorescent bioparticles to total particles 5
Taking a ratio of the number of FBAPs (dNF) and TAPs (dNT) in each size bin allows the determination of the relative contribution of viable biological particles at each parti-cle size. As discussed previously, the mean shape factor and partiparti-cle density of each particle were each assumed to have a value of unity. This determines that the value of the dNF/dNT,cratio is equal to dMF/dMTby definition. For observed particles of diame-10
ter less than 2.5 µm, the dNF/dNT ratio was less than 10% for an average of the entire measurement period (Fig. 14) and for each individually-averaged month (Fig. S23), indicating that relatively few of these small particles were FBAPs. Mean ratio curves show two local maxima, consistently located at similar particle diameters of 3.8–4.7 µm and 9.0–10.4 µm, respectively. The peaks are more distinct in the August and Septem-15
ber averages, while for October and November the mean ratio curves appear closer to being a broad single peak between 3 and 12 µm. In August 32% of the total particles at the distinct peak with an aerodynamic diameter of 4.4 µm were identified to fluoresce and were therefore considered to be FBAPs, while in September the value for the same peak (4.7 µm) dropped slight to 30%, and then decreased further in October (3.8 µm) 20
and November (4.7 µm) to 23% and 24%, respectively. The second peak in the FBAP to TAP ratio that can be clearly seen in each of the four months showed a slightly larger ratio: August (38%, 10.4 µm), September (34%, 9.0 µm), and November (31%, 9.6 µm). The October peak was obscured by an additional large peak at∼13 µm and was there-fore more difficult to quantitatively determine. This∼3 week-long particle event resulted 25
ACPD
9, 17705–17751, 2009Fluorescent biological aerosol particle measured
with UV-APS
J. A. Huffman et al.
Title Page
Abstract Introduction
Conclusions References
Tables Figures
◭ ◮
◭ ◮
Back Close
Full Screen / Esc
Printer-friendly Version
Interactive Discussion
peak in October was the most pronounced, other periods also indicate FBAPs in this size range. The counting statistics, as discussed in the previous section, are poor for the detection of large particles (>∼8 µm), and therefore median values often reflect the fact that particles of this size were often not present in>50% of the sampled 5 L volumes. The mean (red) curve, therefore, best represents the dNF/dNT ratios at the 5
upper particle sizes. Further example of this is that the light gray shaded area between the 5th and 95th percentile curves covers the entire ratio from 0–100% at all particle diameters greater than∼7 µm and that the median value goes to zero at ∼10 µm for each month.
The ratio of the size distributions averaged over the entire measurement campaign 10
(Fig. 14) show similar trends to each of the individual months. Three local maxima are apparent, at aerodynamic particle diameters of 4.70, 9.65, and 13.8 µm. Though the particles of diameter greater than 13 µm were almost exclusively present within the month of October, the month’s large peak at these sizes heavily influences the 4-month average (Fig. 12a). As a way of removing the very local point source during 15
October, the average contribution of FBAP to TAP number and mass over this four-month measurement period was calculated with the period of 10–29 October removed. The ratio plot is shown in Fig. S24 for comparison, and shows a similar pattern to Fig. 14, but without the sharp peak at 13.8 µm.
4 Summary and conclusions
20
In this study we investigated the capability of a UV-APS operated continuously in Mainz, Germany over the 4-month period of August–November 2006 to quantify the concen-tration and size of viable biological aerosol particles in urban and rural European con-tinental air. For this purpose, time series of the integrated coarse particle number and mass concentrations as well as particle mass and number size distributions of both to-25
ACPD
9, 17705–17751, 2009Fluorescent biological aerosol particle measured
with UV-APS
J. A. Huffman et al.
Title Page
Abstract Introduction
Conclusions References
Tables Figures
◭ ◮
◭ ◮
Back Close
Full Screen / Esc
Printer-friendly Version
Interactive Discussion
variability of size distributions (using 5-min measurement points) were observed. Over the course of the measurement period the coarse particle number concentration of FBAPs varied in the range of 1.2×10⁻³–1.4 cm−3, with an arithmetic mean value of 0.027 cm−3(±0.026 cm−3, standard deviation). These accounted for 0.09–67% (mean value 3.9%±2.8%) of the total coarse particle number concentration. The coarse par-5
ticle mass concentration of FBAPs varied in the range of 4×10⁻³µg m−3to 123 µgm−3, with an arithmetic mean value of 1.3 µg m−3 (±2.0 µg m−3) The coarse particle mass of FBAPs accounted for 0.067–92% (mean value 20%±11%) of total coarse particle mass concentrations.
The TAP size distribution was almost always monomodal, dominated by a peak at 10
∼0.60–0.75 µm, and a peak in the FBAP distribution reflecting nearly identical size and
temporal variability characteristics was almost always also present. This peak was likely a result of combustion sources exhibiting spurious fluorescence due to soot and PAHs. After investigating the correlation between small (<1.0 µm) particles exhibiting fluorescence with peaks in the TAP distribution we concluded to exclude particles of 15
aerodynamic diameter less than 1.0 µm in order to avoid overestimation of FBAPs and therefore conservatively estimate FBAPs as the lower limit of ambient, viable PBAPs. Size distributions of remaining FBAPs commonly alternated between periods exhibiting from one to four FBAP peaks. The observed temporal variability of peaks in the FBAP size distribution is not surprising in view of the high diversity and different frequencies 20
of occurrence of bacteria and fungal spores detected by microscopy, cultivation and molecular genetic analyses of air particulate matter (Despres et al., 2007; Elbert et al., 2007; Fr ¨olich-Nowoisky et al., 2009). After investigating trends in FBAP size dis-tributions, however, the FBAP peaks can be broadly classified into four FBAP modes. The most common mode was observed around∼3 µm as the dominant FBAP peak. 25
ACPD
9, 17705–17751, 2009Fluorescent biological aerosol particle measured
with UV-APS
J. A. Huffman et al.
Title Page
Abstract Introduction
Conclusions References
Tables Figures
◭ ◮
◭ ◮
Back Close
Full Screen / Esc
Printer-friendly Version
Interactive Discussion
The additional FBAP modes observed over the four months of measurements can be grouped around∼1.5 µm, ∼5 µm, and∼13 µm. The smallest mode was likely caused by individual bacterial cells or agglomerates and was most often observed at∼1.5 µm, though the peak of this mode varied between 1.1–1.8 µm. The∼5 µm mode encom-passes a variety of peaks observed at different times, though rarely was it seen as 5
a monodisperse peak or set of peaks. Peaks in this region were most often broad and not lognormally distributed, but often distinct from the 3 µm peak. The least com-monly observed mode is a∼13 µm peak observed for three weeks in October. Though the peak exhibited low absolute concentration (<2×10⁻³cm−3), the relative fraction of FBAP to TAP during this period and size range averaged 73% and often ranged to 10
100%. These particles were very likely pollen grains released from a nearby blossom-ing tree. Lognormal fits of selected FBAP peaks were performed in order to provide estimates of characteristic PBAP modes for inputs for aerosol models.
The UV-APS instrument was shown to be capable to detect FBAPs in real-time at concentrations characteristic for ambient air in semi-urban and rural European conti-15
nental regions. In addition, a sample length of 5-minutes was determined to be ad-equate for observing fluctuations in the concentrations of TAPs and FBAPs. The de-termination that FBAP concentration makes up an average of 3.9% of the total coarse aerosol number and 20% of the coarse aerosol mass is significant. Few studies have been able to show the concentration of viable biological aerosol concentrations over an 20
extended sampling period, and to our knowledge this paper represents the first multi-month study that publishes the concentration of these particles in a semi-urban area using a direct technique from real-time, fluorescence detection measurement.
Appendix A 25
List of frequently used acronyms and symbols
ACPD
9, 17705–17751, 2009Fluorescent biological aerosol particle measured
with UV-APS
J. A. Huffman et al.
Title Page
Abstract Introduction
Conclusions References
Tables Figures
◭ ◮
◭ ◮
Back Close
Full Screen / Esc
Printer-friendly Version
Interactive Discussion Acknowledgements. J. A. H. and B. T. contributed equally to this work. This work has
been funded by the Max Planck Society, and the authors gratefully acknowledge support by M. O. Andreae, W. Elbert, V. Despr ´es, and A. G. Wollny.
The service charges for this open access publication
5
have been covered by the Max Planck Society.
References
Agranovski, V., Ristovski, Z., Hargreaves, M., Blackall, P. J., and Morawska, L.: Performance evaluation of the UVAPS: influence of physiological age of airborne bacteria and bacterial stress, J. Aerosol Sci., 34, 1711–1727, doi:10.1016/s0021-8502(03)00191-5, 2003a.
10
Agranovski, V., Ristovski, Z., Hargreaves, M., Blackall, P. J., and Morawska, L.: Real-time measurement of bacterial aerosols with the UVAPS: performance evaluation, J. Aerosol Sci., 34, 301–317, doi:10.1016/s0021-8502(02)00181-7, 2003b.
Agranovski, V., Ristovski, Z., Blackall, P. J., and Morawska, L.: Size-selective assessment of airborne particles in swine confinement building with the UVAPS, Atmos. Environ., 38, 3893–
15
3901, doi:10.1016/j.atmosenv.2004.02.058, 2004a.
Agranovski, V., Ristovski, Z. D., Ayoko, G. A., and Morawska, L.: Performance evaluation of the UVAPS in measuring biological aerosols: Fluorescence spectra from NAD(P)H coen-zymes and riboflavin, Aerosol Sci. Technol., 38, 354–364, doi:10.1080/02786820490437505, 2004b.
20
Agranovski, V. and Ristovski, Z. D.: Real-time monitoring of viable bioaerosols: capability of the UVAPS to predict the amount of individual microorganisms in aerosol particles, J. Aerosol Sci., 36, 665–676, doi:10.1016/j.jaerosci.2004.12.005, 2005.
Andreae, M. O.: Aerosols before pollution, Science, 315, 50–51, doi:10.1126/science.1136529, 2007.
25
Andreae, M. O. and Rosenfeld, D.: Aerosol-cloud-precipitation interactions. Part 1. The nature and sources of cloud-active aerosols, Earth-Sci. Rev., 89, 13–41, doi:10.1016/j.earscirev.2008.03.001, 2008.
ACPD
9, 17705–17751, 2009Fluorescent biological aerosol particle measured
with UV-APS
J. A. Huffman et al.
Title Page
Abstract Introduction
Conclusions References
Tables Figures
◭ ◮
◭ ◮
Back Close
Full Screen / Esc
Printer-friendly Version
Interactive Discussion chemical characterization of bioaerosols – Implications for nucleation processes, Int. Rev.
Phys. Chem., 28, 1–32, doi:10.1080/01442350802597438, 2009.
Bauer, H., Schueller, E., Weinke, G., Berger, A., Hitzenberger, R., Marr, I. L., and Puxbaum, H.: Significant contributions of fungal spores to the organic carbon and to the aerosol mass balance of the urban atmospheric aerosol, Atmos. Environ., 42, 5542–5549,
5
doi:10.1016/j.atmosenv.2008.03.019, 2008.
Bowers, R. M., Lauber, C. L., Wiedinmyer, C., Hamady, M., Hallar, A. G., Fall, R., Knight, R., and Fierer, N.: Characterization of Airborne Microbial Communities at a High-Elevation Site and Their Potential To Act as Atmospheric Ice Nuclei, Appl. Environ. Microbiol., 75, 5121–5130, doi:10.1128/AEM.00447-09, 2009.
10
Brosseau, L. M., Vesley, D., Rice, N., Goodell, K., Nellis, M., and Hairston, P.: Differences in detected fluorescence among several bacterial species measured with a direct-reading particle sizer and fluorescence detector, Aerosol Sci. Technol., 32, 545–558, 2000.
Brown, J. K. M. and Hovmoller, M. S.: Epidemiology – Aerial dispersal of pathogens on the global and continental scales and its impact on plant disease, Science, 297, 537–541, 2002.
15
Burge, H.: Bioaerosols – Prevalence and Health Effects in the Indoor Environment, J. Allergy Clin. Immunol., 86, 687–701, 1990.
Burrows, S. M., Butler, T., J ¨ockel, P., Tost, H., Kerkweg, A., P ¨oschl, U., and Lawrence, M. G.: Bacteria in the global atmosphere – Part 2: Modelling of emissions and transport between different ecosystems, Atmos. Chem. Phys. Discuss., 9, 10829–10881, 2009a,
20
http://www.atmos-chem-phys-discuss.net/9/10829/2009/.
Burrows, S. M., Elbert, W., Lawrence, M. G., and P ¨oschl, U.: Bacteria in the global atmosphere – Part 1: Review and synthesis of literature data for different ecosystems, Atmos. Chem. Phys. Discuss., 9, 10777–10827, 2009b,
http://www.atmos-chem-phys-discuss.net/9/10777/2009/.
25
Christner, B. C., Morris, C. E., Foreman, C. M., Cai, R. M., and Sands, D. C.: Ubiquity of bio-logical ice nucleators in snowfall, Science, 319, 1214–1214, doi:10.1126/science.1149757, 2008.
Cox, C. S. and Wathes, C. M.: Bioaerosols handbook, Lewis, Boca Raton, 1995.
Despr ´es, V. R., Nowoisky, J. F., Klose, M., Conrad, R., Andreae, M. O., and P ¨oschl, U.:
Char-30
ACPD
9, 17705–17751, 2009Fluorescent biological aerosol particle measured
with UV-APS
J. A. Huffman et al.
Title Page
Abstract Introduction
Conclusions References
Tables Figures
◭ ◮
◭ ◮
Back Close
Full Screen / Esc
Printer-friendly Version
Interactive Discussion Dingle, A. N.: Pollens as condensation nuclei, J. Rech. Atmosph., 2, 231–237, 1966.
Dusek, U., Frank, G. P., Hildebrandt, L., Curtius, J., Schneider, J., Walter, S., Chand, D., Drewnick, F., Hings, S., Jung, D., Borrmann, S., and Andreae, M. O.: Size matters more than chemistry for cloud-nucleating ability of aerosol particles, Science, 312, 1375–1378, doi:10.1126/science.1125261, 2006.
5
Elbert, W., Taylor, P. E., Andreae, M. O., and P ¨oschl, U.: Contribution of fungi to primary biogenic aerosols in the atmosphere: wet and dry discharged spores, carbohydrates, and inorganic ions, Atmos. Chem. Phys., 7, 4569–4588, 2007,
http://www.atmos-chem-phys.net/7/4569/2007/.
Eng, J., Lynch, R. M., and Balaban, R. S.: Nicotinamide Adenine Dinucleotide Fluorescence
10
Spectroscopy and Imaging of Isolated Cardiac Myocytes, Biophys. J., 55, 621–630, 1989. Franze, T., Weller, M. G., Niessner, R., and P ¨oschl, U.: Protein nitration by polluted air, Environ.
Sci. Technol., 39, 1673–1678, doi:10.1021/es0488737, 2005.
Fr ¨olich-Nowoisky, J., Pickersgill, D. A., Despres, V. R., and P ¨oschl, U.: High diver-sity of fungi in air particulate matter, P. Natl. Acad. Sci. USA, 106, 12814–12819,
15
doi:10.1073/pnas.0811003106, 2009.
Gabey, A., Gallagher, M. W., Whitehead, J., Dorsey, J., Burgess, R., Kaye, P. H., Stanley, W., and Ulanowski, Z.: Real-time Observations of Fungal Spore Number in a Malaysian Tropical Rain Forest, Biotropica, accepted, 2009.
Garland, R. M., Yang, H., Schmid, O., Rose, D., Nowak, A., Achtert, P., Wiedensohler, A.,
20
Takegawa, N., Kita, K., Miyazaki, Y., Kondo, Y., Hu, M., Shao, M., Zeng, L. M., Zhang, Y. H., Andreae, M. O., and P ¨oschl, U.: Aerosol optical properties in a rural environment near the mega-city Guangzhou, China: implications for regional air pollution, radiative forcing and remote sensing, Atmos. Chem. Phys., 8, 5161–5186, 2008,
http://www.atmos-chem-phys.net/8/5161/2008/.
25
Garland, R. M., Schmid, O., Nowak, A., Achtert, P., Wiedensohler, A., Gunthe, S. S., Takegawa, N., Kita, K., Kondo, Y., Hu, M., Shao, M., Zeng, L. M., Zhu, T., Andreae, M. O., and P ¨oschl, U.: Aerosol optical properties observed during Campaign of Air Quality Research in Beijing 2006 (CAREBeijing-2006): Characteristic differences between the inflow and outflow of Beijing city air, J. Geophys. Res.-Atmos., 114, D00G04, doi:10.1029/2008jd010780, 2009.
30