UNIVERSIDADE CATÓLICA PORTUGUESA
COMPOSITION WITH COMPLEX DATA:
A CONTRIBUTION ON THE MAPPING PROBLEM THROUGH PRACTICE-BASED RESEARCH
Dissertation submitted to the Portuguese Catholic University in partial fulfilment of requirements of the Doctoral Degree in Science and Technologies of the Arts – Computer
Music
by
Samuel Van Ransbeeck
ESCOLA DAS ARTES March 2015
UNIVERSIDADE CATÓLICA PORTUGUESA
COMPOSITION WITH COMPLEX DATA:
A CONTRIBUTION ON THE MAPPING PROBLEM THROUGH PRACTICE-BASED RESEARCH
Dissertation submitted to the Portuguese Catholic University in partial fulfilment of requirements of the Doctoral Degree in Science and Technologies of the Arts – Computer
Music
by Samuel Van Ransbeeck
Dissertation supervised by António de Sousa Dias
ESCOLA DAS ARTES March 2015
This work was developed with the financial aid of the Fundação para a Ciência e Tecnologia (FCT), under the Programa Operacional Potencial Humano SFRH/BD/72601/2010
This research has been performed at the Catholic University of Portugal- Research Center for Science and Technology of the Arts (CITAR) in Porto.
Abstract
Composition with complex data is a field of computer music composition/interactive art that uses extra-musical data from various sources like stock exchange data, weather data or seismic data. Despite the fascination that one can have in his exciting field of composition, there is still a lack of data management applications for artistic use. Hence, one is generally forced to create one’s own applications, at the expense of the time that should be spent in the artistic side of the work. As the technology can be part of the work but never the sole constituent, we decided to develop a toolbox, DataScapR, which allows artists to work easily with data, helping them in focusing on the artistic side. This toolbox will help the user to quickly advance beyond the technical development and focus on the artistic side of the project.
This project consists of four components: a theoretical framework for sonification art, a state of the art and discussion on mapping techniques, the development of a sonification toolbox for composers who wish to use complex data (more specifically stock market data) as the source material for their music and a series of works as case studies to show the capabilities of the toolbox.
Bringing theory and practice, art and technology together, this project can be seen as a practice-based one embedded within a theoretical framework.
Keywords: sonification art, algorithmic composition, data, information, concept, technology
Resumo
Nesta dissertação, abordo o tema da sonificação em contexto artístico. Sonificação, a tradução de dados en sons, é um largo campo de investigação e existe todo o interesse na exploração deste domínio num contexto artístico. Esse projecto visa contribuir para a criação de um ramo teórico para a arte da sonificação e, em simultâneo, apresentar uma aplicação que facilite o uso de sonificação em contexto artístico. Com efeito, actualmente, existem poucas aplicações que permitam usar sonificação na composição musical de uma forma acessível. Por esta razão, um compositor pode ter que aplicar um tempo considerável no desenvolvimento de uma aplicação própria o que muitas vezes, pode ter um efeito prejudicial na criação da obra em si. Se o compositor tem que aplicar demasiado tempo no desenvolvimento tecnológico pode correr o risco de considerar a aplicação como sendo a obra em si, o que não é o caso: pode ser uma parte mas nunca a obra. Para combater o pequeno leque de aplicações acessíveis criei uma caixa de ferramentas, DataScapR, desenvolvido em Max, e disponibilizada para o público em geral. DataScapR é um projecto aberto: o utilizador pode estendê-lo livremente e adaptá-lo às suas necessidades. Todos os patches são comentados extensivamente para facilitar a sua edição e extensão. O uso prático de DataScapR é exemplificado através de Através de estudos de caso demonstrando que a sonificação pode ser uma prática interessante integrada num contexto artístico.
Nesse projecto de doutoramento foco um tipo de dados especifico: dados da bolsa das acções. Isso vem dum interesse pessoal e no dinamismo inerente à bolsa. Sempre considerei a bolsa fascinante e penso que pode ser interessante para usar os dados para sonificação.
A dissertação consiste em quatro partes. A primeira parte aborda questões teóricos: procuramos uma definição de arte de sonificação e integramos essa prática no contexto da composição. Tratamos da questão da natureza e definição de dados e como eles podem ser aplicados na música. Depois de construída uma base teórica, descrevemos o estado da arte. Nesse segundo capítulo descrevemos obras que usam sonificação como componente importante da própria existência e discutimos os diferentes métodos de mapping.
Seguidamente, discuto o software existente bem como a necessidade duma nova aplicação. No terceiro capítulo apresento DataScapR, um dos componentes práticos do doutoramento. DataScapR é uma caixa de ferramentas para sonificação de dados da bolsa de acções. Assim, apresento os três módulos que permitem usar dados em tempo real e dados históricos. Os métodos de mapping são explicados e a estrutura interna dos patches é apresentada. Finalmente, no quarto capítulo apresento as obras realizadas usando DataScapR: For A Fistful Of Data (flauta de bisel), 4D Brokers (instalação), Vapourwaves (instalação), Mirage (obra sobre suporte). Para cada caso, apresento a obra, discuto a sua estrutura, os mappings utilizados e as questões técnicas e termino com uma avaliação da obra. No final do capítulo concluo com uma avaliação geral das peças. Na discussão final realizo uma avaliação do trabalho feito e aponto direcções para trabalho futuro.
A dissertação é da caixa de ferramentas DataScapR, de quatro estudos de caso e dois blogs: datascapr.wordpress.com onde o DataScapR está disponível e sonifcationart.wordpress.com onde discuto vários projectos de sonificação.
Esse projecto de doutoramento mostra apenas uma das posições possíveis em arte de sonificação e, por esta razão, deve ser considerado como uma abertura para novos caminhos a explorar.
ACKNOWLEDGMENTS
It would not have been possible to undertake this PhD without the assistance of other people. Therefore, I would like to acknowledge their contributions and thank them for their valuable help. In the first place I would like to thank my supervisor António de Sousa Dias, who always found new angles to approach the project. I would also like to thank Katharina Vogt and Visda Goudarzi, whose expertise helped in progressing during my stay in Graz. Furthermore, I would like to thank Pedro Pestana for assessing the software. Andrea Agostini and Daniele Ghisi from the Bach project were very helpful in order to understand bach and to solve problems while I was developing DataScapR.
My PhD colleagues were a valuable source of inspiration and criticism. Vitor Joaquim’s decades-long experience helped me to re-evaluate concepts. Discussions with João Castro Pinto were challenging and inspiring, making me want to indulge more in philosophy. Furthermore I would like to thank André Baltazar, João Cordeiro, José Vasco Carvalho, Mailis Rodrigues, Francisco Bernardo, Pedro Patrício, Diana Cardoso and André Perrotta for their interesting discussions over the years.
Professors are the fundaments of a University; they are beacons on the vast ocean of knowledge. Paulo Ferreira-Lopes’, Luis Gustavo Martins’, Carlos Sena Caires’, Álvaro Barbosa’s and Sofia Lourenço’s words helped to navigate towards the destination. I also would like to thank the professors at the IEM in Graz, especially Gerhard Nierhaus for his interesting discussions in the field of algorithmic composition.
Many people whose names I do not know helped through forums and mailinglists such as cycling74.com, microsound.org, acma mailinglist and many more. They were very helpful in finding papers, explaining programming concepts and clarifying artistic issues.
I would like to thank all artists whose works I describe in this dissertation and on the blog for their answers explaining their works in a detailed way.
This project would have been impossible without the investment of the Foundation for Science and Technology. The investment in this project proved an open spirit and willingness to research topic without an apparent immediate economic return. We can only hope that these investments will continue to happen in the future. As the Foundation is
financed through taxpayers’ money, I would like to thank all these taxpayers for their contribution to this project.
I would like to thank the Catholic University and the Centre for Research in Technology and the Arts-CITAR for accepting me as a student and letting me pursue my PhD here.
My parents who stood behind me were a big support during the years.
Cecilia Peçanha has been the most important person in my life during the past years. She deserves every credit for her kindness and accompaniment throughout all these years.
TABLE OF CONTENTS
INTRODUCTION ... 1
MOTIVATION ... 1
STRUCTURE OF THE THESIS ... 2
SITUATION: ORIENTATION OF THE DISSERTATION CONCEPTS ... 3
1 THEORETICAL CONCEPTS ... 5
1.1 INTRODUCTION ... 5
1.2 AUDITORY DISPLAY: DEFINITIONS, TYPES, AND FUNCTIONS ... 5
1.2.1 SONIFICATION MODES AND TECHNIQUES ... 7
1.2.2 SONIFICATION AND COMPOSITION ... 11
1.2.3 LOCATING SONIFICATION ART ON THE MAP ... 14
1.2.4 TOWARDS A DEFINITION ... 15
1.3 DATA, THEIR MAPPING AND THE SOUNDING RESULT ... 15
1.4 COMING-INTO-BEING AND CREATIVE PROCESSES IN SONIFICATION ART18 1.5 AN ONTOLOGY OF DATA ... 20
1.6 BEYOND MAPPING: ARTISTIC ISSUES ... 22
1.7 STORYTELLING WITH DATA ... 24
1.8 SONIFICATION AS SOUNDSCAPE ... 27
1.9 TECHNOLOGY IN SONIFICATION ART ... 27
1.10 DIFFERENT AESTHETICS = DIFFERENT STRUCTURES? ... 30
1.11 SYSTEMATIZATION IN SONIFICATION ART ... 33
1.12 CONTEXT AND RECEPTION ... 37
1.13 SUMMARY ... 39
2 AN OVERVIEW OF EXISTING SONIFICATION ART ... 41
2.1 WHAT DATA ARE USED AND WHAT DATA NOT? ... 43
2.1.1 PROJECTS USING ENVIRONMENTAL DATA ... 44
2.1.2 PROJECTS USING BIOLOGICAL DATA ... 50
2.1.3 PROJECTS USING ASTRONOMICAL DATA ... 51
2.1.4 PROJECTS USING URBANDATA ... 54
2.2 MAPPINGS IN THE DISCUSSED ARTWORKS ... 64
2.3 SONIFICATION SOFTWARE ... 66
2.3.2 MAESTRO FRANKENSTEIN 2 ... 67 2.3.3 SONART ... 67 2.3.4 SONIPY ... 67 2.3.5 ARTWONK/MUSICWONK ... 68 2.4 CONCLUSIONS ... 68 3 DATASCAPR ... 71 3.1 BACKGROUND ... 71 3.2 GOALS ... 73
3.3 WHAT DATASCAPR IS AND WHAT IT IS NOT ... 74
3.3.1 WHAT DATASCAPR IS NOT? ... 75
3.3.2 EXPANDING DATASCAPR ... 77
3.3.3 SYSTEM REQUIREMENTS ... 78
3.3.4 INSTALLING THE TOOLBOX ... 78
3.3.5 MAPPING THE DATA IN THE ROW-BY-ROW COMPONENT ... 82
3.3.6 USING A VST ... 85
3.3.7 SCORE-CREATION ... 87
3.3.8 WORKING WITH THE SCORE CREATION COMPONENT ... 88
3.4 REAL-TIME ... 92
3.4.1 DATA-FETCHING MODULE ... 92
3.4.2 STOCK PROPERTIES ... 94
3.4.3 INTERACTION WITH THE DATAFETCHING ... 95
3.4.4 MAPPING METHODS ... 97
3.4.5 OUTPUT ... 98
3.5 EVALUATION AND FUTURE WORK ... 98
4 CASE STUDIES ... 101
4.1 FOR A FISTFUL OF DATA ... 101
4.1.1 INSTRUMENT CHOICE ... 102
4.1.2 CHOICE OF THE DATASET ... 102
4.1.3 MAPPINGS USED ... 102
4.1.4 CHANGES AFTER THE MAPPING (OR BRICOLAGE) ... 107
4.1.5 EVALUATION ... 108
4.2 4D BROKERS ... 109
4.2.1 DATA USED ... 109
4.2.3 EVALUATION ... 111
4.3 VAPOURWAVES ... 111
4.3.1 GENERAL SETUP ... 112
4.3.2 THE DIFFERENT INSTRUMENTS THEIR MAPPINGS ... 113
4.3.3 SPATIALISATION ... 116
4.3.4 AESTHETIC CONSIDERATIONS ... 118
4.4 MIRAGE ... 120
4.4.1 CHOICE OF DATASET AND THE COMPOSITIONAL CONCEPT ... 121
4.4.2 MAPPINGS ... 122
4.4.3 EVALUATION ... 125
4.5 GENERAL EVALUATION ... 126
LOOKING BACK, LOOKING FORWARD ... 129
BIBLIOGRAPHY ... 131
APPENDICES ... 139
1. DVD CONTENTS ... 139
LIST OF FIGURES
Figure 1 – Auditory display and its subtypes. Sonification and Manifestation are
connected through the dataset exploration function. ... 7
Figure 2 – The three sonification modes according to most literature ... 8
Figure 3 – De Campo makes a slightly differently categarization ... 9
Figure 4 – Sonification modes according to Worrall ... 10
Figure 5 – A third type of algorithmic composition ... 14
Figure 6 – The place of algorithmic composition on the map. Sonification in an artistic context is located in the common sector of Arts and Entertainment and algorithmic composition. ... 14
Figure 7 – The four stages of a sonification process. ... 16
Figure 8 – The causal event gives birth to data, which have to be interpreted to become information. ... 22
Figure 9 – The KP index visualized as a Bartel diagram ... 53
Figure 10 – By drawing arcs, one can predict future movements and levels of change (Investopedia, 2005) ... 72
Figure 11 – DataScapR: the 5 modules allow the user to follow a logical path from data fetching until the sounding artefact. ... 78
Figure 12 – DataScapR: datafetching subpatch window showing three easy steps allow downloading a dataset. The stock symbol can be set manually or by using the umenu’s. ... 80
Figure 13 – DataScapR: the datareading module allows a visual inspection of the dataset. Minima and maxima are displayed below each column. ... 81
Figure 14 – DataScapR: the four mapping methods. ... 82
Figure 15 – Absolute and contextualized values example: the contextualization makes the profile of the line sharper. ... 83
Figure 16 – DataScapR: The ej.function object allows non-linear scalings ... 84
Figure 17 – DataScapR: the VST mapping module window ... 86
Figure 18 – The MIDI patch is slightly different from the VST patch ... 87
Figure 19 – DataScapR mapping subpatch window detail showing the first voice of four. The mapping destinations are fixed but can be disabled. ... 89
Figure 20 – DataScapR scorecreation subpatch window showing the roll and quantized score ... 90
Figure 21 – DataScapR flowchart: the mapped values are mapped again to text expressions ... 92
Figure 22 – DataScapR datafetching window allowing easy stock selection and a quick visual inspection of the received data ... 95 Figure 23 – DataScapR conversion subpatch window: the conversion from symbol to
float. In case a data point is not available (N/A), the last received value will be sent out. ... 96 Figure 24 – DataScapR real-time main window detail. The user can load 8 datatoVST
abstractions and 8 datatoMIDI abstractions. ... 97 Figure 25 – DataScapR mapping window detail showing the four different mapping
methods. On the left side on selects the incoming data, followed by the mapping method. The input value is displayed, followed by the mapping values (input range, output range, modulo) and finally the resulting mapped value. The rightmost menu is used to select the VST or MIDI parameter to send the value to. ... 98 Figure 26 – Amazon's stock price evolution (Yahoo Finance, 2015a) ... 103 Figure 27 – For a Fistful of Data: an overview of the mappings used. The top row
shows the pitch mapping. ... 103 Figure 28 – For a Fistful of Data: the sloped curve causes the low values to have
onsets that are placed far from each other, while the higher values will result in smaller onset values, hence placing the notes closer to each other. ... 104 Figure 29 – For a Fistful of Data: the durations use the inverse of the onset mapping:
low stock prices result in short notes, while higher prices yield longer notes. ... 105 Figure 30 – For a Fistful of Data: The sloped inverse mapping gives more emphasis
to the expanding articulations. The staccato articulation then only appears when the stock is really high. ... 106 Figure 31 – IBM's stock chart (Yahoo Finance, 2014) ... 109 Figure 32 – 4D Brokers: The 20 slices spaced at equal distances. The oldest slices’
sounds were more distorted to symbolize the disappearance of the data in the past. ... 111 Figure 33 – Vapourwaves: the oscillatorbank for stock 1. The last value is sent to the
zl stream object which outputs the last 28 values it received.. ... 114 Figure 34 – Vapourwaves: the MIDI patch for stock 1. The mappedstock1 value will
set the MIDI note, the mappedstock1b value the delay with which the value is sent out. Mappedstock1d sets the velocity and mappedstock1f receives the change in percent. ... 115 Figure 35 – Vapourwaves: the octavechange subpatch will add a transposition of the
MIDI note if the change in percent is large enough. ... 115 Figure 36 – Vapourwaves: the ZmapX ensures that transpoition is the biggest with a
change in percent value that is close to 0. ... 116 Figure 37 – Vapourwaves: the initial locations of each market in the stereofield ... 117 Figure 38 – Vapourwaves: the setup at the post-production room ... 117
Figure 39 – Vapourwaves: the triangular entanglement. Each element can be linked in
a relationship. ... 119
Figure 40 – Vapourwaves: a room where technology rules. ... 120
Figure 41 – The evolution of Citigroup’s stock price over 20 years (the small icons at the bottom of the chart denote stock splits and dividends) (Yahoo Finance, 2015b) ... 121
LIST OF TABLES Table 1 – Leech: data and mapping destination ... 61
Table 2 – Absolute and contextualized values example (see text for full description) ... 83
Table 3 – DataScapR Score Creation: parameters and default values ... 88
Table 4 – 4D Brokers: input data, destination and destination range ... 110
Table 5 – Vapourwaves:The eight cities, their markets, indexes and longitude ... 112
Table 6 – Mirage: parameters output range for the peaks in the stock price ... 124
INTRODUCTION
Motivation
In this dissertation I discuss sonification art through various viewpoints. This project started out from a personal desire to create a framework for the sonification of stock market data. Using this idea as a starting point, I realized that this would be a big undertaking, obliging me to delve deeper into the field of sonification. Upon embarking on this PhD project, I saw from my experience as a composer that there was a discrepancy between technology and the composer’s output. Whereas technology opens a gateway to a compositional ocean, it also opens the risk of drowning in the vast deepness of technological complicatedness. Many fellow students would embark on writing complex patches in MaxMSP but forgot to take that technology to the resulting artefact. In other words: when the patch was ready, the resulting composition was treated poorly in comparison. While the composer invested a lot of time in making the patch to work, he would not have sufficient time to create a compelling composition with his patch. In my conviction that sonification of stock market data offers a great potential for musical material, I wanted to create an application for other composers that they would be able to use, without having to loose too much time in programming the framework. This framework is DataScapR, presented here. Indeed, programming DataScapR was not an easy task, not being a software engineer myself. Nevertheless, having a compositional background, I thought I would be able to keep musical perspectives in a way that is generally not possible to a software engineer. While the application is ready to use, I call it a toolbox as it is an open work: users who wish to expand the application can do so according to their needs. As the programming environment was MaxMSP, a widely used environment in the musician’s community, it is easy to open up the patches and edit them. The application as an open work means that DataScapR offers possibilities that I did not explore myself but nevertheless can be interesting for other people to delve into. Of course
I wanted to create my own works using this application, which I present in this thesis as case studies.
Ultimately, the goal is to create an understanding of sonification art and prepare possible pathways for artists to explore. In no way this Thesis should be seen as a definitive work: it is a particular perspective on the topic and one can study it from many different angles. My contribution is thus one of the many studies possible.
Structure of the thesis
This thesis consists of four chapters. In the first chapter, the field of sonification art is defined and delineated. This involves a comparison between existing definitions and a redefinition for the current concept. Having defined the field of research, I then pursue a localisation within the philosophical-aesthetical field in order to make the research position clear. Having made the predisposition clear, it is possible to embark on the questioning of the problem set I want to treat in this project.
After having posited the questions, I proceed to discuss the state of the art through discussing existing sonification projects and dissecting the mapping methods, which the creators used. This allows for future researchers-artists to see which mapping methods exist and how they can be used in potentially interesting ways. I devote a section as well to sonification software packages and discuss the differences, advantages and disadvantages.
The third chapter presents the DataScapR toolbox: the architecture, the different components and how to use it are discussed.
Finally, in chapter four, the practical outcomes of using DataScapR are presented: an installation work (as well as an embryonal version of an installation work), an acoustical composition and an electro-acoustic piece.
The reader will find in the appendix and the accompanying DVD the DataScapR toolbox, the documentation of the artworks and published papers.
The dissertation is accompanied by two blogs: datascapr.wordpress.com, where the user can download the DataScapR toolbox and sonificationart.wordpress.com, where sonification works are discussed.
Situation: orientation of the dissertation concepts
This thesis aims to research sonification in an artistic context. While sonification has been researched extensively for projects that are mainly scientific in nature, sonification art has been not been studied in a systematic way. This thesis aims to fill the existing void though both theoretical research as well as an application of the concepts put forward. There are many perspectives possible on this topic and in no way this thesis will be the Holy Grail in sonification art research. Nevertheless, I hope that this thesis will be a good contribution to the level playing field.
Limits of this thesis
In order to perform this research, some limitations had to be set. These help to keep focus attention on the topic.
As the dissertation is focused on sonification in an artistic context, scientific sonification is not discussed at-length. Sonification is a very large field so we need to limit ourselves to avoid wanting to write everything.
The State of the art discusses a selection of projects where substantial information on mapping techniques has been available. Other projects are presented on the research blog sonificationart.wordpress.com, which accompanies this dissertation.
Although originally intended, a user study on DataScapR is not included. I believe it would not add value to the dissertation as the toolbox is meant to be used in a very personal way: every composer will use the toolbox in a different way and tracking those different uses would not be useful unless after a few years when the toolbox is in use. At the moment, I deem it not appropriate to add a user study.
Technical details
The dissertation has been typeset using Microsoft Word 2011 for Mac. The font used throughout the text is Times New Roman, except for code snippets where Andale Mono was used. Citations and bibliography were handled using Mekentosj Papers 3 and the used style is APA 6th edition as provided by Mekentosj Papers 3.
1 THEORETICAL CONCEPTS
1.1 Introduction
Sonification art requires the use of auditory displays. Therefore, prior to discuss or present sonification we need to contextualize and define/present auditory displays. Various definitions of auditory displays (AD) are juxtaposed, followed by a discussion on algorithmic composition. In the end I will propose a definition of sonification in an artistic context.
1.2 Auditory Display: Definitions, Types, and Functions
Sonification represents a subset of what we call an auditory display (AD). As with a visual display, an auditory display acts as an interface between the information source and the recipient. (Walker & Nees, 2011) define AD as “any display that uses sound to communicate information…”. This goes in the same direction as (de Campo, 2008) who refines this, stating that “Auditory display is the rendering of data and/ or information into sound designed for human listening.”
In AD we can distinguish two subsets:
1. The understood information subset. In auditory information display well-understood information is communicated through sound. Examples are public service announcements, auditory feedback sounds on computers, alarms and warning systems, process monitoring systems, etc. These messages do not require explanation: their meaning is immediately perceptible.
2. The Sonification subset. Sonification or Data Sonification is the rendering of (typically scientific) data into (typically non-speech) sound designed for human auditory perception. The informational value of the rendering is often unknown
beforehand, particularly in data exploration. Through (repeated) listening of the sonic result we are able to grasp the meaning of the data.
We can further refine these distinctions in various ways according to their intended function, as do Walker and Nees who describe four function categories in auditory display:
1. Alerting functions: any sound that warns the user for an event, e.g. an alarm clock1 2. Status and progressing indicating functions: sounds to keep the user informed about
the status of a process
3. Data exploration functions: The sound is used to give a person an impression of the data set as opposed to alerting and status indicating functions that only show a momentarily state.
4. Art and entertainment: In addition to yielding warnings and sonifications, events and data sets can be used as the basis for musical compositions. For example: one can generate musical sequences and build a composition with them.
Looking at these types, we can say that type 3 and type 4 share similarities; we are exploring a dataset, however, the goal is different. (Polansky, 2002) makes this distinction between data exploration functions (sonification) and sonification for arts practices by dividing the practice in a sonification subset and a manifestation subset; sonification is where the objective is to sonify a process in order to better understand it. Its purpose is pedagogical and illustrative. (Hermann & Hunt, 2004) describe an example of this kind of sonification: Helicopter flight data is sonified and listened to in a compressed time space. The listener can discover abnormalities in the flight data by listening to changes in the sound. On the other hand, in manifestation we are instantiating an aesthetical experience, in musical terms: a composition. Although alarm sounds or status report indicator sounds should not be seen as totally unaesthetic, however the functionality is primary in those types.
Using the above-mentioned definitions, we are able to draw an auditory display map pictured below.
Figure 1 – Auditory display and its subtypes. Sonification and Manifestation are connected through the dataset exploration function.
1.2.1 Sonification Modes and Techniques
In sonification practice for data exploration (scientific or artistic), it is necessary to choose a proper mapping method. Arbitrary mappings that have no relation to the data or cannot be easily related to them will impede the listener to gain a better understanding of the data, offering no advantage over visual or other displays. This problem is commonly known as the mapping problem. In this research, it is necessary to have a closer look to possible mapping methods. They will help us in understanding the mapping problem and devise strategies to create interesting mappings.
(de Campo, 2008) states that most literature describes three sonification modes: Audification: If we use high sampling rates, the data can be translated into waveforms. For example, seismic data have been translated into waveforms for example (Bioacústiques, n.d.) and (Aiken et al., 2012). This process is called audification (or audication). As the data patterns do not follow physical laws that exist in nature, the resulting waveforms can sound unearthly and difficult to interpret for the user (Worrall, 2009a). On the other hand, these unearthly waveforms can be an interesting source for sound design and composition. Furthermore, although the sound might not translate the data in an easy-to-interpret way, this sonification mode is probably the closest to the data. Indeed, the only way to change the sounding result is to either use a different sampling resolution or to play the waveform at a different speed (which is the same as reading the
data at a different speed). There is no layer in-between the data and the resulting sound. In other words: the mapping is straightforward. Of course, one can use an intermediate mapping to manipulate the data’s ranges but there we enter the realm of parametric mapping.
Event-based sonification using parameter mapping: Each data point is mapped to a sound event, for example: Each update of a stock price results in a new note where the frequency of the pitch is controlled by the price. Synonims are ratiometric mapping (Polansky, 2002), auditory scatterplots (Flowers, 2005), unit-swapping (Saladin, 2007) or nth-order parametric mappings (Scaletti, 1994) as cited in (Worrall, 2009a). The advantage of parametric mapping is its flexibility: changing values can be done easily and give different sonic results. The disadvantage is that the change in one parameter can influence how we perceive the others: loudness can affect pitch perception for example (Worrall, 2009a). It is thus necessary to understand the destination parameter’s nature and structure.
Model-based sonification: In this type, the user is able to interact with the data mappings. Instead of listening to a static representation of the data, he can manipulate parameters in real time. (Hermann & Hunt, 2004) defines Model-based sonification as:
“a sonification model is a dynamic system, formed from the data under scrutiny, plus a set of interactions determining how the user may excite the system plus a fixed mechanism describing how the resulting dynamic behaviour determines the sound”.
Model-based sonification is particularly useful in sonifying multi-dimensional datasets where a time-axis (or another equal-distance element to organize the data) is absent. One can compare it to playing a string instrument: in order to make sound, the string has to be excited by the user. The length and thickness of the string will then control the resulting sound. In model-based sonification, virtually bowing the string will excite the virtual body, which is controlled through the data. The physical modeling of instruments can be considered a prime example of model-based sonification.
DeCampo himself makes a slightly different categorization:
1. Sonification by Continuous Data Representation: using an equal distance on at least one dimension and a high enough sample rate so that interpolation between data points becomes useful. Audification and parameter mapping can use continuous data representation.
2. Sonification by Discrete Point Data Representation: every data point is tied to an individual event.
3. Sonification by Model-Based Data Representation: a model, whose properties are controlled by the data, is used.
Figure 3 – De Campo makes a slightly differently categorization
(Worrall, 2009a) also distinguishes between parametric mapping and audification but adds homomorphic modulation sonification. This kind of mapping similar to parametric mapping but with the difference that while in parametric mapping, the amplitude goes to 0 between every event/data point, in homomorphic modulation mapping, the amplitude points of the events are connected so that a continuous pulse wave arises. The resulting absence of rapid onsets (as opposed to parametric mapping) can have a lower auditory load on the listener. The best way to describe this is a gliding colour scale: all individual colours are present; however, they smoothly morph over into each other so that we cannot distinguish discrete colours.
Figure 4 – Sonification modes according to Worrall
In the interactive division, Worrall distinguishes between sound graphs and model-based sonification. Sound graphs are navigable spaces where the user can navigate freely, in a non-linear fashion to hear the data of his choice.
Each of the sonification modes has its peculiarities, advantages and disadvantages. Aesthetic choices will play a significant role in choosing the sonification mode. Once the mode has been chosen, one can choose a mapping technique: what conditions will one set to map the data from one domain onto another? Indeed, to map a value we need to set a condition. For example: a value of X will yield a mapped value of Y, a value of 2X will yield a value of 2Y et cetera. The process of choosing this mapping technique can be considered to be empirical: we test possible outcomes and through observation we choose the one that best fits our purpose (whether that be scientific or artistic). This aesthetic experience is informed by earlier experiences and learned conventions. This will have an influence on our thinking about mapping, hence we will return to discussing mapping later on in the dissertation (see 1.6).
While the sonification modes can exist as categories, there are no exact borders and we can use multiple modes. For example, (de Campo, 2008), in creating his sonification map, lets the different modes spill over in each other. One example was discussed above: audification can share parts with parametric mapping. Indeed: in audification we still control the amplitude of the wave through mapping a data point.
After having explained the technical side of sonification modes, we can now try to embed sonification in the compositional practice.
1.2.2 Sonification and Composition
As manifestation (the term posited by Polansky) can be related to musical composition, we will focus on the exploration of the artistic possibilities of sonification in the context of auditory display. In fact, both manifestation and algorithmic composition use numbers. Indeed, music always involves numbers somehow; notes, rhythms, tempos et cetera can be expressed in numbers. As such, it is a logical step to let those numbers be controlled by external data, be they created through mathematical processes or through observations of a phenomenon. To use these data, we need to drive them through a mapping process. Thus we can see that both algorithmic composition and sonification rely on numbers and on a translation process. Nevertheless, there are differences that we need to discuss in order to understand the premise of sonification.
Indeed, algorithmic music relies on an extra-musical process that is being sonified through mapping the data into musical parameters. This practice is not unique to 20th and 21st century music. Warren claims that in the 14th century Guillaume Dufay used the proportions of the Santa Maria del Fiore cathedral in Florenceto to control the tempi in his motet Nuper Rosarum Flores2 (Warren, 1973). In his Musical Dice Game Mozart used two matrixes of 8 by 11 cells. By throwing dices, a series of numbers is created. These numbers correspond to the 196 cells in the matrixes, each containing a musical fragment. Each unique series results thus in a new musical piece. Although algorithmic, Mozart still adhered to the tonal doctrine. In the twentieth century, with fewer restrictions, more and more composers started using algorithms in their music.
Many types of algorithmic music exist. (Roads, 1996) divides the field in stochastic and deterministic music while (Maurer, 1999) distinguishes between stochastic and rule-based music. In stochastic music, the composer uses a series of numbers generated by a computer. The composer still has quite some liberty in mapping the numbers to musical parameters. This is less the case in rule-based/deterministic music where rules are
2 However, Fallow (Fallows, 1987) and Turner (Turner, 1991) contend that Dufay never used the proportions as a control parameter. Wright in continuation of the other critics states that Dufay used the biblical passage Kings 6:1–20, which gives the dimensions of the Temple of Solomon as 60 x 40 x 20 x 30 cubits. Freire (Freire, 2014) totally refutes Warren’s claim and proposes a new rational relationship of 3:2:1:1. Putting the controversy aside, the idea of using architectural proportions to control musical parameters is interesting.
established before the composition takes place. The best-known example of rule-based music is probable the treatise on counterpoint Gradus ad Parnassum, written by Johann Joseph Fux (Fux, 1965).
Supper makes a more refined distinction of rule-based algorithmic music types: 1. the modelling of traditional compositional processes, not controlled by algorithms; 2. the modelling of new and original compositional processes, different from existing
ones;
3. the use of algorithms through extra-musical processes. (Supper, 2001)
Examples of the first type are SpeciesChecker (McKay, 2002), an application to write cantus firmi for species counterpoint and Choral (Ebcioglu, 1990), a program that harmonizes chorales in the style of Bach. Illiac Suite , created by Lejaren Hiller and Leonard Isaacson in 1957, is an example of a composition that used algorithms to model traditional compositional processes (Hiller & Isaacson, 1957). A composition of the second type is Çogluotobüsisletmesi, by Clarence Barlow in 1978.
“The metric and harmonic intensity, rhythmic and melodic uniformity, chordal density, density of attack, dynamics, and articulation were calculated according to a composed meta-structure: the algorithms. The actual piece is only one of many possible realizations (Supper, 2001)”.
The third type uses extra-musical processes to generate material. These processes are for example Lindenmayer systems. Developed by Aristid Lindenmayer in 1968, a Lindenmayer system or L-system is a parallel rewriting system and a type of formal grammar. Lindenmayer used L-systems to describe the behaviour of plant cells and to model the growth processes of plant development.
The system consists of an axiom and rewriting rules, for example: axiom X
Rule: X--> XYX
If we apply this rule to the axiom, we eventually see the following pattern emerge: X
XYX XYXYXYX
XYXYXYXYXYXYXYX
An interesting characteristic of L-systems is the auto-similarity that occurs during the recursions of the system. Various composers have used L-systems, such as (Hazard, Kimport, & Johnson, 1999) and (Sodell & Soddell, 2005).
What type of algorithmic music is manifestation (using Polansky’s term) now? On one hand it takes an ever-changing input, which we cannot replicate when taking a new selection of data. Obviously, there are recurring patterns but there are always subtle differences. It is impossible to encode these patterns, to set rules for their evolution. In that aspect, we should consider manifestation a form of stochastic music. However, this is not entirely true. Although we cannot be sure what is going to be the next data point, there exist patterns, which make it different from random datasets. We are talking about an evolutionary system (type 3 in rule based music) but we cannot encode this evolution, it is an ever-changing body of data. Especially in real-time musical works, it is difficult to create predetermined rules. A solution is to use interactive, dynamic rules, which the user can manipulate in real time. This helps him or her to adapt to new situations. We see the following problems that impede us from placing sonification sound art in either stochastic or deterministic music. These problems are:
1. The use of real data as opposed to mathematical models.
2. Although it is difficult to predict, there is no randomness in the data. Patterns emerge but we can only see them after the data has been ‘created’. There is a certain degree of information entropy.
As we cannot place this practice in neither stochastic nor deterministic music, we believe that we thus need to add a third category to algorithmic composition: sonification art.
Figure 5 – A third type of algorithmic composition
1.2.3 Locating Sonification Art on the Map
Having compared separately the types of auditory display and algorithmic music, it is now time to bring them together. Where does sonification art find itself on the map? If we look at the auditory display types explained in the first section, we see that the arts and entertainment are applications of sonification. Algorithmic composition in itself is a subset of the arts, but not all algorithmic music is part of the sonification field. If we visualize this, we get the following figure.
Figure 6 – The place of algorithmic composition on the map. Sonification in an artistic context is located in the common sector of Arts and Entertainment and algorithmic composition.
1.2.4 Towards a Definition
In the preceding sections, we discussed the difference between science and art as the goal / as main driving approaches to data. One element, which is essential to artistic practice remains to be discussed, is the appropriation by the artist of the data implying creative and subjective aspects. As the artist uses data from observations of world phenomena and maps them onto musical parameters, it is possible that he or she will not like the whole result. He can than decide to make alterations in the places that are not to his liking. For example: a line that is going up with one value drop can result in a broken melody, which might not be desirable in the composition. Thus the composer may decide to alter the value to make the melody continuously rising3. This results in a re-interpretation of the data: sonification as a creative trigger.
Creativity is an essential element in sonification art. In our definition, we will use Polansky’s manifestation term to refer to the creative element in sonification. We will discuss the creativity aspect more in-depth later on in this dissertation.
At the end of this section, we can finally propose a definition for sonification in an artistic context:
Sonification Art is an arts practice that uses data from observations of world phenomena, which are mapped onto musical parameters through fixed or dynamic mapping procedures as an essential input element and uses sound to manifest itself.
1.3 Data, Their Mapping and the Sounding Result
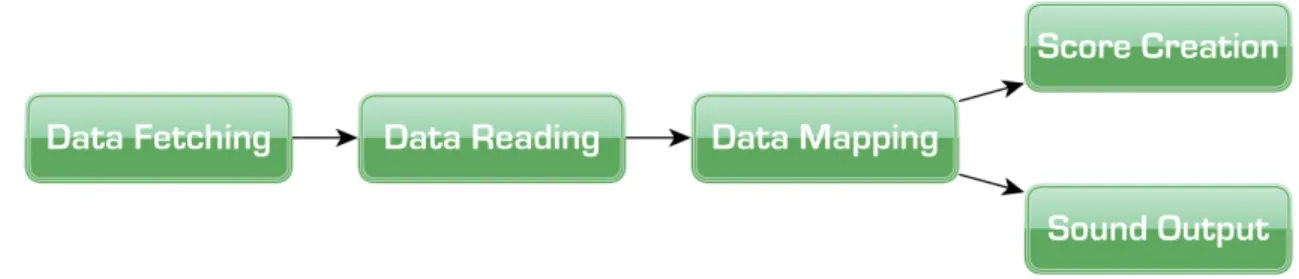
We can roughly divide a sonification process in four stages: 1. Data fetching;
3 One example of local decision-making can be found in Xenakis’ composition Herma. In discussing inconsistencies in the score, Xenakis admitted the ear as one of three elements (the other two being slips of the pen and theoretical or computational errors) that could explain these discrepancies (Vriend, 1981) and (Montague, 1995). Xenakis himself writes on this subject: “At the service of music, as well as of every creative human activity, scientific and mathematical thought has to be amalgamated dialectically with intuition” (Xenakis, 1976a).
2. Data reading; 3. Data mapping;
4. Making the data sound.
Figure 7 – The four stages of a sonification process.
When we talk about sonification, we first have to take a look to our source material, namely the data. We can basically take any available dataset and sonify it. These data come from various areas such as seismic data, weather data or financial data. Many of these data sets can be found online, either for free (like data.gov: a myriad of datasets from the United States Federal government) or for a charge (Xively.com and Bluekai.com offer access to several data streams))4. In a first stage we have to look for a dataset that is interesting enough to sonify. This means that we need a sufficient dynamic system to study. Not all data show interesting dynamics. For example: the birth rate of the Dodo in the last 200 years has been stable during all that period. Thus it comes as no surprise that a sonification would be redundant5 for most people. On the other hand, in a total random number series, we would be confronted with such a sheer amount of data that it becomes impossible to handle. Hence, it is paramount to choose a good dataset to get started.
The second aspect, equally important as to choosing a useful dataset, is the way we are going to store and read those data. First we have to choose if we are going to use a live stream or a recorded dataset. Both have their advantages and disadvantages. When using a livestream, we are confronted with the unexpected: we can never really know what will happen next. (Devisch, 2008), in his study on urbanism, calls such behaviour organized complexity: through their various interactions, the constituent elements create a distinct macro-behaviour, generating recognizable patterns or shapes. Unpredictability does not mean that the data are random: we simply cannot know the future completely. Only after
4 A quite large list of websites to get data can be found on http://www.kdnuggets.com (KDNuggets, 1997) 5 I originally used the term interesting here. This term would however imply a value judgement. Maybe somebody could find such a sonification interesting. Redundant seems then a better term to sue.
the fact we can assess the data to our assumptions.
Regardless of using historical data or real-time data, we need to create a sufficiently interesting mapping method to create a compelling sonification. We can make this interaction happen on two levels:
1. During the conceptual stage, where the artist tries out different mapping methods. 2. During the showing of the finalised artwork, where the user can interact with the
system, within the limitations set out in the conceptual stage.
When using a recorded dataset we can read the same dataset various times and improve our mapping method through multiple iterations. In either case, we can choose to let the user interact with the data and mapping or not. This interaction happens in a different stage than the conceptualization stage.
Whether the work is interactive or not and whether we use real-time data or a recorded dataset, the goal is to make the artwork a compelling6 experience. If we want the user to listen for extended periods to the sound, we need to pay attention to the aesthetical element. Kramer cit in (Barrass & Vickers, 2011) writes: “Improved aesthetics will likely reduce display fatigue. Similar conclusions can be reached about the benefits of a composer’s skills to making displays more integrated, varied, defined, and less prone to rhythmic or melodic irritants”.
The fourth stage is the making the data audible: how will the data sound? It is up to the composer to choose his instrument: he can choose to create a score to be performed by acoustic instruments or can map the data to synthesis parameters. The composition itself is not music but “a command structure for the production of sounding music” (Mazzola, Park, & Thalmann, 2011). The interpreting musician7 can than make personal choices when reading that command structure. The four stages described above do not constitute a linear process: indeed, if we want to, we can go back to the previous stage and make modifications to the process. Hence, process and result become intertwined. Of course, it is up to the public to make the final interpretation: every listener will hear the same
6 I use the term compelling to avoid the charged term of pleasant.
7 Obviously, in a fixed electronic composition a computer will not make interpretational decisions. Nevertheless, the tape or CD remains a command structure to be interpreted in order to get a sounding result.
composition differently. This interpretation however is not part of the compositional process.
1.4 Coming-into-being and Creative Processes in Sonification Art
"Ideas alone can be works of art; they are in a chain of development that may eventually find some form. All ideas need not be made physical."
(LeWitt, 1971)
The rise of conceptual art in the twentieth century has shifted focus from the artefact to the process of coming-into-being: how the artwork is created is at least as important as the resulting artefact. (Danto, 1998) proposes the term posthistorical to describe the period roughly from 19508 until now in which “art was no longer possible in terms of a progressive historical narrative” and exemplifies this with Andy Warhol’s Brillo Box. Originally designed as a box to hold scouring pads, Warhol transformed the mundane object to an artwork. Indeed, in Brillo Box, we came to see that the conceptual part was more important than the result itself. Warhol detached an object from its intended meaning and gave it a new meaning as an artwork9. In sonification art (or in algorithmic art in general), we detach the data from their original (informational) purpose and attribute a new meaning. For example: whereas stock market data serve to inform traders on the markets movements, by sonifying them to use in an artwork, we detach the informational aspect from the data and we interpret the data differently to serve our artistic purpose. This does not mean that the artwork does not refer anymore to the informational aspect (for example: one can use climate data in an artwork to make people aware of climate evolution); the data get a new significance assigned. Furthermore, when the data are in mapped to sound, they go through a processing stage. This process is highly conceptual; as the artist needs to think how he is going to make the mapping that best conveys his artistic message. Hence, process
8 Of course Duchamp comes already 40 years earlier with his Fountain work, a repurposed urinoir.
9 Looking at the object was not suficient to grasp its meaning: the audience had to grasp the concept behind it as well. This was clearly not the case when Canadian customs officials considered the work to be merchandise instead of an original sculpture and wanted to levy a customs duty when the artwork was imported in Canada. (Danto, 1998)
becomes paramount and creativity manifests itself on different levels of the artwork.
How can we dissect the creative process? (Mazzola et al., 2011)10 traces this process back to a cycle of seven steps through which an artists moves, constantly revising his work. These seven steps are:
1. Exhibiting the open question: We start our quest with asking what we want to investigate.
2. Identifying the semiotic context: The question does not come alone. We need to find the surrounding context to be able to solve our question.
3. Finding the question’s critical sign or concept in the semiotic context. 4. Identifying the concept’s walls; What is limiting
5. Opening the walls
6. Displaying extended wall perspectives 7. Evaluating the extended walls
By going through these steps, the artist constantly rethinks his work. As he gets better acquainted with his work by questioning it constantly, he is able to create the most compelling work. Of course, at one point he will end the process but the goal of these seven steps is to go beyond one’s (imagined) limits. This process is not linear: the artist can go back and forth in this series. The question is if we can apply this way of questioning on sonification art. Before we do so, however, we first have to investigate the ontology of data in order to gain a better understanding of our source material.
10 Many theories on the creative process exist and it would take a separate book to discuss them all. In researching the creative process in music, Mazzolla’s theory on musical creativity seemed interesting as it was focused on music; hence I chose to develop my argument through his theory. This does not mean that other theories do not have a value; I merely made a choice in a broad spectrum of theories.
1.5 An Ontology of Data
Raw data is an oxymoron (Bowker, 2008) When discussing sonification, we have to be aware that the sounding matter is just the artefact at the end of a chain of operations. In order to understand the concept of sonification better, we thus need to disseminate the different parts that lead to that sounding artefact.
The common assumption would be to consider the data as our starting point. This however is erroneous: Data have to come from somewhere, there has to be a causal event to trigger the data: without cause, there are no data. Data thus do not come up out of nothing11, the data are related or can be related to a causal event. These causal events can be anything one wishes to investigate. It is there that we make our first choice: in choosing the event we want to investigate, we limit our search space. As such, we are not talking about the raw everything, but about a specific event/phenomenon. In the preceding section we divided the sonification process in four action stages. However, in order to come to the data fetching stage, we need to have a causal event. From that causal event we can distil data. The word is derived from the Latin datum, a past form of the verb dare (to give). As such, datum means ‘something given’12. (Merriam Webster, 2014) defines data as:
1. Factual information (as measurements or statistics) used as a basis for reasoning, discussion, or calculation <the data is plentiful and easily available — H. A. Gleason, Jr.> <comprehensive data on economic growth have been published — N. H. Jacoby>
11 Indeed, it would be erroneous to assume that data come out of nothing. (Bogost, 2015) contends that the rise of Big Data has lead to a kind of data-divine: whereas in the past we believed in a God, todays religion seems to be data-based. This is a misassumption: “data is [sic] created, not simply aggregated, and often by means of laborious, manual processes rather than anonymous vacuum-devices”. Even with a natural causal event such as earthquakes, the data-collection is a process initiated by a human. The data do not come together themselves.
12 This does not contradict the earlier statement that data has to be created: the causal event (whether it is natural or man-made) can be measured in an infinite number of ways. The event thus gives us data that we filter to get our desired dataset. (Butler, 2010), writing about friendship visualizations on Facebook, writes: “Visualizing data is like photography. Instead of starting with a blank canvas, you manipulate the lens used to present the data from a certain angle”. (We can substitute visualization with sonification).
2. information output by a sensing device or organ that includes both useful and irrelevant or redundant information and must be processed to be meaningful; 3. information in numerical form that can be digitally transmitted or processed.
While the premise of the Merrian-Webster definition is promising, the inclusion of the word information makes it incorrect: Information comes out of data. In order to get information, we need to interpret the obtained values. Vesna (Vesna, 1999) writes “Data is the raw form that is shaped and used to build architectures of knowledge exchange and as an active commentary on the environment it depends on—the vast, intricate network with its many faces.” Another, not so subtle citation comes from Clifford Stoll: “Data isn't information, any more than fifty tons of cement is a skyscraper” (Stoll, 1995). We should distinguish carefully between the building element and the building itself.
Taking in consideration the above remarks we can improve the Merrian-Webster definition as follows:
Data are values output by a sensing device or organ that must be processed to be meaningful.
Although the data may seem raw at the beginning of the study of them (as it is not information yet), they have been filtered already: Through inclusion/exclusion of certain data, the set is interpreted for a first time: the data collector attributes relevance to certain data while deeming other data of none importance. Daniel (Daniel, 2007) writes: “A collection [of data] is produced through processes of selection and differentiation— sorting, classifying, rejecting anomalies—making patterns”. Data thus become non-neutral: even before starting our argument, we have already attributed a certain degree of meaning to the data. The obtained dataset is subject to a second filtering: we read (interpret) the data and irrelevant data remain unused, they do not go to the next stage. After the filtering stage, the remaining (relevant) data are ready to be processed. At this stage, the rhetoric comes into full play: we want to tell a story with the data. Hence we need to find a mapping method, which conveys our message. Here the artist leaves his position as a technologist13 and has to make artistic, subjective decisions. These decisions can be located in the rhetoric system. Through rhetorics, we attribute meaning to the data.
13 It would be incorrect to call the technologist position a purely objective one: through the choices the technologist makes in including/excluding data, he occupies a non-neutral position.
The next step is to transform data into information. How do we get from data to information? Let us first define what information is. (Rosenberg, 2013) makes a clear distinction with fact, derived from the Latin verb facere: ‘that which was done, occurred or exists’. Fact also contrasts with evidence, coming from the Latin videre, to see. Rosenberg points at the important distinctions between the three terms:
“Facts are ontological, evidence is epistemological, data is rhetorical. A datum may also be a fact, just as a fact may be evidence. But, from the first vernacular consideration of corresponding, the existence of a datum has been independent of any consideration of corresponding ontological truth. When a fact is proven to be false, it ceases to be a fact. False data is data nonetheless.”
We can thus say that data receives its meaning through argument. It has no significance outside a rhetoric system. As rhetoric can change over time due to historical-contextual developments, the data can take on another meaning as well. (Rosenberg, 2013) writes: “… the meaning of data must always shift with argumentative strategy and context — and with the history of both.” Thus, data as such mean nothing but a stream of values: we construct a truth or reality with the data through rhetoric. If we apply this to data used in composition we can say that data put in the context of a composition means contextualizing it within the compositional argument set out by the composer: data get significance through the composition. We can visualize this flow as follows:
Figure 8 – The causal event gives birth to data, which have to be interpreted to become information.
In transforming data into information, we need to interpret them. We do this through a mapping process. This mapping process has some philosophical fundaments which we have to explore in order to understand this concept better.
1.6 Beyond Mapping: Artistic Issues
In section 1.2, we discussed sonification modes, which was a technical oriented discussion. In this section, we want to explore the philosophical concepts behind mapping.
As stated above, data has to be interpreted in order to become information. The interpretation happens through a mapping process: we translate the data, turning them explicit. (Daniel, 2007) defines mapping as follows:
“Mapping is intersubjective communication: the visualization or representation of data and information. The term “map” applies both to a clear representation, one capable of communicating intersubjectively, and the act of analysis required to create such a representation. A map has no single author. To map is to locate, to assign a correspondence. A map fulfills the functions of both record and statement—it is a history of the subject’s, or mapmaker’s, relation to that which is mapped and an act of communication with others who will interpret and use it. To map is to locate—but position is always “relative to . . . ” associative and perspectival. Intersubjective communication occurs when the meaning of data or information is accessible to, or established for, two or more subjects. In intersubjective communication, values and truths are inseparably intertwined. Interpretations and representations are produced dialogically—in cooperation with a “text” or data set.”
Mapping implies thus that everything is relative to something: we cannot see a data point in isolation; we have to consider it within the dataverse. This does not mean that the dataverse has to be considered in its totality: we can take a portion out of it and use that as our relational frame.
This definition takes into account that we have two sides to the story: not only the data matter, the interpreter matters as well. As stated before, in sonification there is a substantial difference between sonification and manifestation (the terms posited by Polansky) that we can now correlate to pragmatic and artistic sonification strategies. In fact, referring to data visualization, Manovich states that there are two options to visualize, that we can adapt to sonification as well. He makes a distinction between pragmatic and artistic visualization, stating that on one hand, there is pragmatic visualization, on the other hand artistic visualization. The pragmatic visualization is meant to be useful: making the unrepresentable representable. This is also called the visualization of the anti-sublime. The artistic visualization is made in the first place to think, to reflect about the subject. If the visualization is useful, that is just a mere side effect. The main goal of artistic visualization is “to map such phenomena into a representation whose scale is comparable to the scales of human perception and cognition”. The artistic visualization can then be called the visualization of the sublime. The visualization of the sublime has a unique role: to show us other realities embedded in our own, to show us the ambiguity always present in our perception and experience, to show us what we normally don't notice or don't pay attention
to (Manovich, 2014). Whereas Manovich speaks of the sublime, Xenakis compares the ‘discovery’ of the non-scientific a revelation: outside the scientific realm, we gaze with awe to what we discover, we do not know what constitutes it, yet we are struck by it.
When mapping data, we are confronted with the abundance (or even overload) of possible mapping choices: Why do we use the mapping we used? Certainly with the computer we can easily map data and try out different combinations. In doing so, and in continuation of the importance of process, it becomes an interesting element to discuss, to motivate why we use a certain mapping above another. It is not bad to have chosen an arbitrary mapping as long as we can motivate why we chose that mapping and not another. This does not mean that there has to be a degree of efficiency: it simply shows us why we deem one mapping to better convey our message than another. One can, simply said, map everything to everything. So why do we choose a certain mapping? These choices are embedded in the whole of the artwork: what do we want to tell and how do we want to experience what has to be told?
1.7 Storytelling with Data
After having defined sonification art, its source material (the data) and mapping, the next question that arises is why an artist would use sonification or: what makes sonification an interesting venture for the composer? We can distinguish three reasons:
1) The composer wants to convey a message related to the data through his music. 2) The artist believes that one can gain a deeper understanding of the data through the artwork.
3) The data could form an interesting source for creating compelling art. For example: a highly dynamic stock market could be translated as a wildly moving melody.
The first reason is not that far removed from programmatic music: the data serve as a source guide to the message. Like Berlioz’ Symphonie Fantastique that conveys a love story or Debussy’s Sunken Cathedral conveys an ancient Breton myth, one can choose sonification to convey a certain meaning that goes beyond the music. One cannot deny the