demand
P. Valverde 1, R. Serralheiro 2, M. Carvalho 3 , S. Shahidian 4
1 Grant researcher, project FCT- PTDC/AAC-AMB/115587/2009, e-mail: [email protected]
2 ICAAM (Instituto de Ciências Agrárias e Ambientais Mediterrânicas), Universidade de Évora, email: [email protected]
3 ICAAM (Instituto de Ciências Agrárias e Ambientais Mediterrânicas), Universidade de Évora, e-mail: [email protected]
4 ICAAM (Instituto de Ciências Agrárias e Ambientais Mediterrânicas), Universidade de Évora, e-mail: [email protected]
Abstract: This study evaluates climate change tendencies over several climatic parameters observed in the Guadiana river basin, south Portugal and its potential impacts on crop water and irrigation requirements. Parameters analyzed were annual rainfall and its seasonal distribution, temperature and evapotranspiration, collected from available regional meteorological data from a 46-year period (1963-2009). The impacts of climate change in Guadiana basin’s irrigated crops was studied running long-term soil water balance simulations to evaluate the trend of irrigation water requirements considering maximum potential yield. The simulations were focused on a set of locally representative crops including wheat, maize, olive trees, vineyards and citrus. Climate data analysis showed an increase in average annual air temperature, and declining annual rainfall, with an increasing irregularity in monthly rainfall distribution. As a consequence of climate change, estimated crop irrigation requirements simulated in the considered period illustrate a rising tendency pattern, although different statistical significance was found amongst crops. Out of the studied crops, those with a typical high water demand, such as maize, and crops depending more directly on soil water content accumulated from rainfall during the winter season, such as wheat, both show a more significant tendency to increase their irrigation demands, while crops well adapted to the Mediterranean climate, such as olive trees, remained more conservative in their future irrigation water demands.
Key words: Climate change impacts, crop water demand, irrigation, Guadiana river basin, water resources
1. INTRODUCTION
Climate change is a process defined by significant modifications in the statistical distribution of weather variables at global scale, due not only to natural processes inherent to solar activity and related to the dynamics of atmospheric and oceanic circulation, but also induced by human activities affecting the radiation balance of the Earth, mainly by the emission of greenhouse gases. The evidence of global climate change, based on historic weather data indicate that the average air temperature has risen 0.8°C since 1880, and two thirds of that warming occurred after 1975 (Hansen, et al., 2010).
The consequences of global warming impacts on agriculture, water management and ecosystems can vary regionally around the globe, but at this time, particular concern is focused in the Mediterranean climates, positioned in the transition zone between the arid climate of North Africa and the temperate climate of central Europe. Characterized by desert-climate transition features, the Mediterranean region is potentially highly vulnerable to existing adverse trends of warming and rainfall reduction, and is likely to be the earliest European region to experience severe economical and sociological consequences of climate change.
One of the most comprehensive reports on climate change in Portugal, SIAMII (Santos, et al., 2006), underlines the most relevant climate change characterization in Portugal, namely describing mean air temperature rise and identifying a decreasing trend in precipitation, most noticeably during spring. It was also observed that the 6 warmest years in the period between 1931 and 2000 occurred in the last 12 years of the twentieth century. A recent example of the occurrence of drought was the hydrological year 2004/2005, as one of the most severe and regionally widest on record in Portugal (Botelho, et al., 2010). More recently, within the first 5 months of 2012, the Portuguese territory experienced a situation of severe drought due to low rainfall in the winter months. The regional increase observed in average air temperature has other consequences beyond the direct impact on
2
crop water consumption, namely in soil erosion related effects such as decreasing organic matter contents, particle aggregation, permeability, and drought-induced consequences related to reduction of ground cover, all contributing to enhance the processes of desertification. These soil degradation processes, once triggered, are persistent and very difficult to reverse with regular mitigation actions, reducing overall soil water storage capacity, increasing surface runoff and causing a significant loss of fertility. The climate trends are also causing more frequent occurrence of extreme weather events such as droughts, floods and storms that in recent years have arisen more frequently, producing and adding up very significant losses in agriculture.
2. MATERIALS AND METHODS
2.1 Description of the study area
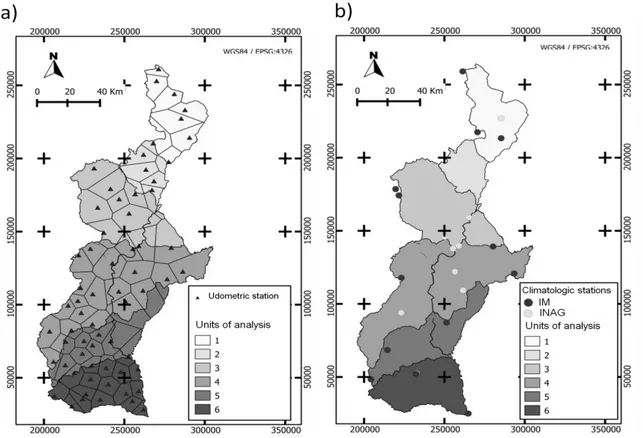
The basin of the Guadiana has a total area of 66800 km², of which about 17% (11580 km²) in Portugal. Due to the extent of the Guadiana basin, the analysis of climatic variables was performed separately into six units of analysis (UAs), defined by the main sub-basins of the tributaries of the Guadiana river and relevant adjacent areas. This subdivision into smaller units of analysis or polygons shares its spatial definition and meteorological dataset, with previous work elaborated by the Forecasting and Drought Management System (SPGS, 2009, 2010; Vivas, et al., 2010).
The division of the basin of the Guadiana River in six UAs was implemented to allow a better spatial resolution of climatic heterogeneities and thus provide a better assessment of the crop water use impacts of climate change in the different sub-basins of the Guadiana, including a considerable part of Alentejo and Algarve regions. These units of analysis have a different spatial distribution of crops and several local geographic features affecting microclimate, which justify a separate analysis of irrigation requirements to study the relative impact of observed climate trends on each crop.
Given the diversity of crops grown under irrigation in the basin of the Guadiana, it was necessary to define a limited set of crops that could characterize the basin’s crop reference in order to estimate the effects of climate change on irrigation management in subsequent analysis. Therefore, five crops were chosen, representing the current crop-footprint with relevant social and economic importance: corn, winter wheat, olive groves, vineyards and citrus. Table 1 summarizes statistic data for each unit of analysis.
Table 1. Study area summary data for each unit of analysis defined in Guadiana basin including the distribution of total used agricultural area (UAA), average annual precipitation (P) and irrigated crop area in the period
(1963/2009);(Sources: INE, 2009; INAG/SNIRH,2009)
Units of analysis (Guadiana sub-basins)
Area
(km2) (mm) P (kmUAA2) Maize(ha) Wheat(ha) Olive trees(ha) Vineyard(ha) Citrus(ha)
1 (Caia/Xevora) 1376 619 1047 1872 1026 3510 374 89 2 (Lucefecit) 753 617 575 390 527 572 1061 32 3 (Degebe, Álamos) 2351 535 1777 1382 1128 3802 3902 76 4 (Ardila) 3857 503 2998 1459 158 18407 2463 222 5 (Chanca) 1664 479 1170 121 11 2411 137 43 6 (Ribeiras do Algarve) 1581 596 475 6 10 47 63 1366 Total 11581 --- 8042 5230 2860 28749 8000 1828
Winter wheat, vineyards and olive are traditionally rainfed crops. However, irrigation is being widely adopted as these crops can improve yields significantly under irrigation, mitigating the effects of the Mediterranean’s characteristic drought periods and uneven distribution of rainfall.
Maize is characterized by being one of the most representative field crops in irrigated agriculture, with a high return potential due to increasing market demand. This crop has potential
of the Guadiana, associated to the Alqueva dam infra-structure.
Citrus is particularly important in the Algarve region of the Guadiana basin (UA 6), standing out as the main irrigated crop. However, this crop occupies relatively small areas in the remaining units of analysis, mostly due to its high vulnerability to winter frost events.
2.2 Weather data
The weather information that characterizes the Guadiana basin was collected for the period between 1963 and 2009, using the information from both the INAG (SNIRH) network and the Instituto de Meteorologia (IM), to mutually fill the data elements missing in each information source. This weather data was previously used in the agronomic reports of the System of Prevention and Drought Management (Serralheiro et al., 2010) to provide long-term averages of crop irrigation requirements, and has been now set to perform a more detailed analysis to determine their trends in the context of climate change and outline the prospects for future crop water demand. a. shows the location of the udometric stations used to characterize the precipitation and also shows the representation of the polygons obtained by the Thiessen´s method, defining the areas used for the weighted precipitation in each analysis unit. b. shows the location of the meteorological stations that provided the source for both rainfall and air temperature data.
Figure 1. Guadiana basin´s weather data sources; a) Rainfall data; b) Rainfall and air temperature data.
2.3 Estimating Crop Irrigation Needs
Crop irrigation requirements were determined by the ISAREG model, developed at the Instituto
Superior de Agronomia (ISA) by Teixeira and Pereira (1992), which is based on the FAO
methodologies (Doorenbos and Pruit, 1977; Doorenbos and Kassam, 1979). The model allows estimation of irrigation needs through the implementation of a soil water balance algorithm, using
4
as inputs the effective precipitation (Pef), reference evapotranspiration (ETo), soil data and the characteristics of crop growth throughout the crop cycle (Teixeira, 1994).
The water resulting from rainfall is partially lost by runoff. Thus, the effective precipitation depends on local topography, soil texture and leaf interception by vegetation, and constitute the effective fraction of the total rainfall contributing to both soil water storage in the crop root zone and deep drainage. The effective precipitation (Pef) used as input in the ISAREG model was determined, for each unit of analysis, using the method defined by the USDA Soil Conservation Service (USDA-SCS) (Clarke, 1998), as defined in eq.(1):
Pef = (Pt (125-0.2 Pt)) / 125 ;(Pt < 250 mm) (1) Pef=125+ 0.1 Pt ;(Pt >= 250 mm)
,where Pt is the total precipitation (mm). Total precipitation was quantified as the weighted-average precipitation from the data collected by the udometric stations located in each unit of analysis using Thiessen’s polygons method.
Historic weather data collected in the Guadiana basin did not have records of all the variables needed to calculate ETo using the FAO-Penman-Monteith method. Given these data limitations, the (HS) Hargreaves and Samani (1985), equation was used, requiring only monthly values of air temperatures and solar radiation, which, when not available, may be replaced by extraterrestrial radiation calculated as a function of latitude and day of the year. Using minimum climatological data, the Hargreaves-Samani ETo for semi-arid locations can be estimated using eq. (2):
ETo = 0.0023 (Ra) (Tmax-Tmin)1/2 (Tmed+17.8) (2)
Ra is the average extraterrestrial radiation (mm day-1) and Tmax, Tmin and Tmed, are respectively the maximum, minimum and average air temperatures (ºC). The ETo results obtained by the Hargreaves-Samani method were compared by correlation with those obtained by the FAO-Penman-Monteith method in three recent (starting 2001) meteorological stations integrating the
Centro Operativo e de Tecnologia de Regadio (COTR) network in Guadiana (Serralheiro, et al.,
2010), yielding a coefficient of determination of 0.97. Consequently, the HS method was considered suitable for ETo estimates at the study site as this method provides values very close to those obtained by the FAO-Penman-Monteith
For annual crops, it was considered as input for the ISAREG model a soil depth of 1 m with total usable water capacity of 100 mm, while for permanent crops soil conditions assumed a depth of 1 m and 200 mm usable water capacity. The water balance algorithm in the ISAREG model relies on crop evapotranspiration (ETc) and the effective precipitation to determine irrigation requirements within a ten-day time resolution. ETc (mm) is generally defined with eq. (3) as a function of ETo (mm) and a crop stage-dependent Kc coefficient, to account for the crop´s evapotranspiration rate for each growth stage in non-limiting water conditions.
ETc=Kc ETo (3)
For crops that do not cover the ground evenly, and where available crop coefficients require further correction for coverage rate, ETc can be affected by a reduction coefficient Kr, which defines the fraction of canopy or leaf covered area, resulting in eq. (4):
ETc=Kc.Kr.ETo (4)
For olive trees, the adopted crop coefficients were defined by Pastor et al. (1996) for the province of Cordoba in Spain, which, considering the climate similarities and geographical proximity, assumedly provide a representative behavior of olive groves in the Guadiana basin
coefficient Kr as:
Kr= 2 Sc/100 (5)
where Sc (eq.6) is the percentage of ground covered by the canopy of trees with D representing the mean diameter of the crown (m) and N the density of plants (trees ha-1).
Sc = ( π .D2. N) / (4/100) (6)
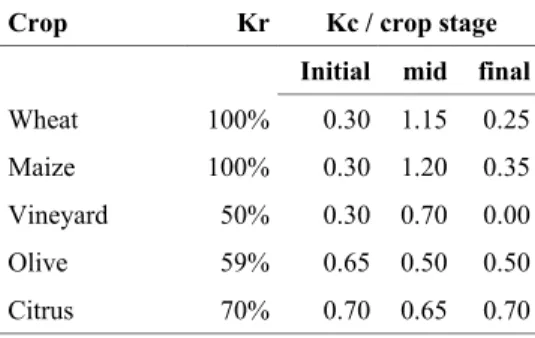
For the others crops considered, the Kc coefficients were closely based on those proposed by FAO for the Mediterranean conditions (Allen, et al., 1998), albeit introducing adjustments to reflect the local crop development stages, management, and also considering, where applicable, the appropriate Kc for the prevailing crop densities. Table 2 lists the crop coefficients and ground cover reduction coefficients used by ISAREG to estimate the annual irrigation requirements under non limiting water-conditions, between the years 1963 and 2009. The resulting output was further evaluated to determine the trends and statistical significance for each individual analysis unit.
Table 2. Crop coefficients and ground cover reduction coefficients considered in the ISAREG model
Crop Kr Kc / crop stage Initial mid final
Wheat 100% 0.30 1.15 0.25
Maize 100% 0.30 1.20 0.35
Vineyard 50% 0.30 0.70 0.00
Olive 59% 0.65 0.50 0.50
Citrus 70% 0.70 0.65 0.70
2.4 Statistic trend test methodology
Trend analysis of meteorological series presents considerable difficulties, mainly because climate variables often exhibit short term fluctuations or cycles over time, overlapping the main subject of analysis: long term trend. In fact, the greatest challenge in the analysis of climate change and related effects linked to crop irrigation requirements is to outline the predominant trend due to the presence of the above-mentioned fluctuations that do not relate to the long term trend. Although the climate short term trends and variation patterns are also worthwhile subject of analysis, for the purposes of this study we focused exclusively on the long-term trends.
The characterization of trends on the various time series was performed using simple linear regressions, based on the least squares method. The corresponding slope resulting from the linear adjustment equation was used to quantify the rate of variation over time, but does not establish the significance of the trends identified. To determine the significance of the long-term trend of time-series data, we used Mann-Kendall test (MK), which is a method defined by Mann (1945), widely and successfully used for the analysis of trends in time series of hydrological and climatic variables (Hipel and McLeod, 2005). Mann-Kendall test is defined by the following equation for a series of n elements, where x is the sequential data series:
n-1 n
j i i=1 j=i+1
S=
Sgn(x -x ) (7)6 j i j i j i j i 1 ; x x Sgn(x -x )= 0 x = x 1 x < x > ; ; (8)
A positive value of S describes a positive trend in the series, while a negative value of S indicates a negative trend. Considering a large sample, the absence of identical consecutive values and assuming that the null hypothesis H0 corresponds to an inexistent trend in the data series, the statistic S follows a normal distribution with zero mean ( E(S) = 0 ), and variance defined by:
Var(S) = (n (n-1) (2n+5)) / 18 (9)
The significance of the statistic S can be therefore tested with:
S-1 ,S>0 Var S Z t = 0 ,S=0 S+1 ,S<0 Var S (10)Adopting a significance level of α = 0.05 (confidence level of 95%), the null hypothesis H0 will not be rejected when -1.96<Z(t)<1.96, where 1.96 corresponds to the critical value of the normal distribution for a two-sided test of α = 0.05.
The Mann-Kendall trend significance analysis was performed with the R statistical software (R Core Team, 2012) and the module "Kendall" (McLeod, 2011), considering p < 0.05 as the condition for rejecting the null hypothesis.
3. RESULTS AND DISCUSSION
3.1 Climate trends
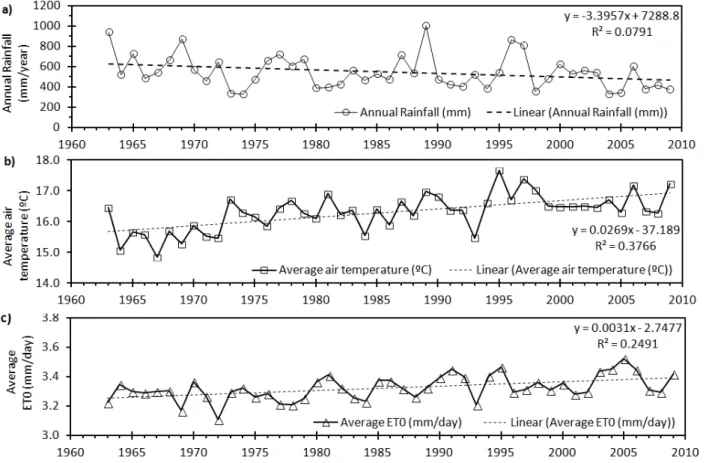
Figure 2a. shows the cumulative average annual rainfall aggregating the six units of analysis. The precipitation describes a statistically significant decreasing trend (p<0.05) in the time series represented. The slope that results from fitting a linear function indicates a decrease of nearly 3.4 mm year-1 in the average annual rainfall in the basin of the Guadiana, constituting a total decrease of 156 mm in the average annual rainfall over the period analyzed (46 years). However, the poor coefficient of determination resulting from the annual rainfall data (R2 =0.0791) indicates that a regression line does not fit the data well, highlighting the high variability of rainfall in the region. The average air temperature recorded at the group of the six analysis units considered in the Guadiana basin is presented in Figure 2b, showing an increase rate of nearly 0.3ºC per decade. Figure 2c depicts the daily average ETo (mm day-1) and its trend over the 46 years analyzed. It should be noted that the ETo, determined with the HS method, depends not only on the average air temperature, but also on the monthly temperature extreme values (minimum and maximum). As a result, the trends of temperature and ETo over time are, although coherent, fairly different in their slope. For both air temperature and ETo data, R2 yielded respectively 0.3766 and 0.2491, indicating that these parameters have lower variability over time than rainfall.
The evolution of the monthly distribution of rainfall is very important to define the impact of climate change in the pattern of replenishment of both soil water status and water storage on the infra-structures that supplies water for irrigation. Figure 3a. depicts the average monthly distribution of annual precipitation, confirming the importance of winter and autumn seasons as major contributors to annual accumulated rainfall. Figure 3b. shows that the months of January and February have the sharpest decline of monthly precipitation over the period analyzed.
Figure 3. Average rainfall distribution pattern and trend at Guadiana basin observable on a 46-year period (1963-2009); a) average monthly distribution(% annual rainfall /month); b) monthly rainfall trend (mm).
3.2 Estimated crop irrigation requirements
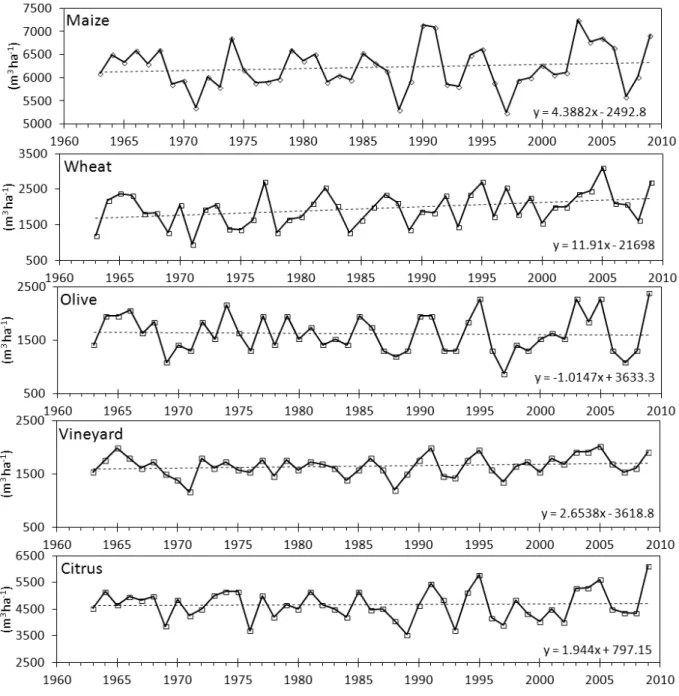
At basin-scale, all crops, with the exception of olive trees, clearly show an upward trend in irrigation requirements to maintain ETc at the optimum levels throughout the crop cycle (Figure 4). Maize and citrus are some of the most water demanding crops, so the resulting trend over time is particularly important, as it affects more perceptibly the total volume of water needed for irrigation.
8
For maize, the linear trend slope of irrigation requirements indicates an average increase of 4.4 m3 ha-1 per year over the period considered. For the 46 years analyzed, the annual irrigation needs in maize represents, on average, an increase of about 202 m3ha-1.
Winter wheat is the crop that exhibits a higher increase of net irrigation requirements over the analyzed period, which confirms the impact of the significant negative trend observed on rainfall during the winter season and early spring (Figure 3b) in the Guadiana basin.
The vine is the crop that showed lowest amplitude in the oscillations of its estimated irrigation needs. Yet, it describes a distinctive upward trend.
Olive stands out as the only crop revealing a basin-level downward trend in the irrigation requirements, mostly because its water demands are more dependent on rainfall in mid-Spring and late Autumn, which have not been significantly affected by decreasing trends in the studied period.
Figure 4. Evolution of crop annual net irrigation requirements and related trends (m3 ha-1)
Table 3 summarizes the trends of the estimated net irrigation requirements of the studied crops for each unit of analysis (UA) and also their basin-scale average during the studied 46 year period. The trends were determined by applying a linear regression to the annual irrigation requirements (m3 ha-1) obtained by the ISAREG model.
Crop UA1 UA2 UA3 UA4 UA5 UA6 Average Maize -3.6 +6.1 +6.8 +14.4 (*) +10.0 (*) -7.4 +4.4 Wheat +0.6 +15.5 +14.8(*) +35.0 (*) +11.7 -6.0 +11.9 (*) Olive -7.6 +2.9 +3.3 +4.5 -1.7 -7.5 -1.0 Vineyard +0.1 +3.4 +4.9(*) +4.4 (*) +3.8 -0.7 +2.7 Citrus -3.2 +3.1 +11.0 +10.8 +2.8 -12.8 +1.9
Based on the results shown in Table 3, it can be stated that the water-balance estimated irrigation requirements have increased for the majority of the studied crops within the Guadiana basin with the notable exception of the analysis unit UA6, corresponding to the Algarve region, that reports an overall downward trend in crop irrigation requirements, although without statistical significance.
The inland areas of the Guadiana river basin, represented by the analysis units 3, 4 and 5, show statistical significant growth trends in the estimated irrigation needs for maize, wheat and vine, although only wheat has a statistically significant increase in the average irrigation requirements resulting from the full set of analysis units considered in the Guadiana basin.
4. SUMMARY AND CONCLUSIONS
The trends identified in the climatic series in the region of Guadiana river basin (1963-2009) indicate an increase in average air temperature, a reduction in annual rainfall and changes in the seasonal distribution of precipitation. These trends, associated to the increase of water use in irrigation to obtain maximum yield, can compromise the future availability of water resources and cause an intensification of desertification processes, which demand more effective measures to mitigate soil erosion and degradation. A general increase in irrigation needs was identified for the main representative crops in the selected analysis units, though, at river basin scale, only wheat has shown a statistically significant increase. Olive trees, a crop well adapted to the Mediterranean climate, was the only crop with an overall slight decreasing trend in irrigation requirements, indicating that observed climate trends and changes in the rainfall seasonality did not produce significant changes in this crop’s estimated irrigation requirements.
The results also show that the Guadiana basin has a noticeable heterogeneity in crop irrigation demand trends between units of analysis. The analysis units, located in the Guadiana basin’s inland areas (UAs 2,3,4), predominantly plains, show a significant increase in estimated irrigation water requirements for the major crops, whilst the North and South units of analysis (UA1 and UA6) don’t reveal a well defined trend. It is reasonable to assume that the microclimatic influence related to topography (UA1) and proximity of the sea (UA6) can partially contribute to locally dissipate some of the negative effects of climate change effects on crop water demand.
The mitigation measures to be taken to offset climate change impacts on agriculture must also involve strengthening measures for soil conservation, appropriate choice of crops and actions to improve irrigation efficiency using automated systems and allowing real-time irrigation management based on soil water status, and atmospheric solicitation. The optimization of irrigation application efficiency is crucial for the rational use of water in the growing prospect of scarcity of water resources, because a 1% improvement in water use efficiency in crops with higher water consumption, such as maize, may save as much as 70m3 of water per hectare year-1.
10
ACKNOWLEDGEMENTS
This research was elaborated under the FCT research Project ref. PTDC/AAC-AMB/115587/2009 “Desenvolvimento de uma Metodologia para a Integração dos Efeitos das Alterações Climáticas na Gestão de Recursos Hídricos para uma Bacia Hidrográfica Portuguesa”.
REFERENCES
Allen R., L. S. Pereira, D. Raes, M. Smith, 1998. Crop evapotranspiration: guidelines for computing crop water requirements. FAO Irrigation and Drainage, Paper No. 56, Rome, Italy, 300 pp.
Botelho, F., Ganho, N., 2010. Dinâmica anticiclónica subjacente à seca de 2004/2005 em Portugal Continental. Departamento de Geografia e Centro de Estudos de Geografia e Ordenamento do Território (CEGOT), Faculdade de Letras, Universidade de Coimbra .VI Seminário Latino Americano de Geografia Física, II Seminário Ibero Americano de Geografia Física.
Clarke, D., 1998. CROPWAT for Windows: User guide. FAO, Rome. COTR, Centro Operativo e de Tecnologia de Regadio: www.cotr.pt
Doorenbos, J., Pruitt W.O. 1977. Guidelines for predicting crop water requirements.FAO Irrigation and Drainage Paper 24. FAO. Rome.
Doorenbos, J., Kassam A. 1979. Yield response to water. FAO Irrigation and Drainage Paper No. 33. FAO. Rome
Hansen, J., R. Ruedy, Mki. Sato; K. Lo, 2010. Global surface temperature change, Rev. Geophys., 48, RG4004, doi:10.1029/2010RG000345.
Hargreaves G.H., Z.A. Samani ,1985. Reference crop evapotranspiration from temperature. Applied Engineering in Agric. 1:96-99. Hipel, K.W., McLeod, A.I., 2005. Time Series Modeling of Water Resources and Environmental Systems. Electronic reprint of book
orginally published in 1994. http://www.stats.uwo.ca/faculty/aim/1994Book/.
INAG. 2002. Plano Nacional da água, Instituto da Água, I.P. (INAG, I.P.). Ministério do Ambiente.
INAG, 2000. Plano de Bacia Hidrográfica do rio Guadiana. Instituto da Água, I.P. (INAG, I.P.). Ministério do Ambiente. INAG, 2009. SNIRH - Sistema Nacional de Informação de Recursos Hídricos. http://snirh.pt
Instituto de Meteorologia (IM, I.P.), 2009. http://www.meteo.pt
Instituto Nacional de Estatística, (INE, I.P.), 2009. Recensamento Agrícola 2009 Mann, H.B., 1945, Nonparametric tests against trend, Econometrica, 13, 245-259
McLeod, A. I., 2011. Kendall: Kendall rank correlation and Mann-Kendall trend test. R package, version 2.2. http://CRAN.R-project.org/package=Kendall
Pastor, M., Castro, J., García-Ortiz, A., Mártinez, J., Mateos, L., Navarro, C., Orgaz, F. Saavedra, M., Vega, V.,1996. Manejo del olivar com riego por goteo, Informaciones tecnicas Nº41/96, Direccion General de Investigacíon y formacíon agraria. Junta de Andalucia. Consejería de Agricultura y pesca.
R Core Team, 2012. R: A language and environment for statistical computing. R Foundation for Statistical Computing, Vienna, Austria. ISBN 3-900051-07-0, URL http://www.R-project.org/.
Santos, F.D., Miranda, P., 2006. Alterações Climáticas em Portugal. Cenários, Impactos e Medidas de Adaptação - Projecto SIAM II, Gradiva, Lisboa.
Serralheiro, R., Carvalho, M., CorteReal, J., Toureiro, C., 2010. 1ª Fase do Sistema de Previsão e Gestão de Secas (SPGS) -Relatórios 1 a 4, 2009 e 2010, ICAAM, Universidade de Évora.
Teixeira, J.L., Pereira, L.S, 1992. ISAREG, an irrigation scheduling model. ICID Bulletin, 41(2): 29-48
Teixeira, J.L., 1994. ISAREG – Manual do Utilizador. Instituto Superior de Agronomia, Universidade Técnica de Lisboa. Lisboa Vivas, E., Maia, R., 2010. A Gestão de Escassez e Secas Enquadrando as Alterações Climáticas, Revista Recursos Hídricos, Vol. 31,
Nº 1, 25-37, Março, APRH, ISSN 0870-1741.
Vivas, E., Silva, C, Correia, L., Maia, R.,2010. Definição de unidades de análise para prevenção, avaliação e gestão de situações de seca. Aplicação ao caso da bacia do rio Guadiana, em Actas da Conferência 10º Congresso da Água ―Marcas d’Água, Algarve, Março de 2010, ISBN 978-972-99991-9-2.