1 INTRODUCTION
Performance-based earthquake engineering (PBEE) needs adequate methods of analysis to determine the structural behaviour and the definition of quantifia-ble targets to measure performance. Considering that performance targets can be established for demand levels ranging from linear elastic behaviour up to the development of structural collapse, nonlinear dy-namic analysis is the logical choice to adequately quantify structural behaviour under earthquake load-ing. However, structural performance associated to a certain damage limit state is influenced by several sources of uncertainty that need to be considered by the PBEE framework. The earthquake record-to-record variability of structural demand and the un-certainty associated to the randomness of the materi-al properties are some of the sources of uncertainty commonly addressed in past research. However, the effect of making different assumptions (based on empirical evidence) for the shape of the numerical modelling of the structural behaviour and the param-eters it involves is generally overlooked (Mitra 2008). After selecting a given numerical modelling approach, the uncertainty is introduced by varying some of the basic parameters involved in the model, such as the maximum compressive strength of the concrete or the monotonic envelope of the tensile strength of the reinforcing bars. The proposed paper, analyses the impact of making practical decisions
regarding the selection of the material constitutive models and the element formulations in the context of the seismic analysis of reinforced concrete (RC) members. By using experimental results from 2 RC columns tested by Rodrigues et al. (2013) as a refer-ence, both in terms of local and global response, 100 combinations of material models were analysed. These combinations were defined not only by vary-ing the shape of the constitutive models and their hysteretic rules, but also by varying the specific ana-lytical relationships which define the parameters in-volved in the uniaxial material laws.
The study was divided in two stages. The first stage analyses the performance of the 100 fibre modelling combinations for the numerical simula-tion of moment-curvatures evolusimula-tions obtained from the experimental tests. In the second stage, the nu-merical analysis of the total RC member was per-formed which was then also compared to the same set of experimental results. Different distributed plasticity models were considered in this stage, with particular attention being given to strain localization effects that are generated by the softening of the sec-tion level response. Hence, in this case, both the el-ement modelling strategy and the material modelling choices are considered simultaneously. To analyse the level of uncertainty associated to the different modelling options, comparisons are made between the characteristics of the errors found for the sec-tional and the element responses.
Epistemic uncertainty of the structural response of RC members under
cyclic loading due to different material modelling choices
N. Pereira, X. Romão & R. Delgado
University of Porto - Faculty of Engineering, Porto, Portugal
ABSTRACT: Performance-based earthquake engineering methods rely heavily on nonlinear dynamic analysis to determine structural performance. Given the significant number of existing structural and material model-ling approaches, the epistemic uncertainty associated to the definition of an analytical model must be quanti-fied, since it will have a considerable effect in the demand and capacity values obtained from the analysis. In this context, the proposed study addresses the quantification of the uncertainty associated to different model-ling choices that should be accounted for when developing the analytical model of the structure. The study analyses the performance of different distributed plasticity models of reinforced concrete columns, consider-ing different modellconsider-ing choices for the constitutive materials. The comparison of the numerical results ob-tained with experimental data highlighted the impact of the modelling options. Generic error values are pre-sented for each modelling strategy and for different structural demand parameters. General statistical values for the overall variability are also summarized and practical considerations regarding key issues are presented.
2 LOCAL AND GLOBAL RESPONSE OF RC MEMBERS CONSIDERING DISTRIBUTED PLASTICITY FRAME ELEMENTS
The nonlinear cyclic analysis of RC members can be performed using different types of models which have been developed over the years and that require different levels of complexity in terms of modelling, analysis and interpretation of the results. From a practical point of view, frame models constitute an interesting option since, in Earthquake Engineering, the number of analyses that are required to assess the behaviour of a structure usually demands for a sim-ple approach. Nevertheless, its level of accuracy needs to be considered, since the simplicity of the model may involve inherent simplifications and omissions that can have a strong impact in the seis-mic demand results. Within the scope of frame mod-els, different classes can also be found, depending on the failure mechanisms that are included in the element formulation. Two commonly employed formulations for the modelling of beam-column el-ements are lumped-plasticity models, defined by nonlinear springs located at the member ends con-nected, in series, with an elastic element, and dis-tributed plasticity models, which allow for the spreading of the plasticity along the entire length of the member. To analyse structural behaviour using such methods, some decisions must be made by the analyst in order to define the main properties of the numerical model. The fact that multiple models of lumped plasticity and distributed plasticity are avail-able leads to a large number of modelling possibili-ties with different characteristics, whose effects may not be considered during the analysis process. In the present paper, only distributed plasticity models (re-lying on the Euler-Bernoulli hypothesis) with fibre models modelling the structural behaviour at the sec-tion level are analysed.
By considering distributed plasticity models, two main factors must be kept in mind when selecting the properties of the model. Since the element re-sponse relies on the numerical integration of the contribution of individual sections placed at specific locations within the element, the response will de-pend on the properties of the sectional response, which is obtained by integrating the behaviour of the different fibres represented by a uniaxial constitutive response material. Therefore, one source of uncer-tainty is associated to the uniaxial constitutive mod-els selected for the materials. This selection sets the type of interaction between the materials which is particularly important for the larger levels of defor-mations that control the flexural capacity of the member. For example, when considering the behav-iour of quasi-brittle materials such as RC, the accu-rate modelling of the softening of the sectional re-sponse is strongly dependent on the material models considered. Furthermore, to determine the section
level response that is used to compute the member response also, element-level displacement of force shape functions are also required. These can be de-fined according to classic displacement-based (DB) or to the more recently developed force-based (FB) formulations Numerical issues associated to strain localization when modelling softening behaviour us-ing different model formulations and number of in-tegration points (for the case of FB elements), and mesh characteristics (for the case of DB elements) were analysed by Calabrese et al. (2010).
2.1 Hardening and softening sectional response and constitutive materials of RC members The flexural response of RC members usually con-centrates damage at the ends of structural members, where sections with larger deformations are located. At these sections, the interaction between axial and bending deformations is combined by the fibre mod-els to define the sectional response. Hence, the member damage and the behaviour degradation will depend on the capacity of the material models to capture and represent these response characteristics.
There is a complex interaction between several physical mechanisms affecting the behaviour of RC members. Some of these effects result from the in-teraction between the materials, the element stresses and the boundary conditions, while others depend on the behaviour of the constitutive materials. The first class of physical mechanisms includes the effects of the slippage of reinforcing bars, the strain penetra-tion, fixed end rotations, bar pull out, among others. The interaction between flexural and shear defor-mations may also influence the behaviour of the member, depending on its geometry. These factors represent additional sources of uncertainty and were not explicitly considered in the distributed plasticity analysis considered herein.
As referred, the characteristics of the behaviour of the materials have a key role in the definition of the sectional behaviour. RC sections can exhibit dif-ferent types of responses depending on the amount of axial loading they may withstand. For high levels of axial load ratios, softening of the response after yielding can be expected, particularly if second or-der effects are included. For intermediate levels of axial loading, a composite behaviour will be tained since hardening of the response will be ob-served after yielding up to a certain level of defor-mation (capping point) after which the softening branch of the response will take over. For low levels of axial load, the response will only exhibit a hard-ening behaviour if the deformation achieved does not affect the material stability.
These types of section level behaviour connected to the level of axial load only occur if the section has the ability to sustain the demand solicitations.
Par-ticularly, the 3 following characteristics of the mate-rial response can be seen to control the referred be-haviour types: 1) The confined concrete capacity and ductility, which depend on the amount of transversal reinforcement of the section, will have a decisive ef-fect on the cyclic degradation of the response since the crushed fibres will decrease the capacity of the section. Therefore, if the model includes a confine-ment rate higher than the actual one, the softening response may not be obtained. 2) The consideration of a reduction in the cyclic response of reinforcing bars when compared to that of monotonic behaviour may also induce response degradation which may not be obtained when simplified models are used. 3) The buckling of the reinforcement due to the limited amount of transversal reinforcement. This effect is particularly important in older RC columns with no seismic design. In these cases, buckling may occur not far from the yielding point. The occurrence of buckling induces transversal displacements in the middle of the buckling length of the bar, thus gener-ating the spalling of the cover concrete before the crushing of this layer of unconfined concrete (locat-ed on the outer side the stirrup).
It must be emphasized that the global response of RC members results from the interdependency and interaction between these 3 effects and the materials. Usually, these 3 characteristics do not occur in a specific order, particularly when low to intermediate levels of axial load are involved, such as in the col-umns considered herein. Therefore, the above men-tioned capping point can be defined as the point where the softening behaviour begins. In the present study, the capping point was defined according to the experimental data and was used to separate dif-ferent damage limit states. The capping point was considered to correspond to the experimental dis-placement (and the corresponding curvature for sec-tional analysis) leading to full spalling of the cover. 3 DESCRIPTION OF THE PROPOSED STUDY The proposed study analyses the level of variability that is obtained when performing the nonlinear anal-ysis of RC columns under cyclic loading using dis-tributed plasticity models. In particular, the main ob-jective is to understand the effect of considering different material models to represent the uniaxial behaviour of the materials. Although several distrib-uted plasticity models can be found in the literature, in addition to different regularizing techniques to avoid issues of strain localization, an extensive and detailed analysis of the effect of the member formu-lations is not within the scope of the current study. Instead, the proposed study analyses the changes in the response of the member when using material models with characteristics extracted from literature references. As mentioned before, the ability of the
sectional response to represent key aspects of the damage may induce different softening rates, which may contribute to, or compensate, the strain localiza-tion effects. Still, due to the properties of the exper-imental data considered in the study, 3 different member models were also considered to assess the effects of different material modelling choices. 3.1 Experimental tests considered
The presented study addresses the analysis of two columns whose experimental results are those ob-tained referred by Rodrigues et al. (2013). The se-lected cases are those referenced as N01 and N05, and correspond to experimental tests of RC columns subjected to uniaxial cyclic loading under constant axial loads. The numerical modelling of the cross sections and of the material properties were defined according to the experimental values. To reflect a practical behaviour simulation case, only the con-crete compressive strength and the tensile properties of the steel were based on experimental values. De-tails of the test results, the test setup and the material properties can be found in (Rodrigues et al. 2013). The curvature and displacement evolutions used in the analyses are those from the experimental tests.
In a first stage of the study, the curvature evolu-tions were applied to the fibre models of the secevolu-tions to determine the corresponding moments by equilib-rium conditions. Then, using the displacement evo-lutions, the complete columns were analysed consid-ering a given element modelling option. All the calculations were performed using OpenSees. Figure 1 presents the layout of the considered cross sections and the corresponding level of normalized axial load involved in the tests.
To obtain an objective comparison between exper-imental and numerical results, the comparative anal-yses were performed for specific behaviour ranges separated by two limit states connected to the per-formance of RC members. These comparisons were carried out in terms of peak moments for specific levels of curvature, in the case of the sectional anal-ysis, and in terms of peak base shear for each cycle, in the case of the member analysis. The comparisons were performed using the ratios χM and χF, which
represent the Mnum/Mexp and Fnum/Fexp ratios,
respec-tively, where Mnum and Fnum are the numerical values
obtained for the peak moment and peak base shear, and Mexp and Fexp are the experimental values of the
peak moment and peak base shear. It should be no-ticed that a complete analysis of the epistemic uncer-tainty should also consider a comparison of the shape of the responses, which could be done by comparing the energy dissipation in each cycle, or important key demand parameters such as residual displacements. These parameters were not analysed in the present study.
The comparisons were carried out for the following three ranges of behaviour: a first range representing the behaviour up to the onset of yielding (the yield-ing of the first bar in tension defines the limit state DLS1), with the yielding displacement defined ac-cording to (Priestley et al. 2007); a second range representing the behaviour between DLS1 and the full concrete cover spalling, defined by a displace-ment obtained from the experidisplace-mental data (the oc-currence of spalling defines the limit state DLS2); and a third range representing the behaviour after DLS2 that involves concrete crushing and the frac-ture of steel rebars. The referred displacement limits were used to define behaviour ranges in the global response analyses. For the sectional analyses, the curvatures corresponding to the yielding and spall-ing displacements measured durspall-ing the experimental tests were used as limit state values.
Figure 1. Geometry and reinforcement of the sections.
3.2 Selected member models
The fact that short columns are considered in the present study implies that numerical issues are likely to occur depending on the selected integration scheme for the distributed plasticity models. The short length implies that the common assumption in the numerical modelling of frame members stating that only one integration point (IP) must be located within the plastic hinge length is difficult to achieve. In order to overcome this issue, three models were selected to evaluate the impact in the modelling of this type of structural members. In all the models, the plastic hinge length (Lp) was defined according to (Priestley et al., 2007). Therefore, a modelling strategy termed LEG4 means that it is a FB element modelled with Gauss-Legendre integration scheme and 4 IPs. It must be noted that this model does not have an integration point at the element ends, hence it does not consider the integration of the maximum bending moment for the element equilibrium. The LEG4 approach was selected because the weight of the first IP is very close to the value of Lp. An alter-native method was also considered which uses the modified Radau approach (Scott & Fenves, 2006). This model BWH considers an inelastic plastic hinge length Lp where the plasticity is concentrated that is connected to an elastic element, and requires the lo-calization to occur within Lp. In addition to LEG4 and BWH, a modelling option that considers a DB model was also considered, with the first element
being defined with a length equal to 2xLp. 3.3 Selected constitutive models
The simulation of the flexural behaviour of RC sec-tions using fibre models implies that secsec-tions must be divided into three zones, with each one being as-signed to a different uniaxial material law. The first zone is the area bounded by the centreline of the transverse reinforcement which is made of concrete with a strength enhanced by confinement. The sec-ond zone, which bounds the outside of the first zone, is made of unconfined concrete and will govern the development of spalling and the consequent degra-dation of strength and stiffness. The third zone mod-els the longitudinal reinforcing steel (RS). The char-acteristics of the RS material law govern several aspects of the flexural behaviour of the section, es-pecially for high levels of deformation.
In the present study, 100 combinations of con-crete (C) and RS models were considered. The 100 combinations involved 10 C models (involving un-confined and un-confined concrete models) and 10 RS models which are numbered according to Table 1. A brief description of the C and RS selected material models is provided in the following.
Table 1. Combinations of constitutive models for the analysis __________________________________________________ Model C1 C2 C3 C4 C5 C6 C7 C8 C9 C10 __________________________________________________ RS1 1 2 3 4 5 6 7 8 9 10 RS2 11 12 13 14 15 16 17 18 19 20 RS3 21 22 23 24 25 26 27 28 29 30 RS4 31 32 33 34 35 36 37 38 39 40 RS5 41 42 43 44 45 46 47 48 49 50 RS6 51 52 53 54 55 56 57 58 59 60 RS7 61 62 63 64 65 66 67 68 69 70 RS8 71 72 73 74 75 76 77 78 79 80 RS9 81 82 83 84 85 86 87 88 89 90 RS10 91 92 93 94 95 96 97 98 99 100 __________________________________________________
The consideration of the C modelling options im-plies that 2 strategies must be considered to account for the different behaviour of confined and uncon-fined concrete. With respect to conuncon-fined concrete, 6 of the models were defined according to the Scott et al. (1982) confined concrete model with a residual strength of 20% of the peak compressive strength: the C1 and C2 model have no tensile strength; the C3 model has a linear degradation of the tensile strength based on the linear softening defined by Yassin (1994) (in this case, it is considered that the tensile strength drops to zero after reaching its peak value); the C4 model mimics the tension stiffness mechanism using a linear degradation compatible with the strain limits defined by Kaklauskas & Gha-boussi (2001); the model C5 uses an exponential tensile degradation after cracking, according to the parameters defined by Berry and Eberhard (2008).
The remaining 5 models considered were based on the model by Popovics (1973) (C6, C7, C9 and C10) and Waugh (2007) (C8). Model C6 uses the Mander et al. (1988) proposal for the modelling of confined and unconfined concrete with the Karsan & Jirsa (1969) hysteric rules and has exponential tension development after maximum tensile strength. Model C7 considers the same behaviour envelope and hys-teresis rules but defines the reference points of the backbone curve using the Biskinis and Fardis (2009) proposal. Models C9 and C10 are the same of C6 and C7 but have no tensile strength. Finally, the C10 model uses the concrete model proposed by Waugh (2007). In order to simulate the spalling and crush-ing phenomena, the laws of the compressive behav-iour of the materials were modified for strains higher than specific thresholds. For such strains, the re-sponse of the concrete fibres is considered to have zero strength and slope (i.e. a null contribution to the strength of the section). To simulate the effect of spalling, a limiting strain εspall = 0.005 was
consid-ered in models C2-C7, according to the ranges in Priestley et al. (2007) and Caltrans (2006). In the case of models C1, C9 and C10, the strain corre-sponding to buckling of the reinforcement as defined by Pantazopoulou (1998) was considered, assuming that complete spalling will occur at this point. To simulate the onset of the confined concrete crushing, three alternatives were considered according to the selected concrete models. For models C1 to C5, this compressive strain limit was set by the maximum strain defined by Scott et al. (1982). In models C6, C8 and C9 it was defined by the crushing strain limit given by Priestley et al. (2007), while in models C7 and C8 it was set by the ultimate strain εc,ult
accord-ing to the proposal of Biskinis and Fardis (2009). Four RS models were considered in the present study. Model RS1 is a simple bilinear model with non-zero post-yield hardening. Model RS2 is a vari-ant of RS1 that includes isotropic hardening. Models RS3 and RS5 are the Menogotto & Pinto (1973) model with isotropic hardening, while RS4 and RS6 are the same model with no cyclic hardening.
Models RS7, RS8 and RS9 were considered accord-ing to three variants of the enhanced RS model by Kunnath et al. (2009). Model RS5 is the reference form of the model. The RS6 model includes strength degradation effects using the degradation parameters proposed by Berry & Oberhard (2008). The RS7 model is a variant of RS5 that considers the Gomes & Appleton (1997) steel buckling rules. Finally, the model RS10 represents the Dodd & Restrepo (1995) proposal. The main differences between RS4/RS6 and RS3/RS5 are in the parameters assumed to mod-el the backbone curve. RS4/RS6 follow the values extracted from the experimental results while RS3/RS5 were defined with an hardening ratio of 0.01 and a lower ultimate strain (i.e. 0.09) to account for degradation of the bar strength.
4 ANALYSIS OF THE RESULTS OBTAINED FROM THE SECTIONAL ANALYSIS
In the first stage of the analysis, the moment curva-ture response was analysed for the various DLS de-fined. As defined before, 3 DLSs were considered, limited by the curvature corresponding to the col-umn yield displacement, to the observed spalling displacement and to the end of the record.
4.1 Comparison of the numerical and experimental responses up to DLS1
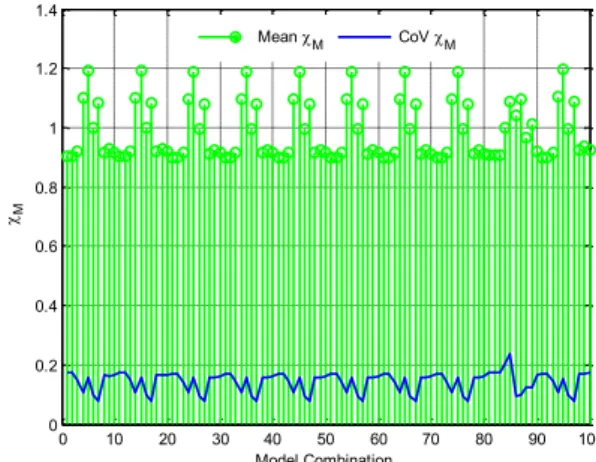
The first behaviour range goes up to the onset of the section yielding. Figure 2 presents the mean value and the coefficient of variation (CoV) of the χM
rati-os obtained for each combination of models, for the 2 sections, considering peak values up to DLS1. By analysing the mean ratios of the 2 sections, they can be seen to be very sensitive to the modelling of ten-sile behaviour in concrete.
Figure 2. Mean and CoV of the χM for all the combinations of
models and for peak values up to DLS1.
The mean ratios presented variations between 0.90/0.93 when no tension was considered, as op-posed to the values obtained for combinations in-volving other concrete models which vary from 0.99 (with C6) to 1.19 (with C5). With respect to the in-fluence of the RS model, the variability of the mean of χMup to DLS1 is seen to be independent of the
se-lected model. A global analysis of the results ob-tained for both columns and all the model combina-tions shows that the mean and the CoV of the χM ratios were found to be 0.98 and 0.17, respectively. 4.2 Comparison of the numerical and experimental
responses up to DLS2
According to Figure 3 which presents the mean val-ue and the CoV of the χM ratios obtained for each
combination of models, for the 2 sections, consider-ing peak values between DLS1 and DLS2, it can be seen that most differences between the several
com-0 10 20 30 40 50 60 70 80 90 100 0 0.2 0.4 0.6 0.8 1 1.2 1.4 Model Combination M Mean M CoV M
binations found in the previous behaviour range have disappeared. This means that tensile strength is not important to model this range of behaviour. The
χM ratios are similar for all the models considered
both in terms of the mean and the variability. Glob-ally, the means vary from 0.98 to 1.02, and exhibit a CoV ranging between 0.08 and 0.14. The ratios ob-tained present very low differences when compared regarding the use of different RS models.
The global analysis of the results obtained for both columns and all the model combinations, from yield-ing until spallyield-ing, shows that the mean and the CoV of the χM ratios were found to be 0.97 and 0.14,
re-spectively.
Figure 3. Mean and CoV of the χM for all the combinations of
models and for peak values between DLS1 and DLS2.
4.3 Comparison between the numerical and experimental responses after DLS2
For the third behaviour range, the sectional response that was analysed ranged from the curvature corre-sponding to the spalling of the cover until the last measured cycle. It should be pointed out that, for the case of N01, the end of the analysis corresponds to a base shear of 80% of its maximum value, while for N05 it corresponds to 50% of the maximum base shear. Figure 4 presents the mean value and the CoV of the χM ratios obtained for all the model
combina-tions, for the 2 seccombina-tions, considering peak values af-ter DLS2.
Unlike for the two previous behaviour ranges, the variability of the ratios is now seen to be much larg-er. Both the mean and the CoV exhibit significant variability across the model combinations. Two par-ticular aspects can be highlighted in a preliminary evaluation of these results. First, the ratios are no longer dependent on a specific material, as in the previous ranges. Instead, there is now a more com-plex interaction between the material models, name-ly in terms of the combination of their individual degradation features to model the real behaviour degradation of the section.. Such interaction can be observed in the model combinations where the max-imum compressive strain of the unconfined concrete
is the same as the strain that leads to the buckling of the bar, as defined by Pantazopoulou (1998). The second aspect is related to the steel degradation due to buckling of the rebars. It is seen that modelling this effect is very sensitive to the definition of the model parameters. For N01, model RS9 provided the best fit, while for N05, using RS9 resulted in an ex-cessive level of degradation, which then led to a dis-proportionate reduction of the section capacity. Alt-hough such modelling strategies have an undeniable potential due to the key role of buckling in the re-sponse of the section for larger levels of demand, its calibration is difficult, namely in terms of defining values for the buckling length, for example.
With respect to the influence of the concrete mod-els, using different εc,ult values is seen to have a
sig-nificant influence in the χM ratios. Higher mean
val-ues were observed for models C6-C10 when compared to those obtained for models C1-C5. This indicates that simulating structural behaviour in this range is highly sensitive to the definition of the con-crete failure in compression (core crushing) and, thus, to the value of εc,ult. The lower values found
when using model RS9 are due to the reasons ex-plained before.
The global analysis of the results obtained for both columns and all the model combinations for this be-haviour range shows that the mean and the CoV of the χM ratios were found to be 0.80 and 0.36,
respec-tively.
5 ANALYSIS OF THE RESULTS OBTAINED WITH THE ELEMENT ANALYSIS
In the second stage of the analysis, the shear force demand at the base of the columns was analysed for the 3 behaviour ranges. As defined before, those ranges were limited by the column yield ment, the spalling displacement and the displace-ment at the end of the test. The main objective of this comparison was to observe, at a global level, the effect of using different material modelling ap-proaches. For the particular range involving larger levels of displacement, this comparison will deter-mine the effect in the member response of over- or underestimating the amount of softening in the sec-tion response.
5.1 Comparison between the numerical and experimental responses up to DLS1
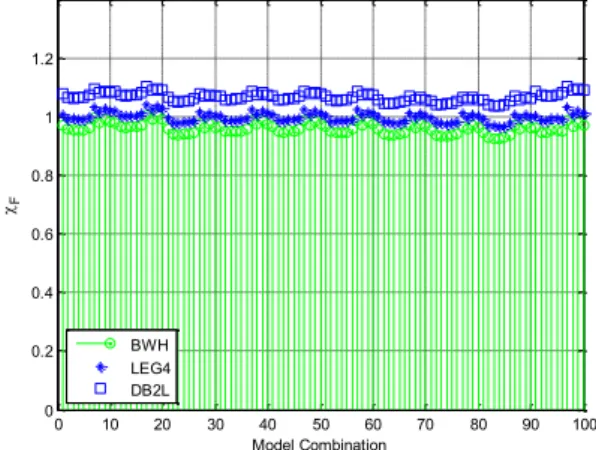
Figure 5 compares the response obtained for the el-ement models BWH, LEG4 and DB2L for dis-placements up to DLS1. A clear pattern can be iden-tified since, for a given element formulation, the pattern of results is similar to the one found when
0 10 20 30 40 50 60 70 80 90 100 0 0.2 0.4 0.6 0.8 1 1.2 1.4 Model Combination M Mean M CoV M
analysing the section response in Section 4.1. The models that include higher levels of fracture energy in tension lead to ratios χF closer to 1, while lower
values were obtained for the remaining cases. In terms of the effects resulting from the use of differ-ent elemdiffer-ent formulations, it is seen that DB2L sys-tematically yields a higher level of global response when compared to that of BWH and LEG4. On av-erage, DB2L yields shear forces about 8% higher than BWH and 6% higher than LEG4. Analysing the results of all the considered combinations of material models and element formulations shows that the mean of the χF ratios is 0.99. In terms of the
variabil-ity, the CoV of the χF ratios was found to be 0.17.
Therefore, the use of different modelling schemes has no significant effect in the global accuracy of the structural response. The most important effects re-main dependent on the type of material modelling.
Figure 4. Mean and CoV of the χM for all the combinations of
models and for peak values after DLS2.
5.2 Comparison between the numerical and experimental responses up to DLS2
Figure 6 compares the response obtained for the el-ement models BWH, LEG4 and DB2L for dis-placements between DLS1 and DLS2. As for the previous behaviour range, the results of each ele-ment formulation exhibit a pattern similar to the one found when analysing the section response in Sec-tion 4.2. In terms of the effects resulting from the use of different element formulations, it is seen that DB2L continues to yield higher levels of global re-sponse when compared to those of BWH and LEG4. On average, DB2L yields shear forces about 7% higher than the other formulations. As can be seen from Figure 6, this overestimation of the response has always a negative effect for this behaviour range. Analysing the results of all the considered combinations of material models and element for-mulations shows that the mean of the χF ratios is
0.98. In terms of the variability, the CoV of the χF
ratios was found to be 0.10. Therefore, the use of different modelling schemes has no significant effect in the accuracy of the structural response. Aside
from the response overestimation by the DB2L for-mulation, most of the response variability remains dependent on the type of material modelling.
Figure 5. Mean and CoV of the χF for all the combinations of
models and for peak values up to DLS1.
Figure 6. Mean and CoV of the χF for all the combinations of
models and for peak values between DLS1 and DLS2.
5.3 Comparison between the numerical and experimental responses after DLS2
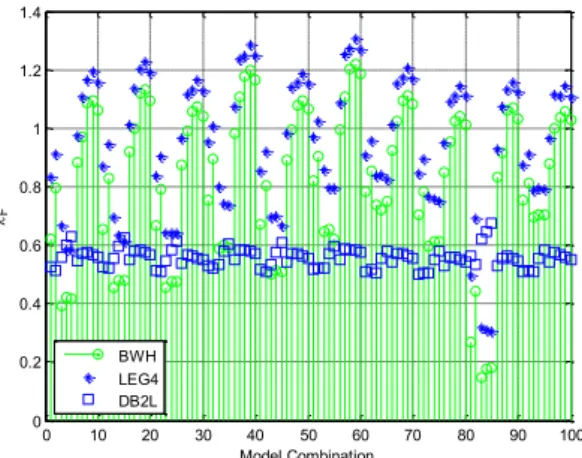
The last stage studied in the global analysis of the columns represented the most variable set since the effects of element model and the degrading sectional response appear to have contributions for the re-sponse. Figure 7 presents the distribution of the mean ratios obtained. Comparing this evolution with the variations observed in Figure 4 allows for the replication of many of the considerations made garding the effect of material modelling. With re-spect to the comparison between the responses of the different member models, it can be seen that the mean χF ratio follows a similar trend in the
variabil-ity with respect to the variation of the material mod-elling combination. Nevertheless, the model DB2L gives the higher ratios, which occur for the case C9 to C10. The complex interaction identified implies that the consideration of a numerical model cannot be dissociated from the selection of the material models, since the main features of a model may not be adequate to the properties of the material
model-0 10 20 30 40 50 60 70 80 90 100 0 0.2 0.4 0.6 0.8 1 1.2 1.4 Model Combination M Mean M CoV M 0 10 20 30 40 50 60 70 80 90 100 0 0.2 0.4 0.6 0.8 1 1.2 1.4 Model Combination F BWH LEG4 DB2L 0 10 20 30 40 50 60 70 80 90 100 0 0.2 0.4 0.6 0.8 1 1.2 Model Combination F BWH LEG4 DB2L
ling choices. Analysing the results of all the consid-ered combinations of material models and element formulations shows that the mean of the χF ratios is
0.93. In terms of the variability, the CoV of the χF
ratios was found to be 0.36.
Figure 7. Mean and CoV of the χF for all the combinations of
models and for peak values after DLS2.
6 CONCLUDING REMARKS
Given the significant number of existing structural and material modelling approaches, an application based study was developed in the present paper, ana-lysing the comparison of the results obtained from the analysis of 2 RC columns, considering distribut-ed plasticity models and 100 material model combi-nations of constitutive materials of steel and con-crete. The analysis was divided in behaviour ranges, in order to evaluate the uncertainty in an elastic, an intermediate range and at strength degradation. For the initial behaviour range, the impact of tension modelling of the materials revealed to be a key is-sue. For the case of the intermediate range, the re-sponse was seen to be dominated by the steel model until degradation issues start to manifest. In the last behaviour range, the interaction between the degrad-ing effects of the materials and the hardendegrad-ing or sof-tening resultant from the element formulation is very sensitive and may have a considerable impact in the results. The presented conclusions are based on 2 experimental cases with low to intermediate normal-ized axial load levels. It must be pointed out that the response obtained for each column presented differ-ent properties, which reflects the uncertainty associ-ated to the real response of RC members. Additional cases must be considered to include this fact in the uncertainty quantification. This study presented an observation of the expected impact that material modelling choices may have in different behaviour ranges of RC members, making some observations about the more critical modelling aspects and about the propagation of the material modelling uncertain-ty to the global demand parameters.
REFERENCES
Berry, M. & Eberhard, M. 2008. Performance Modeling Strat-egies for Modern Reinforced Concrete Bridge Columns, PEER Report 2007/07, PEER, University of California, Berkeley, California.
Biskinis, D. & Fardis M. 2009. Deformations of Concrete Members at Yielding and Ultimate under Monotonic or Cy-clic Loading (Including Repaired and Retrofitted Mem-bers). Report. University of Patras.
Calabrese A, Almeida J. & Pinho R. 2010. Numerical Issues in Distributed Inelasticity Modeling of RC Frame Elements for Seismic Analysis. Journal of Earthquake Engineering, 14: 38–68.
Caltrans. 2006. Caltrans Seismic Design Criteria. Version 1.4. California Department of Transportation.
Dodd, L. & Restrepo-Posada, J. 1995. Model for Predicting Cyclic Behaviour of Reinforcing Steel. Journal of
Structur-al Engineering 121:3, 433-445.
Gomes, A. & Appleton, J. 1997.Nonlinear cyclic stress-strain relationship of reinforcing bars including buckling.
Engi-neering Structures 19:10, 822–826
Kaklauskas G. & Ghaboussi J. 2001. Stress-Strain Relations for Cracked Tensile Concrete from RC Beam Tests.
Jour-nal of Structural Engineering 127:1, 64-73.
Karsan, I. & Jirsa, J. 1969. Behavior of concrete under com-pressive loading. Journal of Structural Division 95:12, 2543-2563.
Kunnath, S., Heo, Y. & Mohle, J. 2009. Nonlinear Uniaxial Material Model for Reinforcing Steel Bars. Journal of
Structural Engineering. 135:4, 335.
Mander, J., Priestley, N. & Park, R. 1988. Theoretical stress-strain model for confined concrete. Journal of Structural
Engineering 114:8, 1804-1825.
Menegotto, M. & Pinto, P. 1973. Method of Analysis for Cy-clically Loaded RC Plane Frames Including Changes in Geometry and Non-Elastic Behavior of Elements under Combined Normal Force and Bending. IABSE Reports Vol. 13. Lisbon.
Mitra, N. 2008. Uncertainty in analytical structural response associated with high level modelling decisions. Proceedings of the 14thWCEE, Beijing, China, 2008.
Pantazopoulou 1998. Detailing for reinforcement stability in RC members. Journal of Structural Engineering 124:6, 623–632.
Popovics, S. 1973. A numerical approach to the complete stress strain curve for concrete. Cement and Concrete Research 3:5, 583-599.
Priestley, N., Calvi, G. & Kowalsky, M. 2007. Displacement-Based Seismic Design of Structures, IUSS Press, Pavia, Ita-ly.
Rodrigues, H. Arêde, A., Varum H. & Costa A.G. 2013. Ex-perimental evaluation of rectangular reinforced concrete column behaviour under biaxial cyclic loading. Earthquake Engineering & Structural Dynamics 42:2, 239–259.
Scott. M. and Fenves, G. 2006. Plastic hinge integration meth-ods for force-based beam-column elements. Journal of Structural Engineering, 132(2):244–252
Scott, B., Park, R. & Priestley, N. 1982. Stress-strain behavior of concrete confined by overlapping hoops at low and high strain rates. Journal of American Concrete Institute, 79:1,13-27
Yassin, M. 1994. Nonlinear Analysis of Prestressed Concrete Structures under Monotonic and Cycling Loads, PhD dis-sertation, University of California, Berkeley.
Waugh, J. 2007. Nonlinear analysis of T-shaped concrete walls subjected to multi-directional displacements. Ph.D disserta-tion. Iowa State University.
0 10 20 30 40 50 60 70 80 90 100 0 0.2 0.4 0.6 0.8 1 1.2 1.4 Model Combination F BWH LEG4 DB2L