2006 International League Against Epilepsy
The BOLD Effect of Interictal Spike Activity in Childhood
Occipital Lobe Epilepsy
∗†Alberto Leal, †Ana Dias, †Jos´e P Vieira, ‡M´ario Secca, and ¶Constan¸ca Jord˜ao
Department of ∗Neurophysiology, Hospital J´ulio de Matos, Lisbon, Portugal; †Department of Pediatric Neurology, Hospital Dona Estefˆania, Lisbon, Portugal; ‡Department of Physics, New University of Lisbon, Portugal; and¶Department of Neuroradiology,
Hospital Egas Moniz, Lisbon, Portugal
Summary: Purpose: Occipital lobe epilepsy (OLE) presents in
childhood with different manifestations, age of onset and EEG features that form distinct syndromes. The ictal clinical symp-toms are difficult to correlate with onset in particular areas in the occipital lobes, and the EEG recordings have not been able to overcome this limitation. The mapping of epileptogenic cor-tical regions in OLE remains therefore an important goal in our understanding of these syndromes.
Methods: In this work, three patients with two types of
idio-pathic childhood OLE were studied with EEG source analysis and also with mapping of the BOLD effect associated with spikes in simultaneous EEG/fMRI recordings.
Results: Two patients with late onset OLE provided EEG
source localizations in the lateral parietal cortex and in the medial occipital areas. The BOLD activations were more consistent and
restricted to the medial parietal-occipital cortex in both cases. One patient with photosensitive idiopathic OLE presented with dipole sources in the medial parietal cortex, but the BOLD ac-tivations were widespread over inferior and bilateral occipital areas and also posterior temporal ones. There was little spatial overlap between the EEG and BOLD results, but the localiza-tions suggested by the latter are more consistent with the ictal clinical manifestations of each type of epileptic syndrome.
Conclusions: Overall, the BOLD effect associated with
inter-ictal spikes maps epileptogenic areas to different localizations than the ones suggested by EEG source analysis. These maps are similar in two patients with late onset idiopathic OLE, but different from a case of photosensitive idiopathic OLE. Key Words: Epilepsy—Occipital lobe—BOLD.
The occipital lobe epilepsies (OLEs) of childhood are a heterogeneous group of diseases with diverse clinical symptoms, age of onset and prognosis (1). The EEG helps in the localization of epileptic activity to the occipital lobes, but it is not syndrome-specific and very often the abnormalities also involve the parietal and temporal areas (1). The topography of spikes rarely points to the particular region in the occipital lobes originating the seizures and the few attempts to do source analysis did not improve the generally poor electroclinical correlation (2). In the case of idiopathic epilepsies, where brain imaging is normal, the particular regions of seizure onset remain unknown, despite the consistent clinical picture of each syndrome.
The detection of the BOLD effect associated with the occurrence of interictal spikes in simultaneous EEG/fMRI recordings offers a promising way to detect the epilep-tic neuronal dysfunction with high spatial resolution (3). Some studies with this method have been done in
symp-Accepted March 19, 2006.
Address correspondence and reprint requests to A. Leal at Department of Neurophysiology, Hospital J´ulio de Matos, Avenida do Brasil nr 53, 1749-002 Lisbon, Portugal. E-mail: [email protected]
doi: 10.1111/j.1528-1167.2006.00626.x
tomatic OLE (3–5) demonstrating significant posterior ac-tivation. No work has been done in idiopathic OLE, a group of epilepsies where clues to the particular cortical area of onset are lacking.
The goals of this work are to use the BOLD effect as-sociated with the occurrence of interictal spike activity in different types of childhood OLE to improve the electro-clinical correlation and also to compare the degree of con-cordance of this technique with the conventional methods of EEG source analysis.
METHODS AND SUBJECTS
Three patients with the diagnosis of idiopathic OLE from the outpatient clinic of the Pediatric Neurology De-partment of Hospital Dona Estefˆania were submitted to a 60-min EEG recording outside the scanner, including a sleep period, with a cap of 36 AgCl electrodes (Fp1/2, F3/4, FC3/4, C3/4, CP3/4, P3/4, PO1/2, O1/2, F7/8, FT7/8, T3/4, TP7/8, T5/6, FT9/10, A1/2, Fz, FCz, Cz, CPz, Pz, Oz).
The sampling rate was 256 Hz, filters 0.5–70 Hz, and in-termittent photic stimulation was performed at the end of registration. Later in the same day, a session of functional
MRI was performed while simultaneously recording the EEG (19 electrodes at standard 10–20 positions). Each pa-tient demonstrated a single, topographically stable, parox-ysm type. This was the main neurophysiological criteria for selection of patients for this study. Informed consent was obtained from the parents of the patients.
Source analysis of the EEG was done in spikes detected visually in recordings obtained outside the scanner in all patients and also inside for patient 1. The EEG was high pass filtered at 3 Hz (zero phase shift filter with 24 dB/oct) and spikes with good signal to noise ratio were aligned by the peak amplitude to produce an average spike. For patients 2 and 3, not enough spikes could be recorded in-side the scanner to produce stable dipole solutions. The sources were obtained from instantaneous moving dipoles at the peak of averaged spikes (n= 43, 19, and 21 for pa-tients 1,2, and 3), with a standard three layer Boundary Element Model (BEM) volume conductor model (con-ductances of 0.33, 0.0042, 0.33 S/m for scalp, bone and brain), provided in the Source2 software package (Neu-roscan, El Paso, Mexico). Standard electrode positions were also used. The confidence ellipsoids for the dipole positions represent the 1 SD interval and are directly pro-portional to the noise estimate in the averaged spikes (6), evaluated as 5 μV, 6 μV, and 5 μV, for patients 1, 2, and 3.
The EEG/fMRI consisted in the acquisition of blocks of 100 brain volumes each one made of 16 EPI images (in plane resolution 3.75 mm and slice thickness of 7 mm, no spacing; echo time 50μs; flip angle of 90◦) obtained with a TR= 3 s, corresponding to periods of 5 min of con-tinuous and simultaneous monitoring. 4 to 6 blocks were obtained per patient, providing 20 min of simultaneous monitoring for patient 1, 30 min for patient 2, and 20 min for patient 3. A brain T1weighted anatomic sequence (in
plane resolution 0.94 mm and slice thickness of 1.3 mm) was obtained in the same session.
Images were acquired in a 1.5T GE CVi/NVi scan-ner, while the EEG was recorded through a set of AgCl electrodes connected to an amplifier located outside the scanner room through carbon fiber wires (MagLink, Neu-roscan, El Paso, TX, U.S.A.). The cap did not produce detectable artifacts in the MRI sequences, so these could be processed without any special correction. The EEG was corrected for artifacts induced by the magnetic field and rapidly changing imaging gradients offline using com-mercial software (Scan 4.3.2, Neuroscan). The time of occurrence of spikes was determined by visual inspection and used to classify the acquired image volumes, resulting in sequences of events of interest used to build an event-related paradigm. To model the hemodynamic function a standard Gamma function with derivatives was used (7). Sixty, three and nine spikes were analyzed, respectively, for patients 1, 2, and 3. The EPI sequences were corrected for movement and slice acquisition time and smoothed
with a Gaussian kernel of FWHM 8 mm. A local autocor-relation correction was used (8) and z statistic images gen-erated. The correction for the multiple comparison prob-lem was done using a cluster threshold with p= 0.05. The preprocessing and paradigm-related analysis of the fMRI was performed using the FSL software package (9).
Representation of dipoles on individual brain anatomy was performed by adjusting the fiducial points (nasion, preauricular points, inion, and vertex) of the BEM model on the individual 3D T1MRI. Representation on the
in-flated cortex was done with the FreeSurfer software pack-age (10).
CASE 1
This 13-year-old boy is the son of healthy and noncon-sanguineous parents. Gestation and delivery were normal, and the cognitive and motor development milestones were reached at the appropriate ages. At the age of 7 years, there was an episode of sudden bilateral loss of vision of brief duration, without loss of consciousness or other clin-ical symptoms. The neurologclin-ical examination performed hours later was normal.
The EEG revealed high-amplitude spikes over the pos-terior temporal and occipital areas in the right hemisphere, that blocked partially during recording with the eyes open. A brain 1.5T MRI scan was performed and considered normal.
Medication with sodium valproate (250 mg twice daily) was started and he remains seizure-free.
CASE 2
This 12-year-old girl has a history of uneventful ges-tation and delivery. Development in early childhood was reportedly normal and intelligence is also normal.
At the age of 9 years, the parents noticed the occur-rence of very frequent, daily episodes of motor arrest with purposeless hand movements, when she was watching TV. During these episodes she stared, remained immobile, and did not respond to verbal stimuli. No eyelid movements or loss of tone were apparent. This behavior was also trig-gered by an abstract pattern on the kitchen wall mosaics. She could stand for long periods of time in front of a partic-ular mosaic without paying attention to the surroundings. Later on when asked what she was seeing she would say that “there was a lion’s head.”
The EEG showed frequent bursts of parietal-occipital spike-wave activity at 5–7 Hz, lasting seconds and persis-tent posterior photo-paroxysmal response to intermitpersis-tent light stimulation in the range of 4–10 Hz.
A younger brother (6-year ) presented reflex epilepsy in early childhood where the seizures could be evoked by lightly tapping the forehead.
CASE 3
A 12-year-old boy with no family history of epilepsy was studied. He was born at the gestational age of 37 weeks by forceps with an APGAR score of 6 of 10. He had a normal motor and cognitive development.
With age 3 years, he developed partial complex seizures with occasional generalization and without fever. Later on, he presented frequent drop attacks with no apparent cause. He was treated with carbamazepine and the seizures stopped. He remained controlled until he was 11, at which time he had three seizures characterized by sudden loss of vision followed by interruption of consciousness in two, and one with visual hallucinations where he saw im-ages similar to a motion picture he had seen previously. Headaches followed the seizures.
The EEGs showed a persistently normal background and abundant spike activity over the right occipital and parietal areas. No photo-paroxysmal response was appar-ent.
He attends regular school without significant learning difficulties.
RESULTS
The EEGs obtained inside the scanner allowed recog-nition of interictal spikes in all patients (Figs. 1C, 2C, and 3C), which were abundant in patient 1 and rare in the remaining. The number of spikes was clearly reduced in all patients as compared with the recordings outside the scanner. This agrees well with what we would expect from comparing sleep recordings obtained outside with full awaken ones obtained inside the scanner, as sleep is a powerful activator of spikes in childhood idiopathic epilepsy.
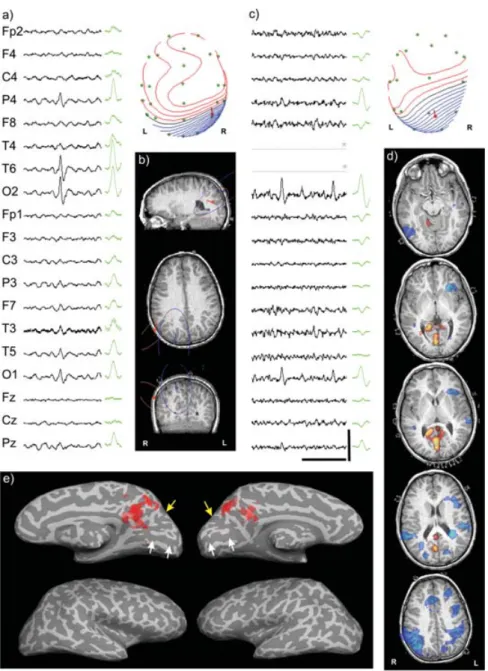
For patient 1, the EEG background is normal and high-amplitude spikes are present over the right occipital-parietal region (Fig. 1A), most often occurring rhythmi-cally at 1–3 Hz and with a clear reduction while recording with the eyes open. The spike morphology and topog-raphy are monotonous and demonstrate a clear bipolar scalp distribution of the electrical potential (Fig. 1B). The source analysis reveals dipoles located over the cortical right parietal-occipital region (Fig. 1B), suggesting a re-stricted focal epileptogenic area. The source obtained from EEG inside the scanner shows a similar localization but suffers from worse signal to noise ratio (larger confidence ellipsoid) and deficient spatial sampling over right tem-poral areas (solution shifted to the left) (Fig. 1C). The BOLD activation associated with the occurrence of spikes involves the more posterior and medial areas of both pari-etal lobes, with small clusters in the neighborhood of the calcarine fissure (Figs. 1D,E). No significant BOLD ac-tivation is apparent in the cortex adjacent to the source analysis dipoles. Deactivation analysis produces several clusters, with a more consistent one over the right
pari-etal area, in a localization similar to that of EEG source analysis.
Patient 2 presents a normal background EEG with bursts of spikes over the posterior hemispheres (Fig. 2A), and focal photo-paroxysmal response induced by intermittent light stimulation. The scalp potential distribution is of a dipolar type, and the source analysis provides a dipole in the midline parietaloccipital area, with a slight later-alization to the left (Fig. 2B). The regions of significant BOLD activation spread over the occipital lobes, involv-ing the lower lateral cortex on both hemispheres, and also the more rostral and medial occipital cortex and posterior temporal areas on the right (Figs. 2C,D). The areas where the dipoles of the source analysis are located show no significant BOLD activation. No significant spike-related deactivation was apparent.
Patient 3 presents spikes and sharp waves with maxi-mum amplitude over occipital electrodes (Fig. 3A). The average paroxysm shows a dipolar potential field over the scalp, and the dipole solution locates the generators in the medial occipital lobe (Fig. 3B), but the spatial stabil-ity of the solution is low (large confidence ellipsoid) due to the poor signal to noise ratio. The BOLD activations are located over the posterior and medial occipital cortex and also over the basal ganglia in the right hemisphere (Figs. 3D,E). The ones localized in the occipital lobe are more superficial than the dipole solutions, and point to different cortical areas as the source of scalp paroxysms. The BOLD deactivation occurs in the left frontal lobe.
DISCUSSION
The different types of OLE reviewed demonstrate a clear discrepancy between the localization of epilepto-genic cortical areas suggested by the EEG source analysis and the BOLD activations associated with the paroxysms. This occurs despite the fact that the spatial sampling of the EEG over posterior areas was increased (2) resulting in five electrodes over occipital areas (as compared with two for the 10–20 system) and an even more significant increase over parietal and temporal areas (Figs. 1B, 2B, and 3B).
The fact that the EEG used for source analysis was obtained outside the scanner room, evokes the possibil-ity that this discrepancy might be due to different parox-ysm types being analyzed in the two methods. This is unlikely because patients were selected to the study with the requirement that they had topographically stable, sin-gle paroxysm types in previous EEGs; the data collection was done in the same day; and the paroxysms in the EEG obtained inside and outside the scanner room showed a similar topography (Figs. 1A–C, 2A–C, and 3A–C).
Patient 1 presents a normal development and MRI, pointing to an idiopathic epilepsy. The clinical and neuro-physiological features are typical of late onset childhood
FIG. 1. (A) Sample of selected EEG channels demonstrating the interictal spikes in patient 1 over the posterior right hemisphere (the scale bar represents 1 s of time horizontally and 200μV vertically) and average spike at right (n=43). Above right, map of electrical potential at the peak of an averaged spike (electrodes are green, nose upward; negative potentials are blue and positive ones red). (B) Moving dipole solution around the peak of an averaged spike outside (red) and inside (blue) the scanner, with a measure of dispersion represented in confidence ellipsoids (1 SD); (C) Raw spikes inside the scanner after artifact correction, with average (n=15) and potential map on the scalp (∗represents bad channels); (D) BOLD regions of significant activation (red) and deactivation (blue) represented over the patient high resolution T1 MRI; (E) Activation regions represented on the inflated white/gray matter interface. The calcarine and parietaloccipital sulci are indicated by white and yellow arrows, respectively.
epilepsy with occipital paroxysms (11), with onset at school age, amaurosis as the main visual manifestation and occipital EEG spikes blocking with the eyes open. Little is known about the cortical areas involved in spike or seizure generation in this syndrome, but ictal semiol-ogy would suggest a locus near the primary visual area, while the dipole analysis of Van der Meij (2) suggests superficial sources just beneath the skull layer. Our re-sults show a similar superficial localization (Fig. 1B), but over lateral parietal areas, despite the fact that we used
an extended grid of electrodes and a realistic volume con-ductor model. Dipole localization was clearly discrepant in relation to BOLD activations, while there was concor-dance with the largest cluster of deactivation. The elec-troclinical correlation between dipole solutions and clin-ical ictal symptoms remains poor as no reference in the literature could be found with respect to amaurosis as a manifestation of a focus in this area, and no electrical stimulation in the parietal lobe lead to this symptom. The BOLD activations located in the medial parietal-occipital
FIG. 2. (A) Sample of selected EEG channels with bursts of spikes over posterior scalp electrodes. Right, average spike (n=19); (B) Map of scalp potential around the peak of the averaged spike (above), demonstrating the bipolar distribution. Below, the dipole localization around the peak of the spike; (C) Raw EEG inside the scanner, with small-amplitude posterior spikes. Electrode O1 shows gradient artifacts; (D) BOLD activation associated with the spikes, mainly over the posterior regions of both hemispheres. No deactivation clusters were detected; (E) Detailed representation of BOLD activations over inflated cortex, showing distribution over lower occipital bilaterally and posterior temporal lobes on the right (scale bars, colors, and arrows as in Fig.1).
cortex, and also in the neighborhood of the calcarine sulcus (Fig. 1E) provide a more consistent electroclinical corre-lation, as electrical stimulation in the posterior cingulate and inferior precuneus could induce blurred vision (12). The significance of the activation in the right basal nuclei is difficult to evaluate, and whether it represents an abnor-mal functional connection with the epileptic cortical focus as suggested by Federico et al. (13) for similar activations is uncertain.
Patient 3 had early developmental problems but the nor-mal intelligence, lack of lesion in the MRI, and nornor-mal
EEG background with posterior spikes, suggest the diag-nosis of idiopathic occipital epilepsy. Amaurosis as the main ictal symptom in recent years strongly suggests the inclusion in the syndrome of late onset childhood epilepsy with occipital paroxysms (11), which can also present interruption of consciousness, visual hallucinations and postictal headache. This syndrome can start as early as 3 years of age and be associated with partial seizures, gen-eralized tonic-clonic sezures, and ictal falls without loss of consciousness (reviewed in [14]). The localization of the dipole solution provides a good electroclinical correlation
FIG. 3. (A) Sample of EEG with posterior paroxysms over the posterior electrodes. Right, average spike (n=21); (B) Scalp potential map with bipolar distribution at the peak of an average spike. Below, dipole solution at the spike peak located near the primary visual areas, but with a large error ellipsoid associated; (C) Raw EEG inside the scanner with posterior spikes; (D) BOLD activation (red) associated with the spikes, in the posterior areas of both hemispheres and in the basal ganglia on the right. Deactivation over the frontal lobe is shown in blue; (E) Activation clusters over the parietaloccipital region. The activation in the lower right frontal lobe results from artifactual projection of the basal ganglia activation on the nearest surface (scale bars, colors, and arrows as in Fig.1).
and agrees well with the previously mentioned litera-ture experience on electrical stimulation of the region (12). The BOLD activation on the more posterior parietal-occipital region, although in a different localization, also correlates well with results of local stimulation (15). De-activation over the right frontal lobe has no clear EEG correlate in the scalp recording, remaining difficult to interpret.
The BOLD activation data of patients 1 and 3 correlates well and strongly suggests that the epileptogenic area in the Gastaut type of Benign OLE is localized in the medial parietal areas of both hemispheres.
In patient 2, the normal neurological status, neuroimag-ing, and the evidence of a genetic component, point to an idiopathic epilepsy. The visually induced seizures, EEG with prominent focal photo-paroxysmal response and oc-cipital spikes, strongly suggest the diagnosis of idiopathic photosensitive OLE (15). To the best of our knowledge no dipole analysis has been done in this syndrome, so little is known about the possible spike sources. In our case, the dipoles are located in the lateral parietal lobe, near the mid-line (Fig. 2B), a region where Geller et al. (16) could evoke complex visual hallucinations with electrical stimulation. The BOLD activations show a discrepant localization, but
involvement of inferior occipital and temporal areas pro-vides a better electroclinical correlation with the complex nature of visual symptoms and persistent interruption of consciousness (16,17). The two data sets are nevertheless not mutually exclusive.
The BOLD deactivations are present only in the two patients with the Gastaut type of OLE, but their spatial distribution does not overlap. Whether this effect is due to a decreased synaptic activity as is suggested by Agakhani (18) or to other unknown effect is a matter that cannot be resolved with the present data. The overall concordance of BOLD deactivation with the source analysis is no bet-ter than for activation, a point already mentioned in the literature (19).
We could obtain BOLD activations in 100% of our pa-tients, which is significantly better than the results of larger series, were values in the order of 40–60% are mentioned (3,20) for patients with focal epilepsy. A study in a popu-lation with generalized idiopathic epilepsy (18) improves this value to 93%, and together with our results suggest that the method may be more efficient in idiopathic epilep-sies as compared with the symptomatic ones.
Overall, our data show different BOLD activations on the occipital lobes in different syndromes of idiopathic OLE. The epileptogenic regions identified by this method show important discrepancies with the ones suggested by dipole analysis, in line with data from the literature (19,21), but as a possible representation of the epilepto-genic area, they provide a more satisfactory explanation of the clinical ictal manifestations from the literature. The EEG/fMRI technique is a powerful method for the study of occipital lobe epilepsies and can provide a way to build more detailed models integrating clinical, structural, elec-trical, and vascular data.
Acknowledgment: The authors are grateful to Cristina Menezes, Elisa Vilar, Rita Pinto, Elizabete Lage, and Bruno Mour˜ao for technical support.The work was supported by a grant for Research in Epilepsy from Tecnifar SA and by project Topo3D (POSI/CPS/39758/2001) from FCT.
REFERENCES
1. Taylor I, Scheffer I, Berkovic S. Occipital epilepsies: identification of specific and newly recognized syndromes. Brain 2003;126:753– 69.
2. Van der Meij W, Van der Dussen, Huffelen V, et al. Dipole source analysis may differenciate benign focal epilepsy of childhood with
occipital paroxysms from symptomatic occipital lobe epilepsy. Brain Topogr 1997;10:115–20.
3. Al-Asmi A, B´enar C, Gross D, et al. fMRI activation in continuous and spike-triggered EEG-fMRI studies of epileptic spikes. Epilepsia 2003;44:1328–39.
4. B´enar C, Gross D, Wang Y, et al. The BOLD response to interictal epileptiform discharges. Neuroimage 2002;17:1182–92.
5. Lazeyras F, Blanke O, Perrig S, et al. EEG-triggered functional MRI in patients with pharmacoresistant epilepsy. J Mag Res Imaging 2000;12:177–85.
6. Fuchs M, Wagner M, Kastner J. Confidence limits of dipole source reconstruction results. Clin Neurophysiol 2004;115:1442–51. 7. Huettel S, McKeown J, Song A, et al. Linking hemodynamic
and electrophysiological measures of brain activity: evidence from functional MRI and intracranial field potentials. Cereb Cortex 2004;4:165–73.
8. Worsley KJ, Evans AC, Marrett S, Neelin P. A three-dimensional sta-tistical analysis for CBF activation studies in human brain. J Cerebr Blood Flow and Metab 1992;12:900–18.
9. Smith S, Jenkinson M, Woolrich M, et al. Advances in functional and structural MR image analysis and implementation as FSL. Neu-roimage 2004;23(suppl 1):208–19.
10. Fischl Bruce, Sereno M.I., Dale A.M. Cortical surface-based anal-ysis II: inflation, flattening, and a surface-based coordinate system. Neuroimage 1999;9:195–207.
11. Gastaut H. Benign epilepsy of childhood with occipital paroxysms. In: Roger J, Bureau M, Dravet Ch, Dreifuss F, Perret A, Wolf P, eds. Epileptic syndromes in infancy, childhood and adolescence. 2nd ed, London: John Libbey, 1992:201–17.
12. Richer F, Martinez M, Cohen H, et al. Visual motion perception from stimulation of the human medial parieto-occipital cortex. Exp Brain Res 1991;87:649–52.
13. Federico P, Archer J, Abbot D, et al. Cortical/subcortical BOLD changes associated with epileptic discharges. Neurology 2005;64:1125–30.
14. Panayiotopoulos CP. Idiopathic childhood occipital epilepsies. In: Roger J, Dravet C, Genton P, Tassinari CA, Wolf P, eds. Epileptic syndromes in infancy, childhood and adolescence. Eastleigh, UK: John Libbey, 2002: 203–27.
15. Guerrini R, Ferrari AR, Battaglia A, et al. Idiopathic photosensitive occipital lobe epilepsy. Epilepsia 1995;36:883–91.
16. Geller E, L¨uders H, Cheek J, et al. Electrical stimulation of the vi-sual cortex. In: L¨uders H, Noachtar S, eds. Epileptic seizures: patho-physiology and clinical semiology. London: Churchill Livingstone, 2000:219–27.
17. Salanova V, Andermann F, Olivier A, et al. Occipital lobe epilepsy: Electro-clinical manifestations, electrocorticography, cortical stim-ulation and outcome in 42 patients treated between 1930 and 1991. Brain 1992;115:1655–80.
18. Aghakhani Y, Bagshaw AP, B´enar CG, et al. fMRI activation during spike and wave discharges in idiopathic epilepsy. Brain 2004;127:1127–44.
19. Bagshaw A, Kobayashi E, Dubeau F, et al. Correspondence between EEG-fMRI and EEG dipole localization of interictal discharges in focal epilepsy. Neuroimage 2006;30:417–25.
20. Bagshaw A, Aghakhani Y, B´enar C, et al. EEG-fMRI of focal epileptic spikes: analysis with multiple haemodynamic functions and comparison with Gadolinium-enhanced MR angiograms. Hum Brain Mapp 2004;22:179–92.
21. Lemieux L, Krakow K, Fish DR. Comparison of spike-triggered functional MRI BOLD activation and EEG dipole model localiza-tion. Neuroimage 2001;14:1097–104.