CERN-PH-EP/2013-037 2015/01/08
CMS-SMP-12-023
Differential cross section measurements for the production
of a W boson in association with jets in proton-proton
collisions at
√
s
=
7 TeV
The CMS Collaboration
∗Abstract
Measurements are reported of differential cross sections for the production of a W bo-son, which decays into a muon and a neutrino, in association with jets, as a function of several variables, including the transverse momenta (pT) and pseudorapidities of
the four leading jets, the scalar sum of jet transverse momenta (HT), and the
differ-ence in azimuthal angle between the directions of each jet and the muon. The data sample of pp collisions at a centre-of-mass energy of 7 TeV was collected with the CMS detector at the LHC and corresponds to an integrated luminosity of 5.0 fb−1. The measured cross sections are compared to predictions from Monte Carlo gener-ators, MADGRAPH+PYTHIA and SHERPA, and to next-to-leading-order calculations from BLACKHAT+SHERPA. The differential cross sections are found to be in agree-ment with the predictions, apart from the pT distributions of the leading jets at high
pTvalues, the distributions of the HTat high-HT and low jet multiplicity, and the
dis-tribution of the difference in azimuthal angle between the leading jet and the muon at low values.
Published in Physics Letters B as doi:10.1016/j.physletb.2014.12.003.
c
2015 CERN for the benefit of the CMS Collaboration. CC-BY-3.0 license ∗See Appendix A for the list of collaboration members
1
Introduction
This letter reports measurements of fiducial cross sections for W boson production in associa-tion with jets at the LHC. Measurements of the producassocia-tion of vector bosons in associaassocia-tion with jets are fundamental tests of perturbative quantum chromodynamics (pQCD). The W+jets pro-cesses also provide the main background to other, much rarer, standard model (SM) propro-cesses, such as tt [1] and single top-quark production [2], and to Higgs boson production and a va-riety of physics processes beyond the SM. Searches for phenomena beyond the SM are often limited by the uncertainty in the theoretical cross sections for W (and Z) + jets processes at high momentum scales and large jet multiplicities. Therefore, it is crucial to perform precision measurements of W+jets production at the LHC.
Leptonic decay modes of the vector boson are often used in the measurement of SM processes and in searches for new physics, because they provide clean signatures with relatively low background. This letter focuses on the production of a W boson decaying into a muon and a neutrino, as part of a final-state topology characterised by one high-transverse-momentum (pT) isolated muon, significant missing transverse energy (ETmiss), and one or more jets. The
cross sections are measured as a function of the inclusive and exclusive jet multiplicities for up to six jets. Differential cross sections are measured for different inclusive jet multiplici-ties as a function of the transverse momentum and the pseudorapidity (η) of the jets, where
η = −ln[tan(θ/2)], and θ is the polar angle measured with respect to the anticlockwise beam
direction. The cross sections are also measured as a function of the difference in azimuthal angle between the direction of each jet and that of the muon, and of HT, which is defined as
the scalar sum of the pT of all jets with pT > 30 GeV and|η| < 2.4. It is important to study
the distribution of the jet pT and the observable HT because they are sensitive to higher order
corrections, and are often used to discriminate against background in searches for signatures of physics beyond the SM. Additionally, HTis often used to set the scale of the hard scattering
process in theoretical calculations. Finally, the η distributions of jets and the azimuthal sep-arations between the jets and the muon are also important, because they are sensitive to the modelling of parton emission.
The measurements presented in this letter use proton-proton (pp) collision data at a centre-of-mass energy of√s =7 TeV recorded with the CMS detector at the LHC in 2011 and correspond to an integrated luminosity of 5.0±0.1 fb−1 [3]. These measurements cover high jet multi-plicities and higher jet pT than earlier publications because the centre-of-mass energy and the
integrated luminosity are higher. Previous studies of leptonic decay modes of the W boson in association with jets at the LHC have measured the cross sections and cross section ratios for W boson production in association with jets in pp collisions with an integrated luminosity of 36 pb−1 at√s = 7 TeV with the ATLAS [4] and CMS [5] detectors. Measurements have also been made with pp collisions with the D0 detector [6, 7] at the Tevatron collider for integrated luminosities up to 4.2 fb−1, as well as with the CDF detector [8] for an integrated luminosity of 320 pb−1. Recent measurements have been made with the ATLAS detector with a centre-of-mass energy of 7 TeV and an integrated luminosity of 4.6 fb−1[9].
In order to perform a differential measurement of the W+jets cross section, a high-purity sam-ple of W → µν events is selected and the kinematic distributions are corrected to the particle
level by means of regularised unfolding [10]. This procedure corrects a measured observable for the effects of detector response, finite experimental resolutions, acceptance, and efficien-cies, and therefore allows for direct comparison with theoretical predictions. The measured differential cross sections are compared to the predictions of generators such as MADGRAPH 5.1.1 [11] interfaced withPYTHIA6.426 [12],SHERPA1.4.0 [13–16], and BLACKHAT[17, 18],
in-2 3 Data and simulation samples
terfaced to SHERPA. The BLACKHAT+SHERPA samples [19] provide parton-level predictions of W+n (n = 1–5) jets at next-to-leading order (NLO), while the MADGRAPH+PYTHIA and SHERPAsamples provide tree-level calculations followed by hadronisation to produce the final states.
The letter proceeds as follows: Section 2 presents the CMS detector. Section 3 describes the Monte Carlo (MC) event generators, as well as the data samples used for the analysis. The iden-tification criteria for the final-state objects (leptons and jets) and the selection of the W→µν+
jets events are presented in Section 4. Section 5 describes the modelling of instrumental back-grounds and irreducible physics backback-grounds. The procedure used for unfolding is detailed in Section 6, and Section 7 describes the systematic uncertainties. Finally, the unfolded dis-tributions are presented in Section 8 and compared to theoretical predictions, and Section 9 summarises the results.
2
The CMS detector
The CMS detector, presented in detail elsewhere [20], can be described with a cylindrical co-ordinate system with the +z axis directed along the anticlockwise beam axis. The detector consists of an inner tracking system and calorimeters (electromagnetic, ECAL, and hadron, HCAL) surrounded by a 3.8 T solenoid. The inner tracking system consists of a silicon pixel and strip tracker, providing the required granularity and precision for the reconstruction of vertices of charged particles in the range 0 ≤ φ < 2π in azimuth and|η| < 2.5. The crystal
ECAL and the brass/scintillator sampling HCAL are used to measure the energies of photons, electrons, and hadrons within|η| <3.0. The HCAL, when combined with the ECAL, measures
jets with a resolution∆E/E≈100%/pE[GeV] ⊕5% [21]. The three muon systems surround-ing the solenoid cover a region|η| < 2.4 and are composed of drift tubes in the barrel region
(|η| <1.2), cathode strip chambers in the endcaps(0.9 < |η| <2.4), and resistive-plate
cham-bers in both the barrel region and the endcaps (|η| < 1.6). Events are recorded based on a
trigger decision using information from the CMS detector subsystems. The first level (L1) of the CMS trigger system, composed of custom hardware processors, uses information from the calorimeters and muon detectors to select the most interesting events in a fixed time interval of less than 4 µs. The high-level trigger (HLT) processor further decreases the event rate from 100 kHz at L1 to roughly 300 Hz.
3
Data and simulation samples
Events are retained if they pass a trigger requiring one isolated muon with pT > 24 GeV and
|η| <2.1. Signal and background simulated samples are produced and fully reconstructed
us-ing a simulation of the CMS detector based on GEANT4 [22], and simulated events are required to pass an emulation of the trigger requirements applied to the data. These simulations include multiple collisions in a single bunch crossing (pileup). To model the effect of pileup, minimum bias events generated inPYTHIAare added to the simulated events, with the number of pileup events selected to match the pileup multiplicity distribution observed in data.
A W → `ν+jets signal sample is generated with MADGRAPH 5.1.1 and is used to determine the detector response in the unfolding procedure described in Section 6. Parton showering and hadronisation of the MADGRAPH samples are performed with PYTHIA 6.424 using the Z2 tune [23]. The detector response is also determined using a different W+jets event sample generated withSHERPA1.3.0 [13–16], and is used in the evaluation of systematic uncertainties due to the unfolding of the data.
The main sources of background are the production of tt, single top-quark, Z/γ∗+jets, dibosons (ZZ/WZ/WW) + jets, and multijet production. With the exception of multijet production, all backgrounds are estimated from simulation. The simulated samples of tt and Z/γ∗+jets are generated with MADGRAPH5.1.1; single top-quark samples (s-, t-, and tW- channels) are generated withPOWHEGversion 1.0 [24–27]; VV samples, where V represents either a W boson or a Z boson, are generated withPYTHIAversion 6.424 using the Z2 tune [23]. Parton showering and hadronisation of the MADGRAPHandPOWHEGsamples are performed withPYTHIA6.424. The simulations with MADGRAPHandPYTHIAuse the CTEQ6L1 parton distribution functions (PDF) [28]. The simulation with SHERPA uses the CTEQ6.6m PDF, and the simulations with POWHEGuse the CTEQ6m PDF.
The W+jets and Z/γ∗+jets samples are normalised to next-to-next-to-leading order (NNLO) inclusive cross sections calculated with FEWZ[29]. Single top-quark and VV samples are nor-malised to NLO inclusive cross sections calculated with MCFM [30–33]. The tt contribution is normalised to the NNLO + next-to-next-leading logarithm (NNLL) predicted cross section from Ref. [34].
4
Object identification and event selection
Muon candidates are reconstructed as tracks in the muon system that are matched to tracks reconstructed in the inner tracking system [35]. Muon candidates are required to have pT >
25 GeV, and to be reconstructed within the fiducial volume used for the high-level trigger muon selection, i.e. within|η| < 2.1. This ensures that the offline event selection requirements are as
stringent as the trigger. In addition, an isolation requirement is applied to the muon candidates by demanding that the relative isolation is less than 0.15, where the relative isolation is defined as the sum of the transverse energy deposited in the calorimeters (ECAL and HCAL) and of the pTof charged particles measured with the tracker in a cone of∆R=
√
(∆φ)2+ (∆η)2 =0.3 around the muon candidate track (excluding this track), divided by the muon candidate pT. To
ensure a precise measurement of the transverse impact parameter of the muon track relative to the interaction point, only muon candidates with tracks containing more than 10 hits in the silicon tracker and at least one hit in the pixel detector are considered. To reject muons from cosmic rays, the transverse impact parameter of the muon candidate with respect to the primary vertex is required to be less than 2 mm.
Jets are reconstructed using the CMS particle-flow algorithm [36, 37], using the anti-kT[38, 39]
algorithm with a distance parameter of 0.5. The jet energy is calibrated using the pT balance
of dijet and γ+jet events [40] to account for the following effects: nonuniformity and non-linearity of the ECAL and HCAL energy response to neutral hadrons, the presence of extra particles from pileup interactions, the thresholds used in jet constituent selection, reconstruc-tion inefficiencies, and possible biases introduced by the clustering algorithm. Only jets with pT > 30 GeV, |η| < 2.4, and a spatial separation of ∆R > 0.5 from the muon are considered.
To reduce the contamination from pileup jets, jets are required to be associated to the same primary vertex as the muon. The vertex associated to each jet is the one that has the largest number of pT-weighted tracks in common with the jet. The contamination from pileup jets is
estimated with the signal simulation, with pileup events simulated withPYTHIA, and found to be less than 1%.
The missing momentum vector, pmissT , is defined as the negative of the vectorial sum of the transverse momenta of the particles reconstructed with the particle-flow algorithm, and the ETmiss is defined as the magnitude of the pmissT vector. The measurement of the EmissT in
simu-4 5 Estimation of the backgrounds and selection efficiencies
lation is sensitive to the modelling of the calorimeter response and resolution and to the de-scription of the underlying event. To account for these effects, the ETmissin W+jets simulation is corrected for the differences in the detector response between data and simulation, using a method detailed in Ref. [41]. A recoil energy correction is applied to the W+jets simulation on an event-by-event basis, using a sample of Z → µµ events in data and simulation. The
trans-verse recoil vector, defined as the negative vector sum of the missing transtrans-verse energy and the transverse momenta of the lepton(s), is divided into components parallel and perpendicular to the boson direction. The mean and the width of the transverse recoil vector components are parameterised as a function of the Z boson pTin data and simulation. The ratio of the data and
simulation parameterisations is used to adjust the transverse recoil vector components in each simulated event, and a new EmissT is computed using the corrected recoil components.
Events are required to contain exactly one muon satisfying the conditions described above and one or more jets with pT > 30 GeV. Events are required to have MT > 50 GeV, where
MT, the transverse mass of the muon and missing transverse energy, is defined as MT ≡ √
2pµTEmissT (1−cos∆φ), where pµT is the muon pT and∆φ is the difference in azimuthal angle
between the muon momentum direction and the pmissT vector.
5
Estimation of the backgrounds and selection efficiencies
All background sources except for the multijet production are modelled with simulation. The simulated event samples are corrected for differences between data and simulation in muon identification efficiencies and event trigger efficiency. A “tag-and-probe” method [35] is used to determine the differences between simulation and data for the efficiency of the trigger and for the muon identification and isolation criteria. This method uses Z → µµevents from both
data and simulated samples where the “tag” muon is required to pass the identification and isolation criteria. The efficiency measurements use the “probe” muon, which is required to pass minimal quality criteria. Trigger efficiency corrections are determined as a function of the muon
η, and are in general less than 5%. Muon isolation and identification efficiency corrections are
determined as a function of the muon pTand η, and are generally less than 2%. Corrections to
the simulation are applied on an event-by-event basis in the form of event weights.
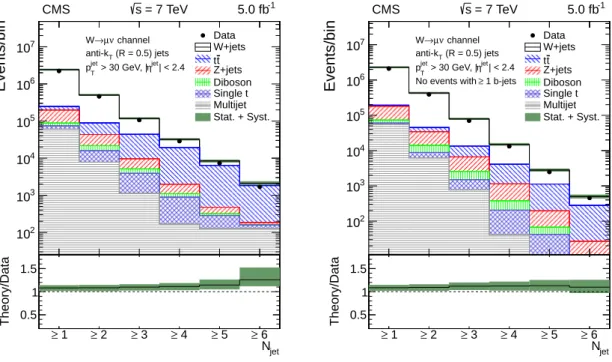
The dominant background to W+jets production is tt production, which has a larger total con-tribution than that of the W+jets signal in events with four or more jets. In order to reduce the level of tt contamination, a veto is applied to events with one or more b-tagged jets. Heavy-flavour tagging is based on a tag algorithm [42] that exploits the long lifetime of b-quark hadrons. This algorithm calculates the signed impact parameter significance of all tracks in the jet that satisfy high-quality reconstruction and purity criteria, and orders the tracks by de-creasing significance. The impact parameter significance is defined as the ratio of the impact parameter to its estimated uncertainty. For jets with two or more significant tracks, a high-efficiency b-quark discriminator is defined as the significance of the second most significant track. The size of the tt background is illustrated in Fig. 1, before and after the implementation of the b-jet veto, using the event selection described in Section 4. The expected contributions for the different processes in Fig. 1 are shown as a function of the jet multiplicity, along with the observed data. Differences in the tagging and mistagging rates between data and simulation are measured as a function of the jet pTin multijet and tt events [42], and are used to correct the
tagging rates of the jets in simulation. For jet multiplicities of 1 to 6, the b-jet veto eliminates 44–84% of the predicted tt background, while eliminating 3–26% of the predicted W+jets signal. The resulting increase in the signal purity allows for reductions in the total uncertainty in the measured cross sections of 6–43% for jet multiplicities of 4–6.
The shape and normalisations of the Z/γ∗+jets and tt predictions are cross-checked in selected data samples. The Z+jets background is compared to data in a Z-boson dominated data sample that requires two well-identified, isolated muons. The tt background is compared to data in a control region requiring at least two b-tagged jets. Background estimations from simulation and from data control samples agree within the uncertainties described in Section 7.
The multijet background is estimated using a data control sample with an inverted muon isola-tion requirement. In the control sample, the muon misidentificaisola-tion rate for multijet processes is estimated in the multijet-enriched sideband region with MT < 50 GeV, and the shape
tem-plate of the multijet distribution is determined in the region with MT >50 GeV. Contributions
from other processes to the multijet control region are subtracted, including the dominant con-tribution from W+jets. In order to improve the estimation of W+jets in the multijet control region, the W+jets contribution is first normalised to data in the MT > 50 GeV region with
the muon isolation condition applied. The multijet shape template is then rescaled accord-ing to the muon misidentification rate. For exclusive jet multiplicities of 1–4, the purity of the multijet-enriched inverted-isolation sideband region is 99.7–98.1%, and the purity of the W+jets contribution to the signal region is 92–76%. The multijet estimate corresponds to 32.7–1.9% of the total background estimate, or 2.6–0.3% of the total SM prediction.
jet N 1 2 3 4 5 6 Events/bin 2 10 3 10 4 10 5 10 6 10 7 10 Data W+jets t t Z+jets Diboson Single t Multijet Stat. + Syst. CMS -1 = 7 TeV 5.0 fb s CMS (R = 0.5) jets T anti-k | < 2.4 jet η > 30 GeV, | jet T p channel ν µ → W jet N 1 ≥ ≥ 2 ≥ 3 ≥ 4 ≥ 5 ≥ 6 Theory/Data 0.5 1 1.5 jet N 1 2 3 4 5 6 Events/bin 2 10 3 10 4 10 5 10 6 10 7 10 DataW+jets t t Z+jets Diboson Single t Multijet Stat. + Syst. CMS -1 = 7 TeV 5.0 fb s CMS (R = 0.5) jets T anti-k | < 2.4 jet η > 30 GeV, | jet T p channel ν µ → W 1 b-jets ≥ No events with jet N 1 ≥ ≥ 2 ≥ 3 ≥ 4 ≥ 5 ≥ 6 Theory/Data 0.5 1 1.5
Figure 1: The jet multiplicity in data and simulation before (left) and after (right) the b-jet veto. The W+jets contribution is modelled with MADGRAPH 5.1.1+PYTHIA 6.424. The solid band indicates the total statistical and systematic uncertainty in the W+jets signal and background predictions, as detailed in Section 7. This includes uncertainties in the jet energy scale and resolution, the muon momentum scale and resolution, the pileup modelling, the b-tagging correction factors, the normalisations of the simulations, and the efficiencies of reconstruction, identification, and trigger acceptance. A substantial reduction in the expected tt background is observed in the right plot.
6 7 Systematic uncertainties
6
The unfolding procedure
For the measurement of cross sections, the particle level is defined by a W boson, which decays into a muon and a muon neutrino, produced in association with one or more jets. Kinematic thresholds on the particle-level muon, MT, and jets are identical to those applied to the
recon-structed objects. Specifically, the particle-level selection includes the requirement of exactly one muon with pT >25 GeV and|η| <2.1, and MT >50 GeV. The particle-level EmissT is defined as
the negative of the vectorial sum of the transverse momenta of all visible final state particles. To account for final-state radiation, the momenta of all photons in a cone of∆R< 0.1 around the muon are added to that of the muon. Jets are clustered using the anti-kT[38] algorithm with
a distance parameter of 0.5. Clustering is performed using all particles after decay and frag-mentation, excluding neutrinos and the muon from the W boson decay. Additionally, jets are required to have pT>30 GeV and|η| <2.4, and to be separated from the muon by∆R>0.5.
The reconstructed distributions are corrected to the particle level with the method of regu-larised singular value decomposition (SVD) [10] unfolding, using the ROOUNFOLDtoolkit [43]. For each distribution, the total background, including the multijet estimate from data and all simulated processes except the W boson signal, is subtracted from the data before unfolding. A response matrix, defining the migration probability between the particle-level and recon-structed quantities, as well as the overall reconstruction efficiency, is computed using W+jets events simulated with MADGRAPH+PYTHIA. For a given particle-level quantity Q with a cor-responding reconstructed quantity Q0, the migration probability from an interval a<Q<b to an interval c<Q0 < d is defined as the fraction of events with a<Q<b that have c< Q0 <d. The unfolding of the jet multiplicity is performed with a response defined by the number of particle-level jets versus the number of reconstructed jets. For particle-level jet multiplicities of 1 to 6, 4 to 51% of simulated events exhibit migration to different values of reconstructed jet multiplicity. The unfolding of the kinematic distributions of the nth jet is performed with a response defined by the kinematic quantity of the nth-highest-pT particle-level jet versus that
of the nth-highest-pT reconstructed jet. To achieve a full migration from the selection of
re-constructed events to the particle-level phase space, no matching between rere-constructed and particle-level jets is applied. The contribution from the W → τνprocess with a muon in the
final state is estimated to be at the 1% level, and is not considered as part of the signal definition at the particle level.
The b-jet veto is treated as an overall event selection condition. Events failing this condition are treated as nonreconstructed in the unfolding response, so that the cross section obtained after unfolding is valid for W boson decays with associated jets of any flavour.
7
Systematic uncertainties
The sources of systematic uncertainties considered in this analysis are described below. The entirety of the unfolding procedure is repeated for each systematic variation, and the unfolded data results with these variations are compared with the central (unvaried) results to extract the uncertainties in the unfolded data distributions.
In most distributions, the dominant sources of systematic uncertainty include the jet energy scale and resolution uncertainties, which affect the shape of all reconstructed distributions as well as the overall event acceptance. The jet energy scale uncertainties are estimated by assign-ing a pT- and η-dependent uncertainty in jet energy corrections as discussed in Ref. [40], and
by varying the jet pTby the magnitude of the uncertainty. The uncertainties in jet energy
jets by an η-dependent value [40]. The jet energy uncertainties are determined by varying the pT of the jets in data rather than in simulation.
Muon momentum scale and resolution uncertainties also introduce uncertainties in the overall event acceptance. A muon momentum scale uncertainty of 0.2% and a muon momentum res-olution uncertainty of 0.6% are assumed [35]. The effects of these uncertainties are assessed by directly varying the momentum scale and randomly fluctuating the muon momentum in the simulation.
Variations for uncertainties in the energy and momentum scales and resolutions affect the size and shape of the background distribution to be subtracted from the data distribution, as well as the acceptance of W+jets simulated events, which define the response matrix used for un-folding. The variations are also propagated to the measurement of ETmiss, which affects the acceptance of the MT >50 GeV requirement.
Another important source of systematic uncertainty is the choice of the generator used in the unfolding procedure. The size of this uncertainty is assessed by repeating the unfolding proce-dure with a response trained on a separate simulated sample generated withSHERPA1.3.0. The absolute value of the difference between the data unfolded with a response matrix trained on SHERPAand with a response matrix trained on MADGRAPH+PYTHIAis treated as a symmetric uncertainty in the measurement.
Other minor sources of systematic uncertainty include the uncertainties in the background normalisation, the b-tagging efficiency, the modelling of the Wb contribution in the signal sim-ulation, integrated luminosity, the pileup modelling, the trigger and object identification ef-ficiencies, and the finite number of simulated events used to construct the response matrix. Background normalisation uncertainties are determined by varying the cross sections of the backgrounds within their theoretical uncertainties. For the Z+jets process, a normalisation un-certainty of 4.3% is calculated as the sum in quadrature of the factorisation/renormalisation scale and PDF uncertainties calculated in FEWZ [29]. For the diboson and single top-quark processes, uncertainties are calculated withMCFM[30–33] to be 4% and 6%, respectively. The uncertainty in the tt modelling is assessed by taking the difference between data and simu-lation in a control region with two or more b-tagged jets, and is estimated to be 5 to 12% for jet multiplicities of 2 to 6. The estimate of the multijet background has an uncertainty based on the limited number of events in the multijet sample and in the control regions where the multijet sample normalisation is calculated, and other systematic variations affecting the back-grounds in the multijet control regions introduce variations in the multijet normalization and template shape. For the b-tagging algorithm used to veto events containing b jets, uncertainties in the data/simulation ratio of the b-tagging efficiencies are applied. For jets with pT >30 GeV,
these uncertainties range from 3.1 to 10.5%. An additional uncertainty is ascribed to the nor-malisation of the Wb content in the simulation by examining the agreement between data and simulation as a function of jet multiplicity in a control region defined by requiring exactly one b-tagged jet. An increase in the normalisation of the Wb process of 120% is considered, yielding an uncertainty in the measurement of 0.5 to 11% for jet multiplicities of 1 to 6. The uncertainty in the integrated luminosity is 2.2% [3]. An uncertainty in the modelling of pileup in simula-tion is determined by varying the number of simulated pileup interacsimula-tions by 5% to account for the uncertainty in the luminosity and the uncertainty in the total inelastic cross section [44], as determined by a comparison of the number of reconstructed vertices in Z → µµevents in
data and simulation. Uncertainties in the differences between data and simulation efficiencies of the trigger, muon isolation, and muon identification criteria are generally less than 1%. An additional uncertainty due to the finite number of simulated events used to construct the
re-8 8 Results
sponse matrix is calculated by randomly varying the content of the response matrix according to a Poisson uncertainty in each bin.
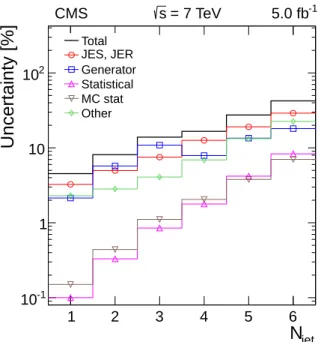
The effect of the systematic variations on the measured cross section as a function of the exclu-sive jet multiplicity is illustrated in Fig. 2. The uncertainties given in Fig. 2 are the total uncer-tainty for each jet multiplicity. The corresponding ranges of systematic unceruncer-tainty across bins of jet pTare given in Table 1.
jet
N
1 2 3 4 5 6Uncertainty [%]
-1 10 1 10 2 10 Total JES, JER Generator Statistical MC stat Other Total JES, JER Generator Statistical MC stat Other -1 = 7 TeV 5.0 fb s CMSFigure 2: The dominant systematic uncertainties in the measurement of the W+jets cross section as a function of the exclusive jet multiplicity. The systematic uncertainties displayed include the jet energy scale and resolution (JES, JER), the choice of generator used in the unfolding procedure (Generator), the statistical uncertainty in the data minus the background, propa-gated through the unfolding procedure (Statistical), the uncertainty due to a finite number of simulated events used to construct the response matrix (MC stat.), and all other systematic un-certainties (Other) detailed in Section 7, including pileup, integrated luminosity, background normalisation, b-tagging, muon momentum and resolution, trigger efficiency, muon identifica-tion. The uncertainties presented here correspond to the weighted average of the values shown in Table 1.
8
Results
The cross sections for exclusive and inclusive jet multiplicities are given in Fig. 3. In Figs. 4– 7 the differential cross sections are presented. The measured W+jets cross sections are compared to the predictions from several generators. We consider W+jets signal processes generated with MADGRAPH5.1.1 using the CTEQ6L1 PDF set, withSHERPA1.4.0 using the CT10 [45, 46] PDF set, and with BLACKHAT+SHERPA [17] using the CT10 PDF set. Predictions from MAD -GRAPH+PYTHIAandSHERPAare normalised to the NNLO inclusive cross sections calculated with FEWZ [29]. The SHERPA sample is a separate sample from that used for the evaluation of uncertainties in Section 7. The MADGRAPHandSHERPApredictions provide leading-order (LO) matrix element (ME) calculations at each jet multiplicity, which are then combined into inclusive samples by matching the ME partons to particle jets. Parton showering (PS) and hadronisation of the MADGRAPHsample is performed with PYTHIA 6.426 using the Z2 tune.
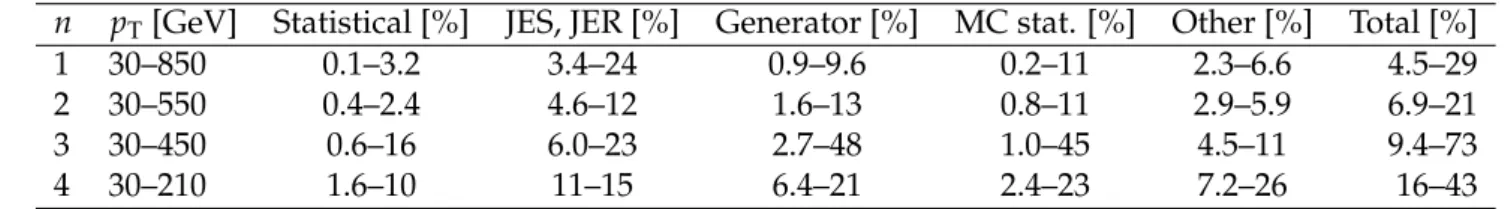
Table 1: Ranges of uncertainties for the measurement of dσ/dpTof the nth jet in events with n or
more jets. The uncertainties displayed include the statistical uncertainty in the data minus the background, propagated through the unfolding procedure (Statistical), the jet energy scale and resolution (JES, JER), the choice of generator used in the unfolding procedure (Generator), the uncertainty due to a finite number of simulated events used to construct the response matrix (MC stat.), and all other systematic uncertainties (Other) detailed in Section 7, including pileup, integrated luminosity, background normalisation, b-tagging, muon momentum and resolution, trigger efficiency, muon identification.
n pT[GeV] Statistical [%] JES, JER [%] Generator [%] MC stat. [%] Other [%] Total [%]
1 30–850 0.1–3.2 3.4–24 0.9–9.6 0.2–11 2.3–6.6 4.5–29 2 30–550 0.4–2.4 4.6–12 1.6–13 0.8–11 2.9–5.9 6.9–21 3 30–450 0.6–16 6.0–23 2.7–48 1.0–45 4.5–11 9.4–73
4 30–210 1.6–10 11–15 6.4–21 2.4–23 7.2–26 16–43
The MADGRAPH +PYTHIA calculation includes the production of up to four partons. The jet matching is performed following the kT-MLM prescription [47], where partons are clustered
using the kT algorithm with a distance parameter of D = 1. The kT clustering thresholds are
chosen to be 10 GeV and 20 GeV at the matrix-element and parton-shower level, respectively. The factorisation scale for each event is chosen to be the transverse mass computed after kT
-clustering of the event down to a 2→2 topology. The renormalisation scale for the event is the kTcomputed at each vertex splitting. The predictions fromSHERPAinclude the production
of up to four partons. The matching between jets and partons is performed with the CKKW matching scheme [47], and the default factorisation and renormalisation scales are used. The predictions from MADGRAPH+PYTHIA andSHERPA are shown with statistical uncertain-ties only. These MADGRAPH+PYTHIA andSHERPA samples are processed through the RIVET toolkit [48] in order to create particle level distributions, which can be compared with the un-folded data. The BLACKHAT+SHERPAsamples represent fixed-order predictions at the level of ME partons of W+n jets at NLO accuracy, for n = 1, 2, 3, 4, and 5 jets. Each measured dis-tribution for a given inclusive jet multiplicity is compared with the corresponding fixed-order prediction from BLACKHAT+SHERPA. The choice of renormalisation and factorisation scales for BLACKHAT+SHERPA is ˆHT0/2, where ˆHT0 ≡ ∑mpmT +EWT , m represents the final state partons, and EWT is the transverse energy of the W boson. Before comparing to data, a nonperturba-tive correction is applied to the BLACKHAT+SHERPAdistributions to account for the effects of multiple-parton interactions and hadronisation. The nonperturbative correction is determined using MADGRAPH 5.1.1 interfaced toPYTHIA6.426 and turning on and off the hadronisation and multiple-parton interactions. The magnitude of the nonperturbative correction is typically 1–5%, and is calculated for each bin of each measured distribution. The model dependence of the nonperturbative correction is negligible [49]. The BLACKHAT+SHERPA prediction also includes uncertainties due to the PDF and variations of the factorisation and renormalisation scales. The nominal prediction is given by the central value of the CT10 PDF set, and the PDF uncertainty considers the envelope of the error sets of CT10, MSTW2008nlo68cl [50], and NNPDF2.1 [51] according to the PDF4LHC prescription [52, 53]. The factorisation and renor-malisation scale uncertainty is determined by varying the scales simultaneously by a factor 0.5 or 2.0.
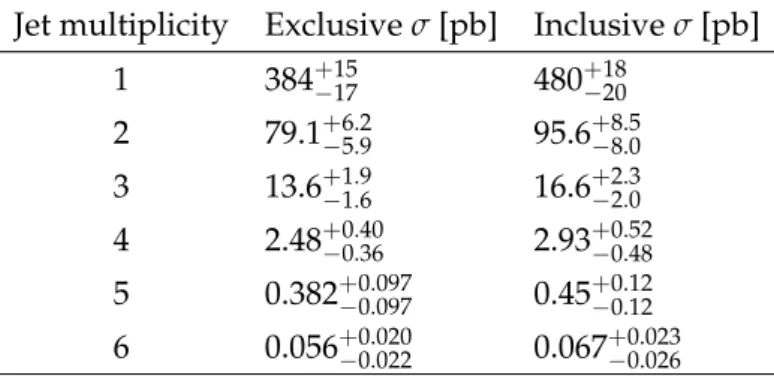
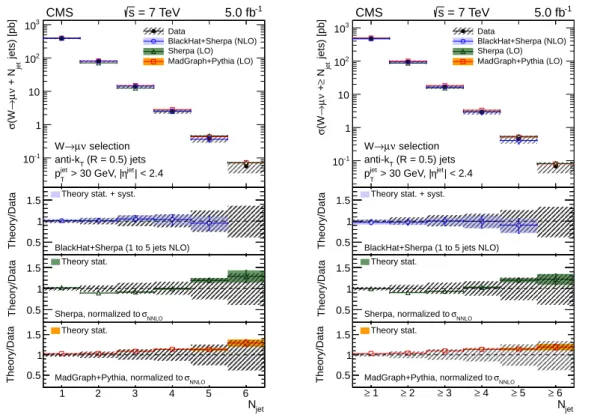
The unfolded exclusive and inclusive jet multiplicity distributions, shown in Fig. 3, are found to be in agreement, within uncertainties, with the predictions of the generators and with the NLO calculation of BLACKHAT+SHERPA. Table 2 details the measured cross sections as a function of the inclusive and exclusive jet multiplicity.
10 9 Summary
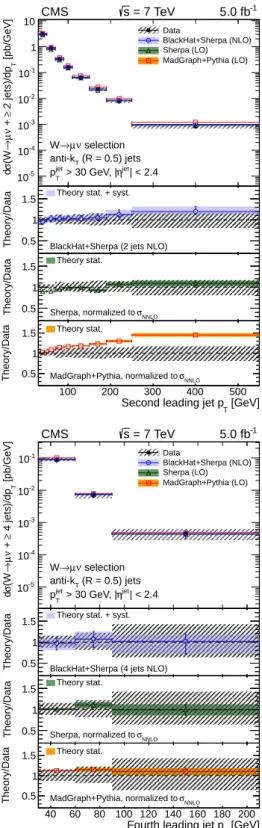
The jet pT unfolded distributions for inclusive jet multiplicities from 1 to 4 are shown in Fig. 4.
The predictions of BLACKHAT+SHERPAare in agreement with the measured distributions within the systematic uncertainties, while MADGRAPH+PYTHIAis observed to overestimate the yields up to 50% (45%) for the first (second) leading jet pTdistributions at high-pTvalues. The
predic-tions fromSHERPAare found to agree well for the second-, third-, and fourth-leading jet pT
dis-tributions, while an excess of slightly more than one standard deviation can be seen at high-pT
values for the leading jet pT distribution. Similar observations hold for MADGRAPH+PYTHIA
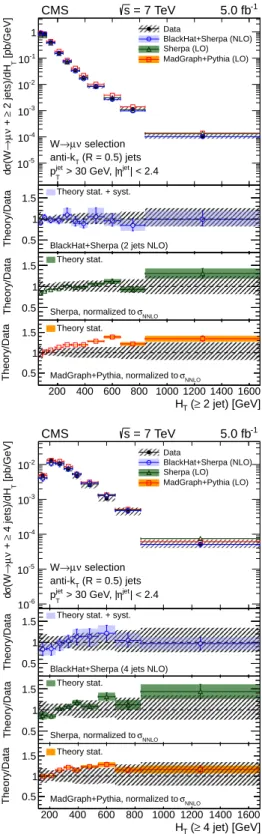
andSHERPApredictions in the HTdistributions for inclusive jet multiplicities of 1–4, as shown
in Fig. 5. Since the BLACKHAT+SHERPANLO prediction for HT(≥1 jet)is a fixed-order
predic-tion with up to two real partons, contribupredic-tions from higher jet multiplicities are missing, which results in an underestimation in the tail of the distribution [54]. Similar observations have been made with W+jets measurements at D0 [7] and ATLAS [4]. In general,SHERPAmodels the HT
distributions better than other generators.
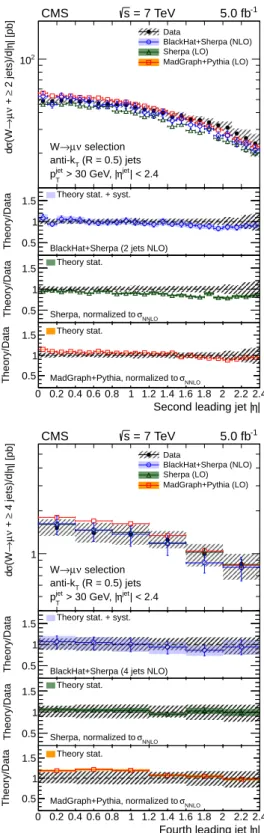
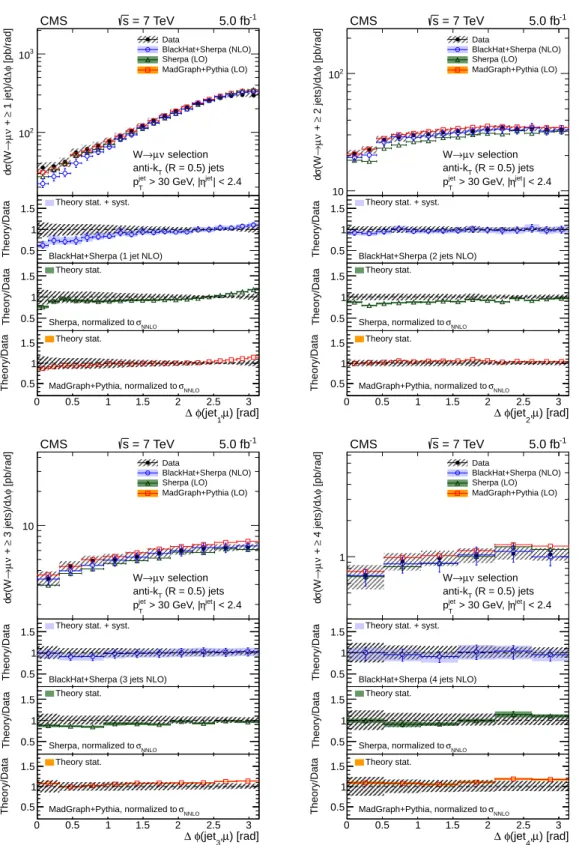
The distributions of the jet η and of the difference in azimuthal angle between each jet and the muon are shown in Figs. 6 and 7, respectively. The measurements of the jet η agree with pre-dictions from all generators, with MADGRAPH+PYTHIA and BLACKHAT+SHERPAperforming best. The measurements of the∆φ between the leading jet and the muon are underestimated by as much as 38% by BLACKHAT+SHERPA, with similar, but smaller, underestimations in pre-dictions from MADGRAPH+PYTHIAandSHERPA.
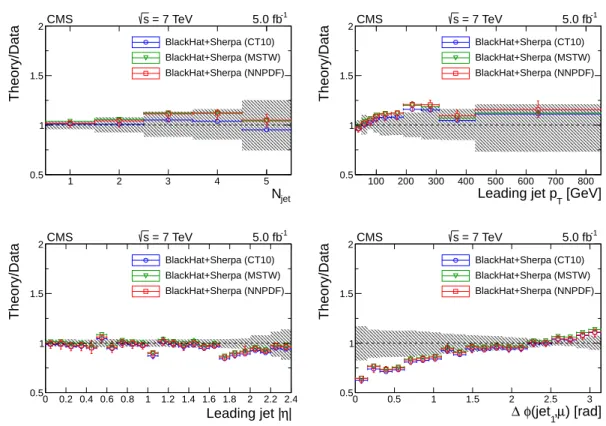
Examples of the variation in the BLACKHAT+SHERPA prediction due to the choice of PDF are given in Fig. 8, in which the predictions with the MSTW2008nlo68cl, NNPDF2.1, and CT10 PDF sets are compared to the measurements from data. The distributions determined with the different PDF sets are consistent with one another.
Table 2: Cross section measurements with statistical and systematic uncertainties for inclusive and exclusive jet multiplicities up to 6 jets.
Jet multiplicity Exclusive σ [pb] Inclusive σ [pb] 1 384+−1517 480+−1820 2 79.1+−6.25.9 95.6+−8.58.0 3 13.6+−1.91.6 16.6+−2.32.0 4 2.48+−0.400.36 2.93+−0.520.48 5 0.382+−0.0970.097 0.45+−0.120.12 6 0.056+−0.0200.022 0.067+−0.0230.026
9
Summary
Measurements of the cross sections and differential cross sections for a W boson produced in association with jets in pp collisions at a centre-of-mass energy of 7 TeV have been presented. The data were collected with the CMS detector during the 2011 pp run of the LHC, and corre-spond to an integrated luminosity of 5.0 fb−1. Cross sections have been determined using the muon decay mode of the W boson and were presented as functions of the jet multiplicity, the transverse momenta and pseudorapidities of the four leading jets, the difference in azimuthal angle between each jet and the muon, and the HT for jet multiplicities up to four. The results,
corrected for all detector effects by means of regularised unfolding, have been compared with particle-level simulated predictions from pQCD.
jets) [pb] jet + N νµ → (W σ -1 10 1 10 2 10 3 10 Data BlackHat+Sherpa (NLO) Sherpa (LO) MadGraph+Pythia (LO) -1 = 7 TeV 5.0 fb s CMS (R = 0.5) jets T anti-k | < 2.4 jet η > 30 GeV, | jet T p selection ν µ → W jet N 1 2 3 4 5 6 Theory/Data 0.5 1 1.5
BlackHat+Sherpa (1 to 5 jets NLO) Theory stat. + syst.
jet N 1 2 3 4 5 6 Theory/Data 0.5 1 1.5 NNLO σ Sherpa, normalized to Theory stat. jet N 1 2 3 4 5 6 Theory/Data 0.5 1 1.5 NNLO σ MadGraph+Pythia, normalized to Theory stat. jets) [pb] jet N ≥ + νµ → (W σ -1 10 1 10 2 10 3 10 Data BlackHat+Sherpa (NLO) Sherpa (LO) MadGraph+Pythia (LO) -1 = 7 TeV 5.0 fb s CMS (R = 0.5) jets T anti-k | < 2.4 jet η > 30 GeV, | jet T p selection ν µ → W jet N 1 2 3 4 5 6 Theory/Data 0.5 1 1.5
BlackHat+Sherpa (1 to 5 jets NLO) Theory stat. + syst.
jet N 1 2 3 4 5 6 Theory/Data 0.5 1 1.5 NNLO σ Sherpa, normalized to Theory stat. jet N 1 ≥ ≥ 2 ≥ 3 ≥ 4 ≥ 5 ≥ 6 Theory/Data 0.5 1 1.5 NNLO σ MadGraph+Pythia, normalized to Theory stat.
Figure 3: The cross section measurement for the exclusive and inclusive jet multiplicities, compared to the predictions of MADGRAPH 5.1.1 +PYTHIA 6.426,SHERPA 1.4.0, and BLACK -HAT+SHERPA (corrected for hadronisation and multiple-parton interactions). Black circular markers with the grey hatched band represent the unfolded data measurement and its uncer-tainty. Overlaid are the predictions together with their statistical uncertainties (Theory stat.). The BLACKHAT+SHERPAuncertainty also contains theoretical systematic uncertainties (Theory syst.) described in Section 8. The lower plots show the ratio of each prediction to the unfolded data.
Predictions from generators, MADGRAPH+PYTHIA and SHERPA, and NLO calculations from BLACKHAT+SHERPA, describe the jet multiplicity within the uncertainties. The cross section as a function of the pT of the leading jet is overestimated by MADGRAPH+PYTHIAandSHERPA,
especially at high-pT. Some overestimation from MADGRAPH+PYTHIA can also be observed
in the second- and third-leading jet pT distributions. The cross sections as a function of pT
predicted by BLACKHAT+SHERPAagree with the measurements within uncertainties. The pre-dictions from BLACKHAT+SHERPA underestimate the measurement of the cross section as a function of HT for Njet ≥ 1, since the contribution from W+≥3 jets is missing from an NLO
prediction of W+≥1 jet. The cross sections as a function of HT for Njet ≥ 2, 3, and 4 predicted
by BLACKHAT+SHERPA agree with the measurements within the uncertainties. The distribu-tions of∆φ between the leading jet and the muon are underestimated by all predictions for ∆φ values near zero, with the largest disagreement visible in BLACKHAT+SHERPA. The distribu-tions of ∆φ between the second-, third-, and fourth-leading jets and the muon agree with all predictions within uncertainties. No significant disagreement was found in the distributions of
12 9 Summary [pb/GeV] T 1 jet)/dp ≥ + νµ → (W σ d -5 10 -4 10 -3 10 -2 10 -1 10 1
10 DataBlackHat+Sherpa (NLO)
Sherpa (LO) MadGraph+Pythia (LO) -1 = 7 TeV 5.0 fb s CMS (R = 0.5) jets T anti-k | < 2.4 jet η > 30 GeV, | jet T p selection ν µ → W [GeV] T Leading jet p 100 200 300 400 500 600 700 800 Theory/Data 0.5 1 1.5
BlackHat+Sherpa (1 jet NLO) Theory stat. + syst.
[GeV] T Leading jet p 100 200 300 400 500 600 700 800 Theory/Data 0.5 1 1.5 NNLO σ Sherpa, normalized to Theory stat. [GeV] T Leading jet p 100 200 300 400 500 600 700 800 Theory/Data 0.5 1 1.5 NNLO σ MadGraph+Pythia, normalized to Theory stat. [pb/GeV] T 2 jets)/dp ≥ + νµ → (W σ d -5 10 -4 10 -3 10 -2 10 -1 10 1 10 Data BlackHat+Sherpa (NLO) Sherpa (LO) MadGraph+Pythia (LO) -1 = 7 TeV 5.0 fb s CMS (R = 0.5) jets T anti-k | < 2.4 jet η > 30 GeV, | jet T p selection ν µ → W [GeV] T
Second leading jet p
100 200 300 400 500
Theory/Data 0.5 1 1.5
BlackHat+Sherpa (2 jets NLO) Theory stat. + syst.
[GeV]
T
Second leading jet p
100 200 300 400 500 Theory/Data 0.5 1 1.5 NNLO σ Sherpa, normalized to Theory stat. [GeV] T
Second leading jet p
100 200 300 400 500 Theory/Data 0.5 1 1.5 NNLO σ MadGraph+Pythia, normalized to Theory stat. [pb/GeV] T 3 jets)/dp ≥ + νµ → (W σ d -6 10 -5 10 -4 10 -3 10 -2 10 -1 10 1 Data BlackHat+Sherpa (NLO) Sherpa (LO) MadGraph+Pythia (LO) -1 = 7 TeV 5.0 fb s CMS (R = 0.5) jets T anti-k | < 2.4 jet η > 30 GeV, | jet T p selection ν µ → W [GeV] T
Third leading jet p
50 100 150 200 250 300 350 400 450
Theory/Data 0.5 1 1.5
BlackHat+Sherpa (3 jets NLO) Theory stat. + syst.
[GeV]
T
Third leading jet p
50 100 150 200 250 300 350 400 450 Theory/Data 0.5 1 1.5 NNLO σ Sherpa, normalized to Theory stat. [GeV] T
Third leading jet p
50 100 150 200 250 300 350 400 450 Theory/Data 0.5 1 1.5 NNLO σ MadGraph+Pythia, normalized to Theory stat. [pb/GeV] T 4 jets)/dp ≥ + νµ → (W σ d -5 10 -4 10 -3 10 -2 10 -1
10 DataBlackHat+Sherpa (NLO)
Sherpa (LO) MadGraph+Pythia (LO) -1 = 7 TeV 5.0 fb s CMS (R = 0.5) jets T anti-k | < 2.4 jet η > 30 GeV, | jet T p selection ν µ → W [GeV] T
Fourth leading jet p
40 60 80 100 120 140 160 180 200
Theory/Data 0.5 1 1.5
BlackHat+Sherpa (4 jets NLO) Theory stat. + syst.
[GeV]
T
Fourth leading jet p
40 60 80 100 120 140 160 180 200 Theory/Data 0.5 1 1.5 NNLO σ Sherpa, normalized to Theory stat. [GeV] T
Fourth leading jet p
40 60 80 100 120 140 160 180 200 Theory/Data 0.5 1 1.5 NNLO σ MadGraph+Pythia, normalized to Theory stat.
Figure 4: The differential cross section measurement for the leading four jets’ transverse mo-menta, compared to the predictions of MADGRAPH 5.1.1 + PYTHIA 6.426, SHERPA 1.4.0, and BLACKHAT+SHERPA(corrected for hadronisation and multiple-parton interactions). Black cir-cular markers with the grey hatched band represent the unfolded data measurement and its uncertainty. Overlaid are the predictions together with their statistical uncertainties (Theory stat.). The BLACKHAT+SHERPA uncertainty also contains theoretical systematic uncertainties (Theory syst.) described in Section 8. The lower plots show the ratio of each prediction to the unfolded data.
[pb/GeV] T 1 jet)/dH ≥ + νµ → (W σ d -5 10 -4 10 -3 10 -2 10 -1 10 1 10 Data BlackHat+Sherpa (NLO) Sherpa (LO) MadGraph+Pythia (LO) -1 = 7 TeV 5.0 fb s CMS (R = 0.5) jets T anti-k | < 2.4 jet η > 30 GeV, | jet T p selection ν µ → W 1 jet) [GeV] ≥ ( T H 200 400 600 800 1000 1200 1400 1600 Theory/Data 0.5 1 1.5
BlackHat+Sherpa (1 jet NLO) Theory stat. + syst.
1 jet) [GeV] ≥ ( T H 200 400 600 800 1000 1200 1400 1600 Theory/Data 0.5 1 1.5 NNLO σ Sherpa, normalized to Theory stat. 1 jet) [GeV] ≥ ( T H 200 400 600 800 1000 1200 1400 1600 Theory/Data 0.5 1 1.5 NNLO σ MadGraph+Pythia, normalized to Theory stat. [pb/GeV] T 2 jets)/dH ≥ + νµ → (W σ d -5 10 -4 10 -3 10 -2 10 -1 10 1 Data BlackHat+Sherpa (NLO) Sherpa (LO) MadGraph+Pythia (LO) -1 = 7 TeV 5.0 fb s CMS (R = 0.5) jets T anti-k | < 2.4 jet η > 30 GeV, | jet T p selection ν µ → W 2 jet) [GeV] ≥ ( T H 200 400 600 800 1000 1200 1400 1600 Theory/Data 0.5 1 1.5
BlackHat+Sherpa (2 jets NLO) Theory stat. + syst.
2 jet) [GeV] ≥ ( T H 200 400 600 800 1000 1200 1400 1600 Theory/Data 0.5 1 1.5 NNLO σ Sherpa, normalized to Theory stat. 2 jet) [GeV] ≥ ( T H 200 400 600 800 1000 1200 1400 1600 Theory/Data 0.5 1 1.5 NNLO σ MadGraph+Pythia, normalized to Theory stat. [pb/GeV] T 3 jets)/dH ≥ + νµ → (W σ d -5 10 -4 10 -3 10 -2 10 -1
10 DataBlackHat+Sherpa (NLO) Sherpa (LO) MadGraph+Pythia (LO) -1 = 7 TeV 5.0 fb s CMS (R = 0.5) jets T anti-k | < 2.4 jet η > 30 GeV, | jet T p selection ν µ → W 3 jet) [GeV] ≥ ( T H 200 400 600 800 1000 1200 1400 1600 Theory/Data 0.5 1 1.5
BlackHat+Sherpa (3 jets NLO) Theory stat. + syst.
3 jet) [GeV] ≥ ( T H 200 400 600 800 1000 1200 1400 1600 Theory/Data 0.5 1 1.5 NNLO σ Sherpa, normalized to Theory stat. 3 jet) [GeV] ≥ ( T H 200 400 600 800 1000 1200 1400 1600 Theory/Data 0.5 1 1.5 NNLO σ MadGraph+Pythia, normalized to Theory stat. [pb/GeV] T 4 jets)/dH ≥ + νµ → (W σ d -6 10 -5 10 -4 10 -3 10 -2 10 Data BlackHat+Sherpa (NLO) Sherpa (LO) MadGraph+Pythia (LO) -1 = 7 TeV 5.0 fb s CMS (R = 0.5) jets T anti-k | < 2.4 jet η > 30 GeV, | jet T p selection ν µ → W 4 jet) [GeV] ≥ ( T H 200 400 600 800 1000 1200 1400 1600 Theory/Data 0.5 1 1.5
BlackHat+Sherpa (4 jets NLO) Theory stat. + syst.
4 jet) [GeV] ≥ ( T H 200 400 600 800 1000 1200 1400 1600 Theory/Data 0.5 1 1.5 NNLO σ Sherpa, normalized to Theory stat. 4 jet) [GeV] ≥ ( T H 200 400 600 800 1000 1200 1400 1600 Theory/Data 0.5 1 1.5 NNLO σ MadGraph+Pythia, normalized to Theory stat.
Figure 5: The differential cross section measurement for HT for inclusive jet multiplicities 1–4,
compared to the predictions of MADGRAPH 5.1.1 +PYTHIA 6.426,SHERPA 1.4.0, and BLACK -HAT+SHERPA (corrected for hadronisation and multiple-parton interactions). Black circular markers with the grey hatched band represent the unfolded data measurement and its uncer-tainty. Overlaid are the predictions together with their statistical uncertainties (Theory stat.). The BLACKHAT+SHERPAuncertainty also contains theoretical systematic uncertainties (Theory syst.) described in Section 8. The lower plots show the ratio of each prediction to the unfolded data.
14 9 Summary | [pb] η 1 jet)/d| ≥ + νµ → (W σ d 2 10 3 10 Data BlackHat+Sherpa (NLO) Sherpa (LO) MadGraph+Pythia (LO) -1 = 7 TeV 5.0 fb s CMS (R = 0.5) jets T anti-k | < 2.4 jet η > 30 GeV, | jet T p selection ν µ → W | η Leading jet | 0 0.2 0.4 0.6 0.8 1 1.2 1.4 1.6 1.8 2 2.2 2.4 Theory/Data 0.5 1 1.5
BlackHat+Sherpa (1 jet NLO) Theory stat. + syst.
| η Leading jet | 0 0.2 0.4 0.6 0.8 1 1.2 1.4 1.6 1.8 2 2.2 2.4 Theory/Data 0.5 1 1.5 NNLO σ Sherpa, normalized to Theory stat. | η Leading jet | 0 0.2 0.4 0.6 0.8 1 1.2 1.4 1.6 1.8 2 2.2 2.4 Theory/Data 0.5 1 1.5 NNLO σ MadGraph+Pythia, normalized to Theory stat. | [pb] η 2 jets)/d| ≥ + νµ → (W σ d 2 10 Data BlackHat+Sherpa (NLO) Sherpa (LO) MadGraph+Pythia (LO) -1 = 7 TeV 5.0 fb s CMS (R = 0.5) jets T anti-k | < 2.4 jet η > 30 GeV, | jet T p selection ν µ → W | η
Second leading jet |
0 0.2 0.4 0.6 0.8 1 1.2 1.4 1.6 1.8 2 2.2 2.4 Theory/Data 0.5
1 1.5
BlackHat+Sherpa (2 jets NLO) Theory stat. + syst.
|
η
Second leading jet |
0 0.2 0.4 0.6 0.8 1 1.2 1.4 1.6 1.8 2 2.2 2.4 Theory/Data 0.5 1 1.5 NNLO σ Sherpa, normalized to Theory stat. | η
Second leading jet |
0 0.2 0.4 0.6 0.8 1 1.2 1.4 1.6 1.8 2 2.2 2.4 Theory/Data 0.5 1 1.5 NNLO σ MadGraph+Pythia, normalized to Theory stat. | [pb] η 3 jets)/d| ≥ + νµ → (W σ d 10 Data BlackHat+Sherpa (NLO) Sherpa (LO) MadGraph+Pythia (LO) -1 = 7 TeV 5.0 fb s CMS (R = 0.5) jets T anti-k | < 2.4 jet η > 30 GeV, | jet T p selection ν µ → W | η
Third leading jet |
0 0.2 0.4 0.6 0.8 1 1.2 1.4 1.6 1.8 2 2.2 2.4 Theory/Data 0.5
1 1.5
BlackHat+Sherpa (3 jets NLO) Theory stat. + syst.
|
η
Third leading jet |
0 0.2 0.4 0.6 0.8 1 1.2 1.4 1.6 1.8 2 2.2 2.4 Theory/Data 0.5 1 1.5 NNLO σ Sherpa, normalized to Theory stat. | η
Third leading jet |
0 0.2 0.4 0.6 0.8 1 1.2 1.4 1.6 1.8 2 2.2 2.4 Theory/Data 0.5 1 1.5 NNLO σ MadGraph+Pythia, normalized to Theory stat. | [pb] η 4 jets)/d| ≥ + νµ → (W σ d 1 Data BlackHat+Sherpa (NLO) Sherpa (LO) MadGraph+Pythia (LO) -1 = 7 TeV 5.0 fb s CMS (R = 0.5) jets T anti-k | < 2.4 jet η > 30 GeV, | jet T p selection ν µ → W | η
Fourth leading jet |
0 0.2 0.4 0.6 0.8 1 1.2 1.4 1.6 1.8 2 2.2 2.4 Theory/Data 0.5
1 1.5
BlackHat+Sherpa (4 jets NLO) Theory stat. + syst.
|
η
Fourth leading jet |
0 0.2 0.4 0.6 0.8 1 1.2 1.4 1.6 1.8 2 2.2 2.4 Theory/Data 0.5 1 1.5 NNLO σ Sherpa, normalized to Theory stat. | η
Fourth leading jet |
0 0.2 0.4 0.6 0.8 1 1.2 1.4 1.6 1.8 2 2.2 2.4 Theory/Data 0.5 1 1.5 NNLO σ MadGraph+Pythia, normalized to Theory stat.
Figure 6: The differential cross section measurement for the pseudorapidity of the four lead-ing jets, compared to the predictions of MADGRAPH 5.1.1 +PYTHIA 6.426, SHERPA1.4.0, and BLACKHAT+SHERPA(corrected for hadronisation and multiple-parton interactions). Black cir-cular markers with the grey hatched band represent the unfolded data measurement and its uncertainty. Overlaid are the predictions together with their statistical uncertainties (Theory stat.). The BLACKHAT+SHERPA uncertainty also contains theoretical systematic uncertainties (Theory syst.) described in Section 8. The lower plots show the ratio of each prediction to the unfolded data.
[pb/rad] φ∆ 1 jet)/d ≥ + νµ → (W σ d 2 10 3 10 Data BlackHat+Sherpa (NLO) Sherpa (LO) MadGraph+Pythia (LO) -1 = 7 TeV 5.0 fb s CMS (R = 0.5) jets T anti-k | < 2.4 jet η > 30 GeV, | jet T p selection ν µ → W ) [rad] µ , 1 (jet φ ∆ 0 0.5 1 1.5 2 2.5 3 Theory/Data 0.5 1 1.5
BlackHat+Sherpa (1 jet NLO) Theory stat. + syst.
) [rad] µ , 1 (jet φ ∆ 0 0.5 1 1.5 2 2.5 3 Theory/Data 0.5 1 1.5 NNLO σ Sherpa, normalized to Theory stat. ) [rad] µ , 1 (jet φ ∆ 0 0.5 1 1.5 2 2.5 3 Theory/Data 0.5 1 1.5 NNLO σ MadGraph+Pythia, normalized to Theory stat. [pb/rad] φ∆ 2 jets)/d ≥ + νµ → (W σ d 10 2 10 Data BlackHat+Sherpa (NLO) Sherpa (LO) MadGraph+Pythia (LO) -1 = 7 TeV 5.0 fb s CMS (R = 0.5) jets T anti-k | < 2.4 jet η > 30 GeV, | jet T p selection ν µ → W ) [rad] µ , 2 (jet φ ∆ 0 0.5 1 1.5 2 2.5 3 Theory/Data 0.5 1 1.5
BlackHat+Sherpa (2 jets NLO) Theory stat. + syst.
) [rad] µ , 2 (jet φ ∆ 0 0.5 1 1.5 2 2.5 3 Theory/Data 0.5 1 1.5 NNLO σ Sherpa, normalized to Theory stat. ) [rad] µ , 2 (jet φ ∆ 0 0.5 1 1.5 2 2.5 3 Theory/Data 0.5 1 1.5 NNLO σ MadGraph+Pythia, normalized to Theory stat. [pb/rad] φ∆ 3 jets)/d ≥ + νµ → (W σ d 10 Data BlackHat+Sherpa (NLO) Sherpa (LO) MadGraph+Pythia (LO) -1 = 7 TeV 5.0 fb s CMS (R = 0.5) jets T anti-k | < 2.4 jet η > 30 GeV, | jet T p selection ν µ → W ) [rad] µ , 3 (jet φ ∆ 0 0.5 1 1.5 2 2.5 3 Theory/Data 0.5 1 1.5
BlackHat+Sherpa (3 jets NLO) Theory stat. + syst.
) [rad] µ , 3 (jet φ ∆ 0 0.5 1 1.5 2 2.5 3 Theory/Data 0.5 1 1.5 NNLO σ Sherpa, normalized to Theory stat. ) [rad] µ , 3 (jet φ ∆ 0 0.5 1 1.5 2 2.5 3 Theory/Data 0.5 1 1.5 NNLO σ MadGraph+Pythia, normalized to Theory stat. [pb/rad] φ∆ 4 jets)/d ≥ + νµ → (W σ d 1 Data BlackHat+Sherpa (NLO) Sherpa (LO) MadGraph+Pythia (LO) -1 = 7 TeV 5.0 fb s CMS (R = 0.5) jets T anti-k | < 2.4 jet η > 30 GeV, | jet T p selection ν µ → W ) [rad] µ , 4 (jet φ ∆ 0 0.5 1 1.5 2 2.5 3 Theory/Data 0.5 1 1.5
BlackHat+Sherpa (4 jets NLO) Theory stat. + syst.
) [rad] µ , 4 (jet φ ∆ 0 0.5 1 1.5 2 2.5 3 Theory/Data 0.5 1 1.5 NNLO σ Sherpa, normalized to Theory stat. ) [rad] µ , 4 (jet φ ∆ 0 0.5 1 1.5 2 2.5 3 Theory/Data 0.5 1 1.5 NNLO σ MadGraph+Pythia, normalized to Theory stat.
Figure 7: The differential cross section measurement in∆φ(jetn, µ), for n = 1 - 4, compared to the predictions of MADGRAPH 5.1.1 + PYTHIA 6.426, SHERPA 1.4.0, and BLACKHAT+SHERPA (corrected for hadronisation and multiple-parton interactions). Black circular markers with the grey hatched band represent the unfolded data measurement and its uncertainty. Over-laid are the predictions together with their statistical uncertainties (Theory stat.). The BLACK -HAT+SHERPAuncertainty also contains theoretical systematic uncertainties (Theory syst.) de-scribed in Section 8. The lower plots show the ratio of each prediction to the unfolded data.
16 9 Summary jet N 1 2 3 4 5 Theory/Data 0.5 1 1.5 2 BlackHat+Sherpa (CT10) BlackHat+Sherpa (MSTW) BlackHat+Sherpa (NNPDF) -1 = 7 TeV 5.0 fb s CMS [GeV] T Leading jet p 100 200 300 400 500 600 700 800 Theory/Data 0.5 1 1.5 2 BlackHat+Sherpa (CT10) BlackHat+Sherpa (MSTW) BlackHat+Sherpa (NNPDF) -1 = 7 TeV 5.0 fb s CMS | η Leading jet | 0 0.2 0.4 0.6 0.8 1 1.2 1.4 1.6 1.8 2 2.2 2.4 Theory/Data 0.5 1 1.5 2 BlackHat+Sherpa (CT10) BlackHat+Sherpa (MSTW) BlackHat+Sherpa (NNPDF) -1 = 7 TeV 5.0 fb s CMS ) [rad] µ , 1 (jet φ ∆ 0 0.5 1 1.5 2 2.5 3 Theory/Data 0.5 1 1.5 2 BlackHat+Sherpa (CT10) BlackHat+Sherpa (MSTW) BlackHat+Sherpa (NNPDF) -1 = 7 TeV 5.0 fb s CMS
Figure 8: The ratio of the predictions of BLACKHAT+SHERPAto the cross section measurements for four different quantities. The circular, triangular, and square markers indicate the predic-tions using the CT10, MSTW2008nlo68cl, and NNPDF PDF sets, respectively. The grey hatched band indicates the total uncertainty in the unfolded data measurement.
Acknowledgments
We extend our thanks to Daniel Maˆıtre and Zvi Bern for the production of data and tools used to create the BLACKHAT+SHERPA predictions, and for the sharing of expertise and advice re-garding these predictions.
We congratulate our colleagues in the CERN accelerator departments for the excellent perfor-mance of the LHC and thank the technical and administrative staffs at CERN and at other CMS institutes for their contributions to the success of the CMS effort. In addition, we gratefully acknowledge the computing centres and personnel of the Worldwide LHC Computing Grid for delivering so effectively the computing infrastructure essential to our analyses. Finally, we acknowledge the enduring support for the construction and operation of the LHC and the CMS detector provided by the following funding agencies: BMWFW and FWF (Austria); FNRS and FWO (Belgium); CNPq, CAPES, FAPERJ, and FAPESP (Brazil); MES (Bulgaria); CERN; CAS, MoST, and NSFC (China); COLCIENCIAS (Colombia); MSES and CSF (Croatia); RPF (Cyprus); MoER, ERC IUT and ERDF (Estonia); Academy of Finland, MEC, and HIP (Finland); CEA and CNRS/IN2P3 (France); BMBF, DFG, and HGF (Germany); GSRT (Greece); OTKA and NIH (Hungary); DAE and DST (India); IPM (Iran); SFI (Ireland); INFN (Italy); NRF and WCU (Re-public of Korea); LAS (Lithuania); MOE and UM (Malaysia); CINVESTAV, CONACYT, SEP, and UASLP-FAI (Mexico); MBIE (New Zealand); PAEC (Pakistan); MSHE and NSC (Poland); FCT (Portugal); JINR (Dubna); MON, RosAtom, RAS and RFBR (Russia); MESTD (Serbia); SEIDI and CPAN (Spain); Swiss Funding Agencies (Switzerland); MST (Taipei); ThEPCenter, IPST, STAR and NSTDA (Thailand); TUBITAK and TAEK (Turkey); NASU and SFFR (Ukraine); STFC (United Kingdom); DOE and NSF (USA).
Individuals have received support from the Marie-Curie programme and the European Research Council and EPLANET (European Union); the Leventis Foundation; the A. P. Sloan Foundation; the Alexander von Humboldt Foundation; the Belgian Federal Science Policy Office; the Fonds pour la Formation `a la Recherche dans l’Industrie et dans l’Agriculture (FRIA-Belgium); the Agentschap voor Innovatie door Wetenschap en Technologie
(IWT-Belgium); the Ministry of Education, Youth and Sports (MEYS) of the Czech Republic; the Council of Science and Industrial Research, India; the HOMING PLUS programme of Foundation for Polish Science, cofinanced from European Union, Regional Development Fund; the Compagnia di San Paolo (Torino); the Thalis and Aristeia programmes cofinanced by EU-ESF and the Greek NSRF; and the National Priorities Research Program by Qatar National Research Fund.
References
[1] CMS Collaboration, “Measurement of the tt production cross section in pp collisions at√ s =7 TeV with lepton + jets final states”, Phys. Lett. B 720 (2012) 83,
doi:10.1016/j.physletb.2013.02.021, arXiv:1212.6682.
[2] CMS Collaboration, “Measurement of the single-top-quark t-channel cross section in pp collisions at√s=7 TeV”, JHEP 12 (2012) 035, doi:10.1007/JHEP12(2012)035, arXiv:1209.4533.
[3] CMS Collaboration, “Absolute Calibration of the Luminosity Measurement at CMS: Winter 2012 Update”, CMS Physics Analysis Summary CMS-PAS-SMP-12-008, 2012. [4] ATLAS Collaboration, “Study of jets produced in association with a W boson in pp
collisions at√s=7 TeV with the ATLAS detector”, Phys. Rev. D 85 (2012) 092002, doi:10.1103/PhysRevD.85.092002, arXiv:1201.1276.
[5] CMS Collaboration, “Jet production rates in association with W and Z bosons in pp collisions at√s=7 TeV”, JHEP 01 (2012) 010, doi:10.1007/JHEP01(2012)010, arXiv:1110.3226.
[6] D0 Collaboration, “Measurements of inclusive W+jets production rates as a function of jet transverse momentum in pp collisions at√s=1.96 TeV”, Phys. Lett. B 705 (2011) 200, doi:10.1016/j.physletb.2011.10.011, arXiv:1106.1457.
[7] D0 Collaboration, “Studies of W boson plus jets production in pp collisions at√
s =1.96 TeV”, Phys. Rev. D 88 (2013) 092001, doi:10.1103/PhysRevD.88.092001, arXiv:1302.6508.
[8] CDF Collaboration, “Measurement of the cross section for W-boson production in association with jets in pp collisions at√s=1.96 TeV”, Phys. Rev. D 77 (2008) 011108, doi:10.1103/PhysRevD.77.011108, arXiv:0711.4044.
[9] ATLAS Collaboration, “Measurements of the W production cross sections in association with jets with the ATLAS detector”, (2014). arXiv:1409.8639.
[10] A. Hocker and V. Kartvelishvili, “SVD approach to data unfolding”, Nucl. Instrum. Meth. A 372 (1996) 469, doi:10.1016/0168-9002(95)01478-0,
18 References
[11] J. Alwall et al., “MadGraph 5: going beyond”, JHEP 06 (2011) 128, doi:10.1007/JHEP06(2011)128, arXiv:1106.0522.
[12] T. Sjostrand, S. Mrenna, and P. Skands, “PYTHIA 6.4 physics and manual”, JHEP 05 (2006) 026, doi:10.1088/1126-6708/2006/05/026, arXiv:hep-ph/0603175. [13] T. Gleisberg and S. H ¨oche, “Comix, a new matrix element generator”, JHEP 12 (2008)
039, doi:10.1088/1126-6708/2008/12/039, arXiv:0808.3674.
[14] S. Schumann and F. Krauss, “A parton shower algorithm based on Catani-Seymour dipole factorisation”, JHEP 03 (2008) 038, doi:10.1088/1126-6708/2008/03/038, arXiv:0709.1027.
[15] T. Gleisberg et al., “Event generation with SHERPA 1.1”, JHEP 02 (2009) 007, doi:10.1088/1126-6708/2009/02/007, arXiv:0811.4622.
[16] S. H ¨oche, F. Krauss, S. Schumann, and F. Siegert, “QCD matrix elements and truncated showers”, JHEP 05 (2009) 053, doi:10.1088/1126-6708/2009/05/053,
arXiv:0903.1219.
[17] C. F. Berger et al., “Next-to-leading order QCD predictions for W+3-Jet distributions at hadron colliders”, Phys. Rev. D 80 (2009) 074036,
doi:10.1103/PhysRevD.80.074036, arXiv:0907.1984.
[18] C. F. Berger et al., “Precise Predictions for W+ 4-Jet Production at the Large Hadron Collider”, Phys. Rev. Lett. 106 (2011) 092001,
doi:10.1103/PhysRevLett.106.092001, arXiv:1009.2338.
[19] Z. Bern et al., “Ntuples for NLO events at hadron colliders”, Comput. Phys. Commun. 185 (2014) 1443, doi:10.1016/j.cpc.2014.01.011, arXiv:1310.7439.
[20] CMS Collaboration, “The CMS experiment at the CERN LHC”, JINST 3 (2008) S08004, doi:10.1088/1748-0221/3/08/S08004.
[21] CMS Collaboration, “Energy calibration and resolution of the CMS electromagnetic calorimeter in pp collisions at√s = 7 TeV”, JINST 8 (2013) P09009,
doi:10.1088/1748-0221/8/09/P09009, arXiv:1306.2016.
[22] GEANT4 Collaboration, “GEANT4—a simulation toolkit”, Nucl. Instrum. Meth. A 506 (2003) 250, doi:10.1016/S0168-9002(03)01368-8.
[23] CMS Collaboration, “Charged particle multiplicities in pp interactions at√s=0.9, 2.36, and 7 TeV”, JHEP 01 (2010) 079, doi:10.1007/JHEP01(2011)079,
arXiv:1011.5531.
[24] P. Nason, “A new method for combining NLO QCD with shower Monte Carlo algorithms”, JHEP 11 (2004) 040, doi:10.1088/1126-6708/2004/11/040, arXiv:hep-ph/0409146.
[25] S. Frixione, P. Nason, and C. Oleari, “Matching NLO QCD computations with parton shower simulations: the POWHEG method”, JHEP 11 (2007) 070,
doi:10.1088/1126-6708/2007/11/070, arXiv:0709.2092.
[26] S. Alioli, P. Nason, C. Oleari, and E. Re, “A general framework for implementing NLO calculations in shower Monte Carlo programs: the POWHEG BOX”, JHEP 06 (2010) 043, doi:10.1007/JHEP06(2010)043, arXiv:1002.2581.
[27] S. Alioli, P. Nason, C. Oleari, and E. Re, “NLO single-top production matched with shower in POWHEG: s- and t-channel contributions”, JHEP 09 (2009) 111,
doi:10.1088/1126-6708/2009/09/111, arXiv:0907.4076.
[28] J. Pumplin et al., “New generation of parton distributions with uncertainties from global QCD analysis”, JHEP 07 (2002) 012, doi:10.1088/1126-6708/2002/07/012, arXiv:hep-ph/0201195.
[29] K. Melnikov and F. Petriello, “Electroweak gauge boson production at hadron colliders through O(α2
S)”, Phys. Rev. D 74 (2006) 114017, doi:10.1103/PhysRevD.74.114017,
arXiv:hep-ph/0609070.
[30] J. Campbell, R. K. Ellis, and F. Tramontano, “Single top-quark production and decay at next-to-leading order”, Phys. Rev. D 70 (2004) 094012,
doi:10.1103/PhysRevD.70.094012, arXiv:hep-ph/0408158.
[31] J. Campbell and F. Tramontano, “Next-to-leading order corrections to Wt production and decay”, Nucl. Phys. B 726 (2005) 109, doi:10.1016/j.nuclphysb.2005.08.015, arXiv:hep-ph/0506289.
[32] J. M. Campbell, R. Frederix, F. Maltoni, and F. Tramontano, “Next-to-Leading-Order Predictions for t-Channel Single-Top Production at Hadron Colliders”, Phys. Rev. Lett.
102(2009) 182003, doi:10.1103/PhysRevLett.102.182003, arXiv:0903.0005. [33] J. M. Campbell, R. K. Ellis, and C. Williams, “Vector boson pair production at the LHC”,
JHEP 07 (2011) 018, doi:10.1007/JHEP07(2011)018, arXiv:1105.0020.
[34] M. Czakon, P. Fiedler, and A. Mitov, “The total top quark pair production cross-section at hadron colliders through O(α4S)”, Phys. Rev. Lett. 110 (2013) 252004,
doi:10.1103/PhysRevLett.110.252004, arXiv:1303.6254.
[35] CMS Collaboration, “Performance of CMS muon reconstruction in pp collision events at√ s =7 TeV”, JINST 7 (2012) P10002, doi:10.1088/1748-0221/7/10/P10002, arXiv:1206.4071.
[36] CMS Collaboration, “Particle–Flow Event Reconstruction in CMS and Performance for Jets, Taus, and EmissT ”, CMS Physics Analysis Summary CMS-PAS-PFT-09-001, 2009. [37] CMS Collaboration, “Commissioning of the Particle-flow Event Reconstruction with the
first LHC collisions recorded in the CMS detector”, CMS Physics Analysis Summary CMS-PAS-PFT-10-001, 2010.
[38] M. Cacciari, G. P. Salam, and G. Soyez, “The anti-ktjet clustering algorithm”, JHEP 04
(2008) 063, doi:10.1088/1126-6708/2008/04/063, arXiv:0802.1189. [39] M. Cacciari, G. P. Salam, and G. Soyez, “FastJet user manual”, Eur. Phys. J. C 72 (2012)
1896, doi:10.1140/epjc/s10052-012-1896-2, arXiv:1111.6097.
[40] CMS Collaboration, “Determination of jet energy calibration and transverse momentum resolution in CMS”, JINST 6 (2011) 11002, doi:10.1088/1748-0221/6/11/P11002, arXiv:1107.4277.
[41] CMS Collaboration, “Measurement of the inclusive W and Z production cross sections in pp collisions at√s =7 TeV with the CMS experiment”, JHEP 10 (2011) 132,
20 References
[42] CMS Collaboration, “Identification of b-quark jets with the CMS experiment”, JINST 8 (2013) 04013, doi:10.1088/1748-0221/8/04/P04013, arXiv:1211.4462. [43] T. Adye, “Unfolding algorithms and tests using RooUnfold”, (2011).
arXiv:1105.1160.
[44] CMS Collaboration, “Measurement of the inelastic proton-proton cross section at√ s =7 TeV”, Phys. Lett. B 722 (2013) 5, doi:10.1016/j.physletb.2013.03.024, arXiv:1210.6718.
[45] H.-L. Lai et al., “New parton distributions for collider physics”, Phys. Rev. D 82 (2010) 074024, doi:10.1103/PhysRevD.82.074024, arXiv:1007.2241.
[46] J. Gao et al., “CT10 next-to-next-to-leading order global analysis of QCD”, Phys. Rev. D
89(2014) 033009, doi:10.1103/PhysRevD.89.033009, arXiv:1302.6246. [47] J. Alwall et al., “Comparative study of various algorithms for the merging of parton
showers and matrix elements in hadronic collisions”, Eur. Phys. J. C 53 (2008) 473, doi:10.1140/epjc/s10052-007-0490-5, arXiv:0706.2569.
[48] A. Buckley et al., “Rivet user manual”, Comput. Phys. Commun. 184 (2013) 2803, doi:10.1016/j.cpc.2013.05.021, arXiv:1003.0694.
[49] Z. Bern et al., “Four-Jet Production at the Large Hadron Collider at Next-to-Leading Order in QCD”, Phys. Rev. Lett. 109 (2012) 042001,
doi:10.1103/PhysRevLett.109.042001, arXiv:1112.3940.
[50] A. D. Martin, W. J. Stirling, R. S. Thorne, and G. Watt, “Parton distributions for the LHC”, Eur. Phys. J. C 63 (2009) 189, doi:10.1140/epjc/s10052-009-1072-5,
arXiv:0901.0002.
[51] R. D. Ball et al., “A first unbiased global NLO determination of parton distributions and their uncertainties”, Nucl. Phys. B 838 (2010) 136,
doi:10.1016/j.nuclphysb.2010.05.008, arXiv:1002.4407. [52] S. Alekhin et al., “The PDF4LHC Working Group Interim Report”, (2011).
arXiv:1101.0536.
[53] M. Botje et al., “The PDF4LHC Working Group Interim Recommendations”, (2011). arXiv:1101.0538.
[54] D. Maˆıtre and S. Sapeta, “Simulated NNLO for high-pTobservables in vector boson + jets
production at the LHC”, Eur. Phys. J. C 73 (2013) 2663,
A
The CMS Collaboration
Yerevan Physics Institute, Yerevan, Armenia
V. Khachatryan, A.M. Sirunyan, A. Tumasyan
Institut f ¨ur Hochenergiephysik der OeAW, Wien, Austria
W. Adam, T. Bergauer, M. Dragicevic, J. Er ¨o, C. Fabjan1, M. Friedl, R. Fr ¨uhwirth1, V.M. Ghete, C. Hartl, N. H ¨ormann, J. Hrubec, M. Jeitler1, W. Kiesenhofer, V. Kn ¨unz, M. Krammer1, I. Kr¨atschmer, D. Liko, I. Mikulec, D. Rabady2, B. Rahbaran, H. Rohringer, R. Sch ¨ofbeck,
J. Strauss, A. Taurok, W. Treberer-Treberspurg, W. Waltenberger, C.-E. Wulz1
National Centre for Particle and High Energy Physics, Minsk, Belarus
V. Mossolov, N. Shumeiko, J. Suarez Gonzalez
Universiteit Antwerpen, Antwerpen, Belgium
S. Alderweireldt, M. Bansal, S. Bansal, T. Cornelis, E.A. De Wolf, X. Janssen, A. Knutsson, S. Luyckx, S. Ochesanu, B. Roland, R. Rougny, M. Van De Klundert, H. Van Haevermaet, P. Van Mechelen, N. Van Remortel, A. Van Spilbeeck
Vrije Universiteit Brussel, Brussel, Belgium
F. Blekman, S. Blyweert, J. D’Hondt, N. Daci, N. Heracleous, A. Kalogeropoulos, J. Keaveney, T.J. Kim, S. Lowette, M. Maes, A. Olbrechts, Q. Python, D. Strom, S. Tavernier, W. Van Doninck, P. Van Mulders, G.P. Van Onsem, I. Villella
Universit´e Libre de Bruxelles, Bruxelles, Belgium
C. Caillol, B. Clerbaux, G. De Lentdecker, D. Dobur, L. Favart, A.P.R. Gay, A. Grebenyuk, A. L´eonard, A. Mohammadi, L. Perni`e2, T. Reis, T. Seva, L. Thomas, C. Vander Velde, P. Vanlaer, J. Wang
Ghent University, Ghent, Belgium
V. Adler, K. Beernaert, L. Benucci, A. Cimmino, S. Costantini, S. Crucy, S. Dildick, A. Fagot, G. Garcia, B. Klein, J. Mccartin, A.A. Ocampo Rios, D. Ryckbosch, S. Salva Diblen, M. Sigamani, N. Strobbe, F. Thyssen, M. Tytgat, E. Yazgan, N. Zaganidis
Universit´e Catholique de Louvain, Louvain-la-Neuve, Belgium
S. Basegmez, C. Beluffi3, G. Bruno, R. Castello, A. Caudron, L. Ceard, G.G. Da Silveira, C. Delaere, T. du Pree, D. Favart, L. Forthomme, A. Giammanco4, J. Hollar, P. Jez, M. Komm, V. Lemaitre, J. Liao, C. Nuttens, D. Pagano, L. Perrini, A. Pin, K. Piotrzkowski, A. Popov5, L. Quertenmont, M. Selvaggi, M. Vidal Marono, J.M. Vizan Garcia
Universit´e de Mons, Mons, Belgium
N. Beliy, T. Caebergs, E. Daubie, G.H. Hammad
Centro Brasileiro de Pesquisas Fisicas, Rio de Janeiro, Brazil
W.L. Ald´a J ´unior, G.A. Alves, M. Correa Martins Junior, T. Dos Reis Martins, M.E. Pol
Universidade do Estado do Rio de Janeiro, Rio de Janeiro, Brazil
W. Carvalho, J. Chinellato6, A. Cust ´odio, E.M. Da Costa, D. De Jesus Damiao, C. De Oliveira
Martins, S. Fonseca De Souza, H. Malbouisson, M. Malek, D. Matos Figueiredo, L. Mundim, H. Nogima, W.L. Prado Da Silva, J. Santaolalla, A. Santoro, A. Sznajder, E.J. Tonelli Manganote6, A. Vilela Pereira
Universidade Estadual Paulistaa, Universidade Federal do ABCb, S˜ao Paulo, Brazil
C.A. Bernardesb, F.A. Diasa,7, T.R. Fernandez Perez Tomeia, E.M. Gregoresb, P.G. Mercadanteb, S.F. Novaesa, Sandra S. Padulaa