www.hydrol-earth-syst-sci.net/14/1919/2010/ doi:10.5194/hess-14-1919-2010
© Author(s) 2010. CC Attribution 3.0 License.
Earth System
Sciences
Space-time variability of hydrological drought and wetness in Iran
using NCEP/NCAR and GPCC datasets
T. Raziei1, I. Bordi2, L. S. Pereira3, and A. Sutera2
1Soil Conservation and Watershed Management Research Institute (SCWMRI), Iran 2Department of Physics, Sapienza University of Rome, Italy
3CEER – Biosystems Engineering, Institute of Agronomy, Technical University of Lisbon, Portugal
Received: 6 February 2010 – Published in Hydrol. Earth Syst. Sci. Discuss.: 31 May 2010 Revised: 22 September 2010 – Accepted: 1 October 2010 – Published: 12 October 2010
Abstract. Space-time variability of hydrological drought and wetness over Iran is investigated using the National Centers for Environmental Prediction/National Center for Atmospheric Research (NCEP/NCAR) reanalysis and the Global Precipitation Climatology Centre (GPCC) dataset for the common period 1948–2007. The aim is to comple-ment previous studies on the detection of long-term trends in drought/wetness time series and on the applicability of reanalysis data for drought monitoring in Iran. Climate conditions of the area are assessed through the Standard-ized Precipitation Index (SPI) on 24-month time scale, while Principal Component Analysis (PCA) and Varimax rotation are used for investigating drought/wetness variability, and drought regionalization, respectively. Singular Spectrum Analysis (SSA) is applied to the time series of interest to extract the leading nonlinear components and compare them with linear fittings.
Differences in drought and wetness area coverage result-ing from the two datasets are discussed also in relation to the change occurred in recent years. NCEP/NCAR and GPCC are in good agreement in identifying four sub-regions as prin-cipal spatial modes of drought variability. However, the cli-mate variability in each area is not univocally represented by the two datasets: a good agreement is found for south-eastern and north-western regions, while noticeable discrep-ancies occur for central and Caspian sea regions. A com-parison with NCEP Reanalysis II for the period 1979–2007, seems to exclude that the discrepancies are merely due to the introduction of satellite data into the reanalysis assimilation scheme.
Correspondence to: I. Bordi
1 Introduction
Drought, a natural and recurring feature of climate, can be considered as one of the most damaging and costly natural hazard due to its negative impacts on society, economy and environment (Yevjevich et al., 1978; Pereira et al., 2009 and references therein). Still nowadays reducing the impacts of this natural phenomenon remains a challenge. This is be-cause usually drought is primarily addressed through a crisis management approach when a disaster occurs, rather than stressing preparedness and risk management (Wilhite et al., 2000). Thus, in recent years, both the experiences and the improved knowledge on drought phenomenon are encourag-ing the latter approach for developencourag-ing drought plans.
As described by Hayes et al. (2004), the risk-based ap-proach requires the assessment of drought risk and risk man-agement. In assessing drought risk, which can be represented as the product of the hazard and vulnerability of a region (Knutson et al., 1998; Wilhite, 2000), the first step is drought monitoring and the understanding of the spatial extent and temporal variability of drought events, also in relation to a changing climate. However, these kinds of analyses may be easy or difficult tasks depending on the length and availabil-ity of reliable climatological data. It is highly desirable, in fact, to have at hand a dataset that: (i) is easy to access, (ii) uniformly covers the area of interest, (iii) has a time-duration sufficiently long to be trustworthy in a statistical sense and (iv) is suitable for capturing both dry and wet events (Rossi, 2003; Bordi et al., 2006). Most of the available datasets ful-fil one or more of these requirements, but usually not all of them.
For this reason, always more frequently, reanalysis data are used for drought studies, especially the National Centers
for Environmental Prediction/National Center for Atmo-spheric Research (NCEP/NCAR) product that is continu-ally updated from 1948 (Kalnay et al., 1996). Though the NCEP/NCAR dataset meets the above fundamental require-ments for an analysis of drought at large-scale, a compari-son with observations is recommended to check reliability. Motivations are basically three. First of all, precipitation, which is the basic variable for drought assessment, is not a primary variable of the reanalysis product (i.e., precipitation observations are not assimilated into the reanalysis model), but it is given by short-range model forecasts. Secondly, al-though the NCEP/NCAR reanalysis system remained essen-tially unchanged during the more than 60 years processed (apart minor corrections provided after some errors’ detec-tion), there were two major changes in the observing system. One took place during 1948–1957, when the upper-air net-work was established, and the other in 1979 when the global operational use of satellite soundings was introduced (Kistler et al., 2001). Thirdly, the NCEP/NCAR reanalysis provides data with a coarse resolution (for example, precipitation is given on a regular grid of about 2 degrees in latitude and lon-gitude), which is a suitable resolution for large-scale studies but it might be unable to represent synoptic features that are of some interest for regional studies.
In performing a comparison with the observations, there are two alternatives: gridded data based on observations and in situ measurements of the variable of interest (for example, rain-gauge data for precipitation). The Global Precipitation Climatology Centre (GPCC) has produced and released sev-eral products, among them the Full Data Reanalysis Product Version 4 consisting of global land surface monthly precip-itation at different spatial resolutions. The analysis is based on all stations, near real-time and non real-time, and covers the period 1901–2007 (Schneider et al., 2008). These data satisfy the criteria described above and, therefore, may be used to assess dry/wet periods over the globe for approxi-mately the last hundred years.
Based on these grounds, recently, Raziei et al. (2010) pro-vided an application of NCEP/NCAR, GPCC and observa-tion data for drought analysis in Iran. In that study, the common period 1951–2005 was considered and the space-time variability of hydrological drought across the country was investigated through the Standardized Precipitation In-dex (SPI) computed on 12-month time scale. The main find-ing was that the three datasets were in good agreement in identifying four sub-regions of climate variability. However, the time behaviour of drought within each region was not uni-vocally represented by the three datasets. In particular, it was found a good agreement between GPCC and observations, while several discrepancies were noted with NCEP/NCAR data, especially in central Iran for periods before the mid sev-enties. Thus, GPCC dataset appeared to be a useful tool to complement the information provided by rain-gauge obser-vations.
Furthermore, Bordi et al. (2009) provided an updated (1948–2009) analysis of drought variability at large-scale (European sector) using NCEP/NCAR precipitation data as input for the computation of the SPI on 24-month time scale. The authors analysed the linear and nonlinear trends in drought and wetness, highlighting a change in the tendency of the SPI series in recent years.
Motivated by these recent studies, which demonstrated the need of further investigations, an application of NCEP/NCAR and GPCC data for monitoring hydrological drought and wetness in Iran is here proposed. The aim is to complement the analyses carried out in the two previous studies by Bordi et al. (2009) and Raziei et al. (2010) in order to provide a comprehensive and updated analysis for Iran. In particular, in the present paper we investigate if a recent change in long-term trends characterizes drought and wetness time series in Iran similar to that found for the Eu-ropean sector. Moreover, given the results provided by Ra-ziei et al. (2010), suggesting that GPCC dataset can be used as representative of rain-gauge observations, the reliability of NCEP/NCAR reanalysis for drought analysis is checked against GPCC gridded data. This is an important task be-cause the lack of updated and reliable meteorological data is still the major limitation in establishing a drought monitoring system in many countries like Iran. On the one hand, in Iran the organizations responsible for collecting meteorological data delay 3 to 5 years in publishing the updated data, and many station’s records have substantial gaps leading to low quality and in-homogeneity problems. Also, the shortness of climatological records represents a limitation (time series from 1951 up to present are very limited and sparsely dis-tributed across the country). On the other hand, the frequent dry periods and the increasing water demands for an ever-growing population, as well as for industry and economic de-velopment, including irrigation, aggravate water scarcity and make difficult a rationale water management (Raziei et al., 2009). Thus, it is highly desirable to have an updated and re-liable dataset for Iran, and NCEP/NCAR product might rep-resent a useful tool for drought monitoring purposes.
In the present paper, the analysis is focused on hydrologi-cal drought and wetness variability during the period 1948– 2007. As in previous reference studies, the SPI is computed for drought characterization and the 24-month time scale is considered for analyzing its hydrological aspects. The in-dex, widely used in drought monitoring centres and in several drought studies (see for example Bordi et al., 2001; Lloyd-Hughes and Saunders, 2002; Tsakiris and Vangelis, 2004; Bordi and Sutera, 2004; Vicente-Serrano, 2006), is based only on precipitation. It is a useful tool for capturing the climate variability associated with water shortage or surplus in different areas, and has several advantages (Keyantash and Dracup, 2002). Former applications of the SPI for assessing drought variability in western Iran proved to be appropriate (Raziei et al., 2009). In analyzing the spatial and temporal variability of drought across Iran, the Principal Component
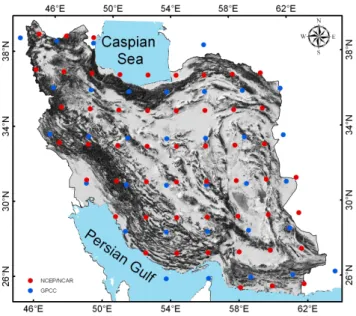
Fig. 1. Map of Iran with orograghy. Red bullets are NCEP/NCAR
grid points and blue bullets GPCC grid points.
Analysis (PCA) and Varimax rotation are applied to the SPI field. Furthermore, the Singular Spectrum Analysis (SSA) of the time series of interest (that is, the area coverage of dry/wet events, and the first principal component score of the SPI field) is used to extract the leading nonlinear compo-nents.
2 Data and methods 2.1 Data
Data used for the study are monthly precipitation of NCEP/NCAR reanalysis and GPCC Full Data Product Ver-sion 4 for the common period 1948–2007. Only grid points representative of Iran have been considered for the analysis (Fig. 1).
NCEP/NCAR monthly precipitation rates are available from 1948 to present on a regular grid of about 1.9◦×1.9◦ in longitude and latitude. Such precipitation data have been derived from the primary meteorological fields of the NCEP medium range forecasting spectral model with 28 “sigma” vertical levels and a triangular truncation of 62 waves, equiv-alent to about 210-km horizontal resolution. The model is based on the assimilation of a set of observations, such as land surface, ship, rawinsonde, aircraft and satellite data (Kalnay et al., 1996). These data were quality controlled and assimilated with a data assimilation system kept unchanged over the reanalysis period. Though precipitation is not di-rectly assimilated, but derived completely from the model 6-h forecast, its midlatitude large-scale features have been compared favourably with observations and several
clima-tologies (Janowiak et al., 1998; Trenberth and Guillemot, 1998).
The GPCC Full Data Product Version 4, updated in September 2008, is a gauge-based gridded monthly precip-itation dataset for the global land surface, available in spa-tial resolutions of 0.5◦×0.5◦, 1.0◦×1.0◦and 2.5◦×2.5◦ ge-ographical longitude by latitude. The dataset covers the pe-riod from 1901 to 2007 and is based on both non real-time and real-time stations (Schneider et al., 2008). Several qual-ity controls have been applied before gridding (Beck et al., 2005). In the present study, the 2.5◦longitude-latitude reso-lution has been considered.
Moreover, monthly precipitation rates from the National Centers for Environmental Prediction/Department of Energy Atmospheric Model Intercomparison Project II (NCEP/DOE AMIP II) reanalysis (hereafter NCEP Reanalysis II) have been considered for additional investigations. NCEP Reanal-ysis II (Kanamitsu et al., 2002) was developed to improve NCEP/NCAR reanalysis by fixing the errors and updating the parameterizations of the physical processes. It is avail-able from January 1979 to December 2009 and has the same spatial resolution of NCEP/NCAR reanalysis making com-parison easy.
2.1.1 Methods
In order to assess hydrological drought/wetness conditions over Iran, the SPI on 24-month time scale has been computed for NCEP/NCAR and GPCC datasets for the common period 1948–2007. The SPI, first introduced by McKee et al. (1993), is based on the precipitation field alone and its computa-tion for any locacomputa-tion is based on the long-term precipitacomputa-tion record accumulated over the selected time scale. The long-term record is fitted to a probability distribution, usually a Gamma distribution, which is then transformed through an equal-probability transformation into a normal distribution. The index is a useful tool for monitoring the different kinds of drought and comparing climate conditions of areas gov-erned by different hydrological regimes. Also, the SPI, due to its standardization, allows monitoring wet events as well.
The 24-month time scale has been selected because it ap-pears suitable for analysing the low-frequency variability of drought and wetness due to the smoothed time behaviour of the SPI at such long time scale. Moreover, it is the same time scale used in Bordi et al. (2009) making easy the comparison with the results obtained for the large-scale at Europe. Just to complement the analyses on drought regionalization, shorter time scales have been also considered, 3 and 6-months, usu-ally adopted for monitoring meteorological and agricultural droughts.
To capture the patterns of drought/wetness co-variability at different grid points, the PCA (Rencher, 1998) has been applied to the SPI time series of NCEP/NCAR and GPCC. The method consists in computing the covariance matrix of the SPI data with the corresponding eigenvalues and
eigenvectors. The projection of the SPI fields onto the or-thonormal eigenfunctions provides the principal component (PC) score time series. We recall that the spatial patterns (eigenvectors), properly normalized (divided by their Eu-clidean norm and multiplied by the square root of the corre-sponding eigenvalues), are called “loadings”; they represent the correlation between the original data (in our case, the SPI time series at single grid points) and the corresponding prin-cipal component time series.
Localized spatial patterns of variability have been iden-tified applying the Varimax rotation to the loadings. This method allows finding areas within the region that have rather independent climate variability, i.e. the rotated PC scores are temporally orthogonal (Rencher, 1998). Follow-ing the rule by North et al. (1982), the samplFollow-ing errors of the eigenvalues associated with principal components have been estimated and the number of loadings to retain for rotation has been established.
Finally, following Bordi et al. (2009), both the linear trends and the leading nonlinear components in the time se-ries of interest (i.e., the area extent of drought and wetness, and the principal component time series of SPI) have been considered. The long-term linear trend has been computed by applying the least-squared method to fit a linear model to the time series, while the leading nonlinear components have been extracted using the Singular Spectral Analysis (SSA). SSA, is a nonparametric spectral estimation method based on embedding a time series X(t): t =1, N in a vector space of dimension M. It consists in diagonalizing the M ×M lag-covariance matrix CXof X(t) to obtain spectral information
on the time series (Vautard and Ghil, 1989; Fraedrich, 1986). The M eigenvectors Ek of the lag-covariance CXare called
temporal empirical orthogonal functions (EOFs), while pro-jections of the time series onto each eigenvector yield the corresponding temporal principal component (PCs), Ak. The
entire time series or part of it that corresponds to a trend, os-cillatory mode or noise can be reconstructed by using linear combinations of PCs and EOFs, as:
Rk(t ) = 1 Mt X k∈K Ut X j =Lt Ak(t − j +1) Ek(j ), (1)
where K is the set of EOFs on which the reconstruction is based, and the values of the normalization factor Mt, as well
as of the lower and upper bound of summation Lt and Ut,
differ between the central part of the time series and its end points (Ghil et al., 2002). In the present study, we have re-constructed the signals of interest by considering only the first component. A window length of M =70 months (i.e., about 1/10th of the time series) has been considered because it provides statistically meaningful estimates of the largest re-solvable fluctuation period. Note that the conventional PCA or EOF analysis is a special case with M = 1.
1950 1960 1970 1980 1990 2000 0 10 20 30 40 50 60 70 80 90 100 time (year) Ad (%) NCEP/NCAR (a) (b) c) d) 1950 1960 1970 1980 1990 2000 0 10 20 30 40 50 60 70 80 90 100 time (year) Aw (%) NCEP/NCAR 1950 1960 1970 1980 1990 2000 0 10 20 30 40 50 60 70 80 90 100 time (year) Ad (%) GPCC 1950 1960 1970 1980 1990 2000 0 10 20 30 40 50 60 70 80 90 100 time (year) Aw (%) GPCC
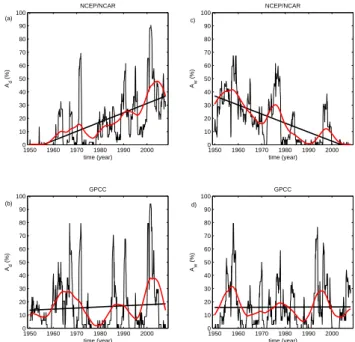
Fig. 2. Time behaviour of Ad and Aw from December 1949 to
December 2007 for the SPI on 24-month time scale computed using NCEP/NCAR and GPCC data: a)–b) dryness, and c)–d) wetness. Straight black lines denote the fitting linear trends, while red lines are the reconstructions of Adand Aw using only the leading SSA
principal component. Units are %.
3 Results
3.1 Spatial extent and trend of hydrological drought and wetness
The spatial extent of hydrological drought and wetness across Iran has been estimated by computing the percentage of grid points that are in dry and wet conditions, say Adand Aw, for each month of the time record. According to the
SPI classification (see Table 1 in Bordi and Sutera, 2004), let us consider drought occurrence identified by SPI < −1 and wet events occurrence by SPI >1. Figure. 2a, b and c, d show Ad and Aw, respectively, as a function of time for the
two datasets. Black straight lines are the fitting linear trends, while red curves denote reconstructions of Adand Awusing
only the leading SSA principal component. The correlation coefficients between the time series of Adand Awfor the two
datasets are shown in Table 1, as well as the R2statistics of the linear and nonlinear fittings.
For the spatial extent of drought, Ad, it seems that there is
a satisfactory agreement between NCEP/NCAR and GPCC (correlation coefficient 0.66). The NCEP/NCAR dataset shows an increasing area interested by drought events, while in the last six years or so there is a decrease. This latter fea-ture, which is common to the two datasets, is in agreement with the recent investigations on long-term trends in drought signals when an update is taken into account (Bordi et al.,
Table 1. Correlation coefficients between Ad(Aw)for the two datasets NCEP/NCAR and GPCC (first two columns), and R2of the linear
and nonlinear fittings of Adand Aw(last three columns).
Time series Correlation coefficient Time series R2of linear fit (%) R2of nonlinear fit (%)
AdNCEP and AdGPCC 0.66 AdNCEP 36.77 50.55 AdGPCC 0.46 31.13 AwNCEP and AwGPCC 0.44 AwNCEP 43.16 67.14 AwGPCC 0.01 33.03
Table 2. Correlation coefficient between PC-1 of SPI for the two datasets NCEP/NCAR and GPCC (first two columns), and R2of the linear and nonlinear fittings of PC-1 (last three columns).
Time series Correlation coefficient Time series R2of linear fit (%) R2of nonlinear fit (%) PC-1 NCEP and PC-1 GPCC 0.47 PC-1 NCEP 53.68 71.35
PC-1 GPCC 0.07 40.30
2009). However, the linear trend unveiled in NCEP/NCAR data does not characterize Ad time series computed using
GPCC. This is mainly due to the differences occurring in the time section 1960–1975 that affect the slope of the linear fit-ting, i.e. a greater percentage of area interested by drought is captured by GPCC with respect to NCEP/NCAR, even if dif-ferences are noticeable also in the last two decades. In both cases, the nonlinear fittings of Adseem to better represent the
time evolution of the areas extent by capturing the long-term fluctuations (see the R2statistics in Table 1).
For what concerns Aw, major discrepancies are found
between NCEP/NCAR and GPCC (correlation coefficient 0.44). The NCEP/NCAR shows a general decrease of the area covered by wet events as shown by the linear fitting in Fig. 2c. On the contrary, a weak linear trend, not statistically significant, characterizes GPCC dataset. In this case, it seems that the discrepancies occurring during the period 1990–2000 mostly affect the long-term trend, i.e. a greater percentage of area covered by wet events is captured by GPCC with respect to NCEP/NCAR. It is worth to notice the hint of an increas-ing Awduring the last six years of the time record in GPCC,
as found by Bordi et al. (2009) for the European area. Such a change is not well captured by NCEP/NCAR that in the latest years reveals near normal conditions. Even for Awthe
non-linear reconstructions using the first SSA principal compo-nent appear to be more appropriate with respect to the linear fittings in describing the long-term variability (see Table 1). 3.2 Space-time variability of hydrological drought and
wetness
Previous analysis has been complemented by the PCA of the SPI field for the two datasets to obtain the leading spa-tial pattern (loadings) and the associated temporal behaviour
(PC scores) of drought/wetness across Iran. In finding more localized spatial patterns of variability the Varimax rotation to the loadings has been applied. Based on the scree plot and the North’s rule of thumb (North et al., 1982), for each dataset the first four loadings for Varimax rotation have been selected.
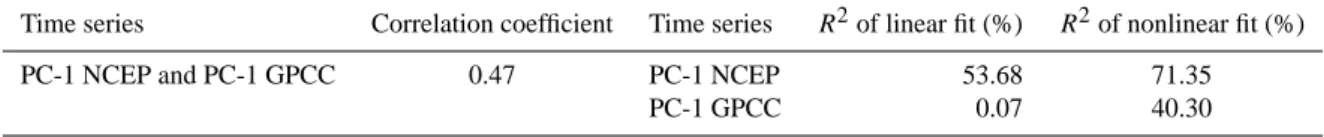
3.2.1 Principal component analysis of the SPI field In Fig. 3a, b the first spatial patterns (Loading 1) for each dataset are shown. The percentage of variance explained by the first loading is 47.0% and 45.3% for NCEP/NCAR and GPCC, respectively. A cursory look of the figure sug-gests that there is a satisfactory agreement between the two datasets: high positive loading values characterize most of the area considered, in particular central-southern Iran. This means that SPI series have almost everywhere high posi-tive correlations with the corresponding PC-1 scores time se-ries, which are shown in Fig. 4. The figure suggests that, while PC-1 from NCEP is characterized by a long-term lin-ear trend that explains about 54% of the variance of the sig-nal, that from GPCC does not (see Table 2). Moreover, it seems that this difference is mainly due, as referred before for the area extent, to the discrepancies occurring roughly during the decades 1960–1975 and 1990–2000. Such dif-ferences affect substantially both the linear fittings and the nonlinear behaviours extracted by SSA. To be pointed out is the hint of a change occurred after the year 2000 towards PC-1 values close to −PC-1 (NCEP) or +PC-1 (GPCC), which suggests a tendency towards near normal conditions in recent years as discussed by Bordi et al. (2009). However, the overall agree-ment between the two PC time series is low as represented by the correlation coefficient of 0.47 (Table 2).
Table 3. Percentages of the explained variances of un-rotated and Varimax rotated PCs of SPI on 24-month time scale for NCEP/NCAR and
GPCC.
NCEP/NCAR GPCC
PC Un-Rotated (%) Varimax Rotated (%) Un-Rotated (%) Varimax Rotated (%)
PC-1 47.0 31.5 45.3 29.2
PC-2 18.8 25.8 12.7 22.9
PC-3 8.8 16.3 8.5 11.2
PC-4 7.3 8.4 6.7 9.9
Total 81.9 81.9 73.2 73.2
Table 4. Correlation coefficients between RPCs associated with the
same sub-regions for NCEP/NCAR and GPCC datasets. RPCs Correlation coefficient RPC1 NCEP – RPC2 GPCC −0.02 RPC2 NCEP – RPC1 GPCC 0.72 RPC3 NCEP – RPC3 GPCC 0.60 RPC4 NCEP – RPC4 GPCC 0.08
Thus, results so far obtained suggest that while the two datasets agree in identifying the same leading spatial mode of drought variability, they differ in the associated time be-haviours of SPI series.
3.2.2 Drought regionalization
In evaluating the effect of these discrepancies on drought regionalization, the Varimax rotation to the first four load-ings has been applied and the associated rotated PC scores time series (RPC) for the two datasets have been computed. Results for rotated loadings (R-Loadings) are illustrated in Fig. 5, while those for RPCs in Fig. 6. The percentages of the total variance explained by the un-rotated and rotated load-ings are listed in Table 3.
Figure 5a–d refers to the spatial patterns obtained for NCEP/NCAR dataset. The first R-Loading has high pos-itive values on grid points located in central-western area, while R-Loading 2 is characterized by high positive values in south-eastern Iran. R-Loading 3 shows positive values greater than 0.6 in north-western Iran, and R-Loading 4 iden-tifies an area in the north of the country, close to the Caspian sea, as a distinctive sub-region with positive values. As shown in Fig. 5e–h, GPCC dataset identifies similar spatial patterns of variability. Results for the two different sources of data are therefore coherent. Note that, in both cases, the fourth rotated loading explains a small percentage of the to-tal variance (about 8–9%), suggesting that we must be cau-tious in considering that as a sub-region of drought variabil-ity. Thus, the robustness of the northern sub-region should be
Fig. 3. Principal component analysis of the SPI field. First loading,
i.e. the first spatial pattern properly normalized that represents the correlations between the corresponding PC score and the SPI time series, for: (a) NCEP/NCAR, (b) GPCC.
checked using longer time records because the time variabil-ity of the SPI in that area is not well captured by the corre-sponding rotated PC score. This feature should be analyzed further using GPCC with higher resolution or/and a denser rain-gauge network.
1950 1960 1970 1980 1990 2000 −3 −2 −1 0 1 2 3 time (year) PC−1 NCEP/NCAR (a) (b) 1950 1960 1970 1980 1990 2000 −3 −2 −1 0 1 2 3 time (year) PC−1 GPCC
Fig. 4. Principal component analysis of the SPI field. First
prin-cipal component score time series (PC-1) for: (a) NCEP/NCAR,
(b) GPCC. Straight lines denote the fitting linear trends, while red
lines the reconstructed PC-1 time series using only the leading SSA component.
In Fig. 6a–d the time series of the rotated PC scores for NCEP/NCAR are shown and compared with the ones asso-ciated with the same sub-regions obtained for GPCC. Their correlation coefficients are listed in Table 4. The compari-son between NCEP/NCAR and GPCC suggests that there is a satisfactory agreement between the RPCs associated with the southern and north-western sub-regions (Fig. 6b, c) with cor-relation coefficients 0.72 and 0.60, respectively. Noticeable discrepancies occur, instead, between the RPCs associated with the central and northern sub-regions (Fig. 6a, d). In par-ticular, major differences emerge for the periods before 1955, 1960–1970, 1992–1998 and 2002–2007 in Fig. 6a, while be-fore 1960 and in many time sections throughout the record in Fig. 6d.
Furthermore, both NCEP and GPCC capture a linear trend (here not shown) towards negative values (dry periods) in the RPC scores associated with the north-western region (Fig. 6c): the fitting linear trend for NCEP accounts for about 31% of variability, while that for GPCC 12%. Even for the central sub-region (Fig. 6a) a linear trend is detectable, which is towards negative values for NCEP, accounting for about 42% of the RPC score variability, while it is towards positive values for GPCC and explains about 9% of variability.
Fig. 5. The four Varimax rotated loadings of the SPI field on
24-month time scale for: (a–d) NCEP/NCAR, (e–h) GPCC.
Summarizing, NCEP/NCAR and GPCC datasets are in good agreement in identifying the following four sub-regions as the principal spatial modes of drought variability: north-western, northern, central-western and south-eastern areas. These regions have different and independent time variabil-ity that is not univocally represented by the two datasets. These results are in agreement with those found by Raziei et al. (2010) for the shorter period 1951–2005 and for the SPI on 12-month time scale. In particular, the identified sub-regions are almost the same, suggesting that they are stable with respect to the time scales considered, and the major dis-crepancies are found in RPCs time series associated with the central and Caspian sea regions.
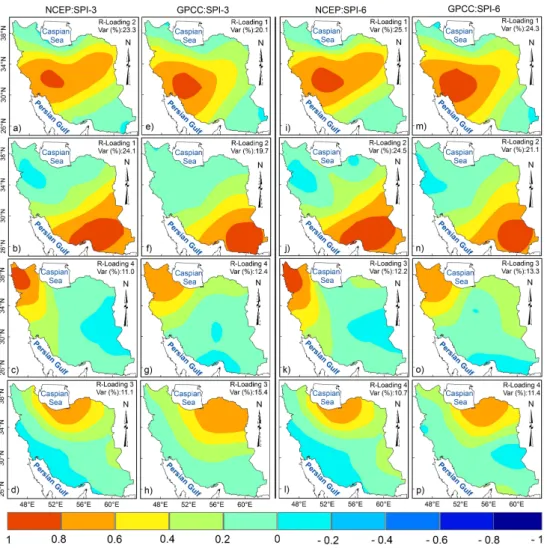
Just to complement the study on drought regionaliza-tion, additional analyses have been carried out using both NCEP/NCAR and GPCC datasets for shorter SPI time scales. In particular, 3 and 6-month time scales have been con-sidered, usually adopted for monitoring meteorological and
1950 1960 1970 1980 1990 2000 −4 −2 0 2 4 time (year) (a) (b) (c) (d) 1950 1960 1970 1980 1990 2000 −4 −2 0 2 4 time (year) 1950 1960 1970 1980 1990 2000 −4 −2 0 2 4 time (year) 1950 1960 1970 1980 1990 2000 −4 −2 0 2 4 time (year) RPC2 GPCC RPC1 NCEP RPC1 GPCC RPC2 NCEP RPC3 GPCC RPC3 NCEP RPC4 GPCC RPC4 NCEP
Fig. 6. First four rotated PC score time series (RPCs) of the SPI
on 24-month time scale associated with the same sub-regions for NCEP/NCAR (black lines) and GPCC (red lines) datasets for the common period 1948–2007.
agricultural drought. Results obtained for the rotated load-ings are shown in Fig. 7. By comparing the rotated loadload-ings for the different time scales considered (Fig. 2 in Raziei et al., 2010, Fig. 5 and 7 in the present paper), clearly emerges that the spatial patterns of drought are almost stable as a function of the SPI time scale. Also, for a given identified sub-region, it can be noted that the percentage of variance explained by the R-Loadings increases from 3 to 24-month time scale, suggesting a more complex character of the SPI field for short time scales. This result differs from the main finding obtained by Vicente-Serrano (2006) for the Iberian Peninsula using observations. In that case, in fact, the au-thor pointed out the increasing spatial complexity of drought modes as the time scale of the SPI is increased. However, further analyses are necessary to properly compare the re-sults obtained for Iran with those for the Iberian Peninsula. The origin of the different sensitivity of drought regionaliza-tion to the SPI time scale may be due to the different spatial resolution and origin of data, or to the different precipitation
regimes characterizing the two countries, or to the rule used for selecting the loadings for Varimax rotation. Preliminary analyses (here not shown) exclude that the latter motivation can be the cause of the different result obtained. An in depth analysis of the remaining two aspects would depart from the main target of the paper and for this reason it is left as a topic for a new publication.
3.3 SPI correlation analysis
As noted before, NCEP RPCs associated with north-western and south-eastern regions show satisfactory correlations with the counterpart RPCs of GPCC, while very low correlations are found for the other two sub-regions, i.e. northern and central-western regions. Since noticeable differences are found for the period before the mid seventies, and it is known that in 1979 there was a change in the NCEP/NCAR assim-ilation scheme due to the introduction of satellite data that might affect long-term trends (Kistler et al., 2001), the corre-lation maps of the SPI between the two datasets for different time sections have been performed. In addition, the SPI com-puted using NCEP Reanalysis II for the period 1979–2007 has been considered.
Correlation coefficients have been computed after grid-ding the SPI data on the common grid 1◦×1◦in latitude and longitude. Moreover, in avoiding any change due to the dif-ferent calibration periods in the computation of the SPI, the index time series have been re-computed by considering the time section of interest. Results are shown in Fig. 8.
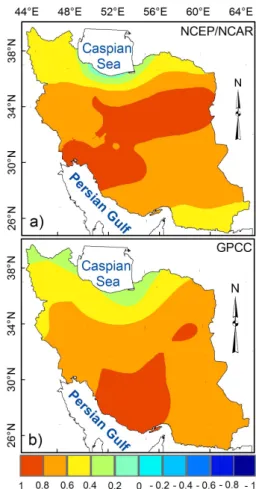
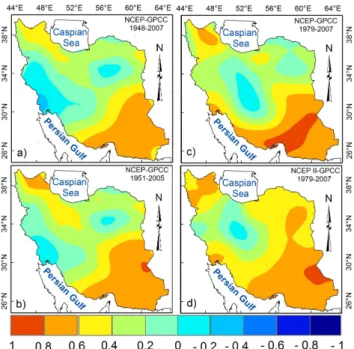
By considering the whole period 1948–2007, correlation coefficients between the SPI series for NCEP/NCAR and GPCC (Fig. 8a) show the higher values (between 0.6 and 0.8) in south-eastern region, while values between 0.4 and 0.6 characterize the north-western area. Major discrepancies (correlation coefficients close to zero or slightly negative) oc-cur in the central region characterized in the west by the high orography (Zagros mountains) and in the east by the semi-arid plateau (see Fig. 1). This suggests that a good agreement between NCEP/NCAR and GPCC is limited to the southern sub-region, as demonstrated by Fig. 6b.
In Fig. 8b the time section 1951–2005 has been considered just for comparison with the results obtained by Raziei et al. (2010) for the SPI on 12-month time scale computed using NCEP/NCAR and rain-gauge observations (their Fig. 4a). In our case, NCEP/NCAR and GPCC show a good agreement in southern and north-western regions as in Fig. 8a. This result confirms that of Raziei et al. (2010) if we take into account the coarse spatial resolution of rain-gauge observations and the different time scale used for the SPI computation, i.e., central regions remain bad represented by the NCEP/NCAR reanalysis.
Finally, Figs. 8c and d show the SPI correlation maps between NCEP/NCAR and GPCC, and NCEP Reanalysis II and GPCC, respectively, for the common period 1979–2007. This period was selected to investigate the possible impact
Fig. 7. The four Varimax rotated loadings for NCEP/NCAR and GPCC datasets of the SPI field on: (a–h) 3-month time scale, (i–p) 6-month
time scale. Percentages of variances explained by the rotated loadings are displayed on the upper right corners.
of satellite data used in the NCEP assimilation scheme on drought assessment through the SPI. Results suggest that, while there are no improvements in the southern and northern regions, a better agreement is obtained in the central region, even if this region remains not well represented by NCEP Reanalysis II with respect to GPCC.
Thus, in view of these results, the following considerations can be made:
(i) In southern Iran, SPI time series computed using NCEP/NCAR and GPCC for the period 1948–2007 are in good agreement showing correlations between 0.6 and 0.8. A satisfactory agreement is found in the north-western region (correlation coefficient between 0.4 and 0.6), while noticeable discrepancies are found in central Iran;
(ii) By considering the shorter period 1979–2007, the over-all correlation between SPI from NCEP/NCAR and
GPCC increases, even if the central region remains not well represented by the reanalysis dataset;
(iii) NCEP Reanalysis II seems to provide an improvement of the correlation with GPCC SPI. However, several dis-crepancies remain in central Iran, suggesting that they cannot be ascribed only to the introduction of satellite data into the reanalysis assimilation system;
(iv) The origin of the discrepancies between NCEP/NCAR (including NCEP Reanalysis II) and GPCC remains an open question. It may be related to orographic effects on precipitation that are not well captured by the reanalysis model. Central Iran, in fact, is characterized by Zagros chain and by a vast area situated on the lee side of moun-tains. Thus, caution must be used in assessing drought variability in central Iran using NCEP/NCAR reanaly-sis and additional checks with other sources of data are suggested.
Fig. 8. SPI (on 24-month time scale) correlation maps for different
time sections and datasets: a) NCEP/NCAR and GPCC for the pe-riod 1948–2007, b) NCEP/NCAR and GPCC for the pepe-riod 1951– 2005, c) NCEP/NCAR and GPCC for the period 1979–2007, and d) NCEP Reanalysis II and GPCC for the period 1979–2007.
4 Conclusions and discussion
In the present paper an analysis of hydrological drought and wetness variability in Iran during the period 1948–2007 is presented using both NCEP/NCAR reanalysis and GPCC dataset. The SPI on 24-month time scale is used to assess drought and wetness conditions.
The analysis of the area covered by dry events (Ad) as a
function of time shows for the NCEP/NCAR an increasing linear trend and a change in the latest years characterized by a rapid decrease of the area extension. The latter feature, more pronounced in GPCC dataset, is in agreement with the recent investigations on long-term trends in drought signals when an update is taken into account for a continental-scale study at Europe (Bordi et al., 2009). However, the area extension for GPCC does not show a clear tendency towards an increase; it seems that this is mainly due to the discrepancies occurred during the period 1960–1975 when a greater percentage of area interested by drought is captured by GPCC with respect to NCEP/NCAR.
For what concerns the area covered by wet events (Aw),
while NCEP/NCAR shows an overall decrease as a function of time, GPCC does not. This is mainly due to the discrep-ancies occurred roughly during the period 1990–2000, i.e. a greater percentage of area covered by wet events is captured by GPCC with respect to NCEP/NCAR. It is worth to notice the hint of an increasing Awduring the last six years of the
time record in GPCC, which is in agreement with the results
found by Bordi et al. (2009). Such a change is not well cap-tured by NCEP/NCAR data that in the latest years reveals near normal conditions.
Summarizing, surprisingly enough, results for Iran suggest that GPCC dataset captures the trend change in recent years as observed for the European sector by Bordi et al. (2009), though several discrepancies are noticeable between reanal-ysis and gridded data.
In all cases, the nonlinear fittings of Ad and Aw through
SSA seem to properly represent the time evolution of the ar-eas extent by capturing the long-term fluctuations. The lin-ear fittings highly depend on the time section considered, thus their interpretation and statistics have a relative mean-ing. Classical statistics used in hydrology, in fact, must be revised under the hypothesis of a varying climate (see Kout-soyiannis, 2003 and references therein). Here, monotonic trends are presented just to unveil the overall long-term ten-dency of drought/wetness signals and for comparisons with the previous study by Bordi et al. (2009).
The PCA of the SPI field computed with NCEP/NCAR and GPCC data provided the leading spatial pattern and the associated temporal behaviour of drought/wetness across Iran. It is found that while there is a good agreement be-tween the first loadings of the two datasets, the first PC scores have several discrepancies. The same holds when a Varimax rotation is applied to the first four loadings for regionaliza-tion purposes: the two datasets agree in identifying four sub-regions as the principal spatial modes of drought variability, but the SPI time behaviours in these areas are not univocally represented by the two datasets. In particular, very good and satisfactory agreements are found for the southern and north-western sub-regions, respectively. On the contrary, several discrepancies are noted for the central and northern regions. The RPC scores for the central sub-region show major dif-ferences before the mid seventies and in recent years, while those for the northern region show differences in several pe-riods throughout the time record. However, the northern sub-region, identified by the fourth rotated loadings, explains a small percentage of variance (8–9%), suggesting that its ro-bustness must be checked against a longer time record and/or dense rain-gauge observations.
Additional analyses for short SPI time scales (3 and 6-months) (Fig. 7), jointly with the results by Raziei et al. (2010), show that in Iran the spatial patterns of drought are almost stable with respect to the time scale considered (i.e. independent on the type of drought analysed).
The correlation analysis between the SPI time series of NCEP/NCAR (including NCEP Reanalysis II) and GPCC for different time sections suggests that the differences un-veiled in central Iran cannot be related only to the change in the NCEP assimilation scheme occurred in 1979 when satellite data have been introduced. The origin of these dis-crepancies remains not clear. It may be related to the oro-graphic effects on precipitation field that are not well cap-tured by the reanalysis model. Since precipitation is mainly
controlled by baroclinic instability and its modification under orographic forcing, complementary studies should be done on orographic-baroclinic instability processes and their role in determining the climate variability of central Iran (Bordi et al., 2002, 2004).
Summarizing, we may argue that in assessing hydrologi-cal drought and wetness variability over Iran, NCEP/NCAR compares favourably with GPCC in southern and north-western regions, while in the central region reanalysis data must be used with caution. Recently, Raziei et al. (2010) have compared NCEP/NCAR reanalysis and GPCC data with observations at 32 rain-gauge stations by applying the PCA to the SPI on 12-month time scale. Results, for the common period 1951–2005, showed a very good agreement between GPCC and observations, while several discrepan-cies were noted with NCEP/NCAR data, especially in cen-tral Iran (see Fig. 2, Fig. 3 and Table 2 in the aforementioned paper). Thus, GPCC dataset appeared to be a useful tool to complement the information provided by rain-gauge stations and seemed suitable to be used in place of the observations for further studies.
However, it should be noted that the agreement between GPCC product and observations was somewhat expected because rain-gauge data are incorporated into the gridded GPCC analysis system (Schneider et al., 2008). The in-terpretation of the discrepancies between NCEP/NCAR and GPCC datasets, instead, remains a very difficult task. On one hand, GPCC monthly precipitation analysis products are based on anomalies from climatological normals at the sta-tions, or where no station normal is available, from GPCC high-resolution gridded climatology. The anomalies are spa-tially interpolated and the gridded anomalies are then super-imposed on GPCC background climatology. Moreover, (i) the data global coverage per month varies from less than 10.000 to more than 45.000 stations along the time section (see Fig. 7 in Schneider et al., 2008); (ii) the spatial distri-bution of Iranian stations is quite uniform with the excep-tion of central Iran (see Fig. 8 in Schneider et al., 2008). In principle, besides the several quality checks applied, all these features might introduce in the final precipitation prod-uct some shortcomings in time and space. On the other hand, NCEP/NCAR precipitation data are numerical model fore-casts and no precipitation observations are assimilated into the reanalysis system. Moreover, as stated in the introduc-tion, the observing system used in the reanalysis changed along the years and more observations were added into the reanalysis assimilation scheme. Lastly, since central Iran is largely occupied by high-mountain relieves and areas shel-tered by Zagros lee faces, it seems conceivable that orogra-phy hardly affects precipitation field and the reanalysis might not be effective in properly capturing the orographic and/or mesoscale phenomena leading to precipitation events in such area.
Thus, based on the results obtained, it is hard to objectively determine which dataset (gridded data or reanalysis) is closer to the reality, may be gridded data, but further analyses are recommended using different (and independent) sources of data to better understand the discrepancies found in central Iran.
Acknowledgements. NCEP/NCAR data were obtained from the
NOAA/CDC web site http://www.cdc.noaa,gov, while GPCC data were freely provided by the Deutscher Wetterdienst through their web site http://www.dwd.de. Valuable comments by the referees and the Editor helped to improve the paper.
Edited by: A. Shamseldin
References
Beck, C., Grieser, J., and Rudolf, B.: A new monthly precipitation climatology for the global land areas for the period 1951 to 2000. DWD, Klimastatusbericht KSB 2004, ISSN 1437–7691, ISSN 1616–5063 (internet), ISBN 3-88148-402-7, 181–190, 2005. Bordi I., Frigio, S., Parenti, P., Speranza, A., and Sutera, A.: The
analysis of the Standardized Precipitation Index in the Mediter-ranean area: large-scale patterns, Annali di Geofisica, 44, 965– 978, 2001.
Bordi, I., Dell’Aquila, A., Speranza, A., and Sutera, A.: Formula for a baroclinic adjustment theory of climate, Tellus, 54A, 260– 272, 2002.
Bordi, I. and Sutera, A.: Drought variability and its climatic impli-cations, Global and Planet Change, 40, 115–127, 2004. Bordi, I., Dell’Aquila, A., Speranza, A., and Sutera, A.: On the
mid-latitude tropopause height and the orographic-baroclinic ad-justment theory, Tellus, 56A, 278–286, 2004.
Bordi, I., Fraedrich, K., Petitta, M., and Sutera, A.: Large-scale assessment of drought variability based on NCEP/NCAR and ERA-40 re-analyses. Water Resour. Manage, 20, 899–915, 2006. Bordi, I., Fraedrich, K., and Sutera, A.: Observed drought and wet-ness trends in Europe: an update. Hydrol. Earth Syst. Sci., 13, 1519–1530, 2009,
http://www.hydrol-earth-syst-sci.net/13/1519/2009/.
Fraedrich, K.: Estimating the dimensions of weather and climate attractors, J. Atmos. Sci., 43, 419–432, 1986.
Ghil, M., Allen, M. R., and Dettinger, M. D.: Advanced spectral methods for climatic time series, Rev. Geophys., 40, 1.1–1.41, 2002.
Hayes, M. J., Wilhelmi, O. V., and Knutson, C. L.: Reducing drought risk: bridging theory and practice, Nat. Hazard Rev., 5, 106–113, 2004.
Janowiak, J. E., Gruber, A., Kondragunta, C. R., Livezey, R. E., and Huffman, G. J.: A comparison of the NCEP-NCAR reanalysis precipitation and the GPCP rain gauge-satellite combined dataset with observational error considerations, J. Climate, 11, 2960– 2979, 1998.
Kalnay, E., Kanamitsu M., Kistler R., Collins W., Deaven D., Gandin L., Iredell M., Saha S., White G., Woollen J., Zhu Y., Leetmaa A., Reynolds R., Chelliah M., Ebisuzaki W., Hig-gins W., Janowiak J., Mo K.C., Ropelewski C., Wang J., Jenne R., and Joseph D.: The NCEP/NCAR 40-year reanalysis project, Bull. Amer. Meteor. Soc., 77, 437–471, 1996.
Kanamitsu, M., Ebisuzaki, W., Woollen, J., Yang, S.-K., Hnilo, J. J., Fiorino, M., and Potter, G. L.: NCEP-DOE AMIP-II Reanalysis (R-2), Bull. Amer. Meteor. Soc., 83, 1631–1643, 2002.
Keyantash, J. and Dracup, J. A.: The quantification of drought: an evaluation of drought indices, Bull. Amer. Meteor. Soc., 83, 1167–1180, 2002.
Kistler, R., Kalnay, E., Collins, W., Saha, S., White, G., Woollen, J., Chelliah, M., Ebisuzaki, W., Kanamitsu, M., Kousky, V., van den Dool, H., Jenne, R., and Fiorino, M.: The NCEP-NCAR 50-year reanalysis: monthly means CD-ROM and documentation, Bull. Amer. Meteor. Soc., 82, 247–267, 2001.
Knutson, C., Hayes, M., and Phillips, T.: How to Reduce Drought Risk. A guide prepared by the Preparedness and Mitigation Working Group of the Western Drought Coordination Council. National Drought Mitigation Center, Lincoln, Nebraska, avail-able online at: http://drought.unl.edu/plan/handbook/risk.pdf, 1998.
Koutsoyiannis, D.: Climate change, the Hurst phenomenon, and hydrological statistics, Hydrol. Sci. J., 48(1), 3–24, 2003. Lloyd-Hughes, B. and Saunders, M. A.: A drought climatology for
Europe. Int. J. Climatol., 22, 1571–1592, 2002.
McKee, T. B., Doesken, N. J., and Kleist J.: The relationship of drought frequency and duration to time scales, in Proc. of the 8th Conference on Applied Climatology, 17–22 January, Anaheim, CA, American Meteorological Society, Boston, MA, USA, 179– 184, 1993.
North, G. R., Bell, T. L., and Cahalan, R. F.: Sampling errors in the estimation of empirical orthogonal functions. Mon. Wea. Rev., 110, 699–706, 1982.
Pereira, L. S., Cordery, I., and Iacovides, I.: Coping with water scarcity, Addressing the challenges, Springer, Dordrecht, The Netherlands, 2009.
Raziei, T., Saghafian, B., Paulo, A. A., Pereira, L. S., and Bordi, I.: Spatial and temporal variability of drought in western Iran, Water Resour. Manage., 23, 439–455, 2009.
Raziei, T., Bordi, I., and Pereira, L. S.: An application of GPCC and NCEP/NCAR datasets for drought variability analysis in Iran. Special Issue: Water Resources Conservancy and Risk Reduc-tion, Water Resour. Manage., doi:10.1007/s11269-010-9657-1, 2010.
Rencher, A. C.: Multivariate statistical inference and applications, John Wiley & Sons Inc., 559 pp., 1998.
Rossi, G.: Requisites for a drought watch system, in G. Rossi et al. (Eds) Tools for drought mitigation in Mediterranean regions, Kluwer Academic Publishers, Dordrecht, 147–157, 2003. Schneider, U., Fuchs, T., Meyer-Christoffer, A., and Rudolf, B.:
Global Precipitation Analysis Products of the GPCC. Global Pre-cipitation Climatology Centre (GPCC), DWD, Internet Publica-tion, available online at: http://www.dwd.de, 1–12, 2008. Trenberth, K. E. and Guillemot, C. J.: Evaluation of the atmospheric
moisture and hydrological cycle in the NCEP/NCAR reanalyses, Clim. Dynam., 14, 213–231, 1998.
Tsakiris, G. and Vangelis, H.: Towards a drought watch system based on spatial SPI. Water Resour. Manag., 18, 1–12, 2004. Vautard, R. and Ghil, M.: Singular spectrum analysis in nonlinear
dynamics, with applications to paleoclimatic time series, Physica D, 35, 395–424, 1989.
Vicente-Serrano, S. M.: Spatial and temporal analysis of droughts in the Iberian Peninsula (1910–2000), Hydrolog. Sci. J., 51, 83– 97, 2006.
Vicente-Serrano, S. M.: Differences in spatial patterns of drought on different time scales: an analysis of the Iberian Peninsula, Water Resour. Manage., 20, 37–60, 2006.
Wilhite, D. A., Hayes, M. J., Knutson, C., and Smith, K. H.: Plan-ning for Drought: Moving from Crisis to Risk Management, J. Am. Water Resour. Assoc., 36, 697–710, 2000.
Wilhite, D. A.: Drought as a natural hazard: Concepts and defini-tions, Drought: A global assessment, Vol. 1, edited by: Wilhite, D. A., Routledge, New York, USA, 1–18, 2000.
Yevjevich, V., Hall, W. A., and Salas, J. D.: Drought research needs, in: Proc. of the Conference on Drought Research Needs, De-cember 12–15, 1977, Colorado State University, Fort Collins, Colorado, Water Resources Publication, Fort Collins, Colorado, USA, 276 pp., 1978.