RUNOFF MEASUREMENT AND PREDICTION
FOR A WATERSHED UNDER NATURAL
VEGETATION IN CENTRAL BRAZIL
(1)C. L. SILVA(2) & C. A. S. OLIVEIRA(3)
SUMMARY
This work aimed to measure and analyze total rainfall (P), rainfall intensity and five-day antecedent rainfall effects on runoff (R); to compare measured and simulated R values using the Soil Conservation Service Curve Number method (CN) for each rainfall event; and to establish average R/P ratios for observed R values. A one-year (07/01/96 to 06/30/97) rainfall-runoff data study was carried out in the Capetinga watershed (962.4 ha), located at the Federal District of Brazil, 47° 52' longitude West and 15° 52' latitude South. Soils of the watershed were predominantly covered by natural vegetation. Total rainfall and runoff for the period were 1,744 and 52.5 mm, respectively, providing R/P of 3% and suggesting that watershed physical characteristics favored water infiltration into the soil. A multivariate regression analysis for 31 main rainfall-runoff events totaling 781.9 and 51.0 mm, respectively, indicated that the amount of runoff was only dependent upon rainfall volume. Simulated values of total runoff were underestimated about 15% when using CN method and an area-weighted average of the CN based on published values. On the other hand, when average values of CN were calculated for the watershed, total runoff was overestimated about 39%, suggesting that CN method shoud be used with care in areas under natural vegetation.
Index terms: Curve number method, water infiltration, runoff/rainfall ratio.
(1) Recebido para publicação em setembro de 1998 e aprovado em abril de 1999.
(2) Professor Adjunto da Faculdade de Agronomia e Medicina Veterinária, Universidade de Brasília - FAV/UnB. Caixa Postal 04508,
CEP 70910-900 Brasília (DF).
RESUMO: MEDIÇÃO E SIMULAÇÃO DO ESCOAMENTO SUPERFICIAL
PARA UMA MICROBACIA HIDROGRÁFICA SOB VEGETAÇÃO NATURAL LOCALIZADA NO CENTRO-OESTE BRASILEIRO
Este trabalho objetivou medir e analisar o efeito das variáveis total precipitado (P), intensidade de chuva e precipitação antecedente em cinco dias, no escoamento superficial (R); comparar valores observados e simulados de R, usando o método da Curva Número (CN), proposto pelo Serviço de Conservação de Solos dos EUA, e estabelecer a relação R/P. No período de 01/07/96 a 30/06/97, foram medidos a precipitação (1.744 mm) e o escoamento superficial (52,5 mm) na microbacia do Córrego Capetinga (964,2 ha), localizada no Distrito Federal. A cobertura vegetal da microbacia é predominantemente natural, constituída de cerrados, campo-cerrado, campo sujo e campo limpo. Em virtude do pequeno volume de escoamento superficial, evidenciaram-se boas características para infiltração na microbacia, haja vista que, no período analisado, a relação R/P foi apenas de 3%. Uma análise de regressão multivariada das 31 principais chuvas, totalizando 781,9 mm as quais provocaram um escoamento de 51,0 mm, indicou que o escoamento dependeu somente da magnitude de cada chuva. Tomando valores da curva número (CN), dados pelos manuais de hidrologia a serem usados no método de mesmo nome e selecionados em função das características edafogeológicas e vegetativas da microbacia, verificou-se uma subestimativa nos valores simulados do escoamento superficial total de 15%, quando comparados com os valores observados. Utilizando valores de CN calculados para a microbacia, o método superestimou os resultados em 39%. Em razão dessas discrepâncias, recomenda-se cautela no uso desse método em áreas sob vegetação natural.
Termos de indexação: método da curva número, infiltração de água, relação escoamento/ precipitação.
(4) USDA-SCS – United States Department of Agriculture – Soil
Conservation Service.
INTRODUCTION
The relationship between depth of storm rainfall (P) and the resulting depth of storm runoff (R) is mainly dependent on soil infiltration. The type of land use or plant cover, agricultural management, hydrologic conditions, soil type distribution, and soil moisture status all affect the proportion of water running off a given watershed area. Higher amounts of overland flow are usually responsible for undesirable soil detachment, transport, deposition, and flooding. Thus, from an environmental and an social viewpoint, surface runoff must be adequately evaluated and minimized by soil conservation practices.
A reliable estimation of storm runoff volume is necessary to adequately design terraces, drainage, and flood control structures. When choosing an adequate type of model for this prediction, one must clearly understand the model objectives and the resources available to meet the goal. A method that can be used to estimate rainfall excess is the USDA – SCS(4) runoff Curve Number (CN) method (USDA,
1972). It uses data on land use, management type and hydrologic conditions, as well as hydrologic soil group. It may also be used for a single or a series of
events. In this lumped parameter method, the influence of spatial variability is accounted for by an area-weighted average of CN “effective values”, applicable to uniform subareas of the entire watershed.
The influence on runoff caused by different types and amount of soil surface residues was studied by several researchers (Stein et al., 1986; Oliveira et al. 1987; Gilley et al., 1987). It was found that such surface residues can reduce or avoid surface runoff and soil erosion and maintain an adequate rate of water infiltration, by minimizing overland flow and rain splash effects. Besides these effects, the soil cover afforded by crops or natural vegetation is also able to intercept raindrops and reduce runoff in comparison with nonvegetated areas (Johnson & Gordon, 1988).
Soil moisture before a rainfall event is very important when developing approximate techniques for modelling runoff. Istok & Boersma (1986), working with low intensity rainfall, concluded that antecedent moisture had a more effective contribution in the amount of overland flow than rainfall intensity. The CN method uses a five-day antecedent rainfall table for dry, normal and wet conditions and for dormant and growing seasons.
(1986) found that infiltration was 43% higher, when using minimum tillage, than under conventional tillage. Since conservation tillage affects runoff volume, there should be changes in CN values. Working with cotton cultivated under minimum and conventional tillage, Yoo et al. (1993) reported calculated CN values higher than the tabulated ones, for both situations. Despite this disadvantage, the CN method is still widely used as a model or submodel in more complete and general watershed models.
Arnold et al. (1993) computed rainfall excess considering the CN method and a Geographic Information System to provide input to their model named SWAT (Soil and Water Assessment Tool). Using SWAT to simulate runoff in a Mississippi large catchment area, Bingner (1996) found that mean annual runoff was adequately estimated for 76% of the small watersheds analyzed. Worst simulated values were obtained for regressions of observed versus simulated areas under natural vegetation gloing R2 as low as 0.21. The author suggested that
underestimation was due to errors introduced by the CN values and the Manning's hydraulic roughness coefficient used. Calibrating the physically based ANSWERS model (Areal Nonpoint Source Watershed Environment Response Simulation) to predict runoff for two small watersheds located southwest of Quebec, Montas & Madramootoo (1991) reported mean discrepancies of -32 and 43.1%, regarding the values obtained for St. Dominique and Rigaud watersheds, respectively. However, it is necessary to keep in mind that 100% accuracy of prediction of a system as complex as a small watershed is hard to achieve, even using deterministic models dealing with the solution of rigorous partial differential equations.
In Brazil, several examples of CN method use and application can be found in the literature, such as runoff estimation under wheat and soybean crop systems (Souza et al., 1995), terrace cross sectional area design (Chaves, 1996) and agricultural and environmental description of an intensive cultivated catchment used mainly for irrigation purposes (Dolabella, 1996). These three papers concluded that the CN method could be used to adequately estimate runoff. No study has been made for catchments under natural vegetation in these three references. Due to the importance of measuring and predicting runoff aiming to reduce flood flow problems in the lowlands of Distrito Federal in Central Brazil, the following research was planned for the Capetinga catchment: (a) to measure and analyze runoff depth produced in a watershed under natural vegetation; (b) to use the CN method to predict runoff depth for each rainfall event and to compare simulated and observed values; (c) to establish average R/P ratios for observed values, during the period analyzed.
MATERIALS AND METHODS
Catchment description -The Capetinga catchment area is located in the southern part of Distrito Federal in Central Brazil, at 47º 52' longitude west and 15º 52' latitude south. The studied area has 962.4 ha and altitude ranging between 1,057.5 and 1,200 m above sea level. It presents flow pathways of approximately 4,330 m and stream length of around 2,810 m. The watershed area and stream average slopes are 3.3 and 1.8%, respectively. Figure 1 shows rainfall recording stations and displacement of the stream gage at the catchment’s outlet.
The catchment had been previously used for agricultural purposes and was later transformed into an ecological reserve area. Today it is mostly covered by natural savannah or cerrado, type of vegetation. Based on soil maps, aerial photographs, and local field inspection, the authors were able to establish the following edaphic and land use classification: (a) 20% of the area is covered by cerrado vegetation, with under subcover dominated by grasses, on well structured, deep clayey soil, with permeable subsoil,
and smooth topography with good condition for infiltration; (b) 20% of the area has a less dense tree cover, with underlying grass, well structured and medium depth clayey soil, subsoil of regular permeability, smooth to undulated topography, and good infiltration; (c) 50% of the area is partially covered by grasses and sparse bushes, shallow soils with pebbles, low permeability subsoil, undulated topography, and reasonable conditions for infiltration; and (d) 10% of the area is located under gallery forest, shallow and varied type of subcover, well structured and clayey soil, permeable subsoil, flat topography, and good condition for infiltration. CN method and values selection - Runoff was estimated for each storm event by the equations (USDA, 1972):
Re = (P – 0.2S)2 / (P + 0.8S) (1)
Where:
Re = estimated runoff depth (mm), Re = 0 for P ≤ 0.2 S;
P = rainfall depth (mm);
S = potential maximum retention after runoff begins (mm), given by
S = 25.4 [(1,000 / CN) – 10] (2) Where:
CN =dimensionless curve number, 0 ≤ CN ≤ 100. The following hydrologic soil groups and respective CNII values were established for each one of the edaphic and land use classification found in the watershed: (a) Group B and CNII = 61; (b) Group B and CNII = 69; (c) Group C and CNII = 79; and (d) Group B and CNII = 55, respectively. Considering available land use percentages, a composite CNII of 71 was obtained for the watershed. When choosing the Curve Number, it was taken into account the fact that the divide is located in a tropical region characterized by contrasting dry and rainy seasons, which allows for continuous plant growth, and the five-day antecedent precipitation (AP) groups shown on table 1.
Average values of CNI = 50.7 and CNIII = 84.9 for the watershed were calculated using the following nonlinear equations (Chow et al., 1988):
Table 1. Curve number (CN) groups, five-day antecedent precipitation (AP) and soil water condition values
CNI = 4.2 CNII / (10 – 0.058 CNII) (3) CNIII = 23 CNII / (10 + 0.13 CNII) (4) Values of potential maximum retention, S, and computed CN values for each event were obtained using Eq.(1) and Eq.(2), respectively, expressed in terms of measured rainfall-runoff data pairs: S = 10P + 5R - (125 P R + 100R2)1/2 P > 0.2S (5)
and
CN = 25,400 / (S + 254) (6) Depth of runoff estimated by using tabulated and calculated CN values and depth of measured runoff (R) were compared accordingly, using the same initial abstraction before ponding, provided by the method and equal to 0.2S.
Precipitation, runoff and evapotranspiration measurement - Three rainfall recording stations (numbered 1, 2 and 3) were installed within the watershed boundary. A fourth one was already installed at a nearby meteorological station of “Água Limpa” Farm. Prior to the installation of rain gages, they were calibrated to measure daily storage gage totals. Average precipitation was calculated according to the Thiesen method, as suggested by Chow et al. (1988).
Reliability of stream gage readings was improved by the use of a 1.5 m, concrete weir. Using 14 dis-charge events, ranging between 0.08and1.980m3 s-1, an
exponential equation was adjusted (R2 = 0.97):
Q = 6.034 H1.640 (7)
Where:
Q = stream discharge, m3 s-1;
H= stream depth relative to the weir crest, m. For each real storm event, a runoff hydrograph was calculated with the help of equation 7. Separation of overland flow and baseflow was done using the methodology proposed by Chow et al. (1988).
In order to evaluate whether runoff depends on P, AP and precipitation rate (Pr), the storm events providing volume of runoff greater or equal than 0.1 mm were analyzed using the Statistics Analysis System - SAS package.
An estimation of annual actual evapotranspiration (ET) was obtained using the simplified water balance equation given by:
ET = P – R – L ± ∆θ (8)
Where:
L = loss to groundwater, mm; ∆θ = change in water storage, mm.
Annual loss to groundwater was assumed to be equal to the total annual baseflow and changes in storage were neglected.
CN Group AP Soil water
I AP < 35.5 mm Dry
II 35.5 mm < AP ≤ 53 mm Average
RESULTS AND DISCUSSION
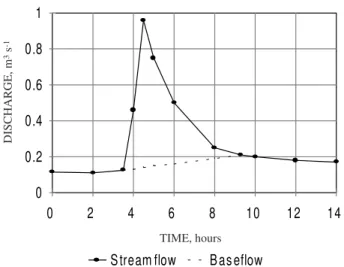
Precipitation and overland flow data were analyzed for the annual hydrological cycle (July 1996 - June 1997). A typical storm runoff event is shown in figure 2. During the observation period, a maximum of three rainfall events per day was observed. Rainfall rates, time and duration of 210 rainfall events were recorded totaling 1,744 mm. A total of 61 events produced 52.5 mm of rainfall-runoff, but only 31 events, totaling 51 mm, provided runoff greater or equal to 0.1 mm. These 31 events were analyzed and are summarized in table 2.
Observed total runoff is usually accepted to be highly dependent upon total precipitation, precipitation rate, and previous five-day precipitation. To check the influence of these independent variables on the dependent variable, a multiple regression analysis was performed (Table 3). For the period analyzed, results showed that the only independent variable affecting total runoff was total rainfall with a significance level close to 100% and R2 equal to 0.84. Thus, for the set of data collected
under natural vegetation, it is expected that AP and Pr will have little effect on the value of S and, consequently, runoff estimation. Hauser & Jones (1991) obtained similar results regarding AP. When compared with a cropped soil, a soil under natural vegetation can provide adequate protection, increase the amount of rainfall for which no runoff will occur (initial abstraction) and can also reduce precipitation rate effects on runoff.
Even though all storm events had runoff greater than 0.1 mm, nineteen of them provided simulated runoff of zero when using CN tabulated values, due to the empirical constraint P ≤ 0.2S imposed by the method, which certainly contributed to the low regression coefficient observed (Figure 3). The number of zero runoff events was reduced to seven when using calculated CN values.
Using the area-weighted average of CNII equal 71, based on published values of CN, the estimated total runoff for the whole year was 43.0 mm, as opposed to the measured value of 51.0 mm. Considering the type of natural phenomena being predicted, it showed a relatively small difference (15.3%). However, considering each event individually, a large discrepancy was observed among them, since there was little agreement (R2 = 0.32) between
simulated and observed runoff (Figure 3). Adjusted values underestimated measured values about 20%. A similar underestimation was found for the Goodwin Creek Watershed (Bingner, 1996) and suggests that values of CN were underestimated and consequently S and initial abstraction values should be reduced, accordingly. The tendency to calculate CN values higher than the tabulated one was also reported by Yoo et al. (1993) when studying cotton under minimum tillage and conventional tillage.
The averages of the 31 calculated values for CN (CNI = 74; CNII = 78 e CNIII = 81) were close to each other and reinforced the results concerning non significance of antecedent precipitation to estimate runoff and the need to increase CNII values in order to decrease initial abstraction. When using calculated CN values, estimated runoff for the year was 75.4 mm and regression (R2 = 84) between
simulated and observed runoff values overestimated measured values in 39% (Figure 4). This was due to the increased value of calculated CNII that provided low S estimates and, consequently, reduced initial abstraction before ponding.
Table 2. Total precipitation (P), average precipitation rate (Pr), five-day antecedent precipitation (AP), measured runoff (R), estimated runoff for tabulated CN values (Ret), and estimated runoff for calculated CN values (Rec) obtained at Capetinga watershed. Group I: AP ≤≤≤≤≤ 35.5 mm; Group II: 35 mm < AP < 53 mm; and Group III: AP ³ 53 mm
P Pr AP R Ret Rec
mm mm/hour ___________________________ mm ___________________________
19.8 4.4 79 0.2 2.1 1.0
12.0 1.0 85 0.2 0.2 0.0
11.6 2.0 14 0.1 0.0 0.0
30.0 3.4 12 0.6 0.0 1.6
16.4 9.5 42 0.1 0.0 0.1
37.7 17.2 91 8.2 11.1 7.9
14.2 7.1 24 0.3 0.0 0.0
16.5 3.2 46 0.6 0.0 0.1
27.9 3.8 67 0.2 5.6 3.5
63.5 5.2 24 10.2 0.8 15.8
10.3 3.0 82 0.2 0.0 0.0
20.6 3.2 21 0.2 0.0 0.1
19.8 15.6 32 0.2 0.0 0.1
22.9 4.0 26 0.3 0.0 0.3
21.4 2.2 28 1.3 0.0 0.2
35.6 6.1 52 3.8 1.9 5.2
28.4 8.3 53 2.7 0.5 2.5
15.2 8.8 42 0.2 0.0 0.0
44.7 9.5 21 4.0 0.0 6.4
15.2 6.1 68 1.0 0.7 0.2
15.8 5.1 4 0.8 0.0 0.0
45.8 5.0 59 6.6 16.5 12.4
18.7 3.0 76 1.1 1.7 0.7
9.1 1.1 104 0.2 0.0 0.0
40.7 1.2 9 2.7 0.0 4.8
21.2 8.2 51 0.2 0.0 0.7
31.8 4.9 38 2.9 1.1 3.7
31.8 6.4 0 0.4 0.0 2.0
42.2 19.8 32 0.6 0.0 5.4
15.4 1.5 74 0.2 0.8 0.2
25.7 9.2 0 0.7 0.0 0.7
An average tabulated CN value for a given group of land use may introduce large errors in runoff estimation considering the fact that the amount of rainfall intercepted by the watershed natural vegetation can vary widely with species and location. Interception reached 58% of the incident rainfall for
Picea abies (conifer, known as evergreen tree), in the USA (Zinke, 1967) and 30% of precipitation lower than 25 mm for cashew trees, in India (Rao, 1987). Considering that this type of interception is equivalent to reducing values of P, equations five and six help to explain why calculated values of S and CNII were reduced and increased, respectively. The bias introduced for not correcting (reducing) P
Figure 3. Simulated vs. measured individual storm-runoff event in Capetinga watershed using tabulated values of CN.
Figure 4. Simulated vs. measured individual storm-runoff event in Capetinga watershed using calculated values of CN.
y = .07 + .808x r2 = .32
0 3 6 9 12 15 18
0 3 6 9 12 15 18
MEASURED RUNOFF, mm
PREDICTED RUNOFF USING
T
ABULA
TED CN, mm
MEASURED RUNOFF, mm
PREDICTED RUNOFF USING
CALCULA
TED CN, mm
y = .13 + 1.39x r2 = .84
0 3 6 9 12 15 18
0 3 6 9 12 15 18
values, due to interception, helps explain part of the runoff (Rec) overestimation obtained when using
calculated CN values and suggests that values of CN should be used with care for predicting runoff in watersheds under natural vegetation.
Considering annual values of runoff and baseflow (444 mm), it was possible to calculate total annual ET equal to 1,247.5 mm and the average daily actual ET of 3.4 mm/day. For the 210 and 31 rainfall-runoff events, the average flow coefficients given by the annual R/P percentages were 3.0 and 6.5, respectively, suggesting that the watershed provided good conditions for rainfall infiltration. One possible explanation for this would be the fact that practically
= 0.07 + 0.808x R2 = 0.32
= 0.13 + 1.39x R2 = 0.84
Yˆ Yˆ
Figure 2. Capetinga watershed flood hydrograph showing baseflow curve and runoff separation starting at about 4:00 pm, on May 22, 1997.
0 0.2 0.4 0.6 0.8 1
0 2 4 6 8 10 12 14
Tim e (hours )
S tream flow B as eflow
Table 3. Summary of multiple regression analysis (using Statistics Analysis System – SAS package) showing the dependence of total runoff on the independent variables studied and their interaction, Student “t” test (23 degrees of freedom), and p-level values
TIME, hours
DISCHARGE, m
3 s
-1
Independent variables t(23) p-level
Precipitation - P 4.126 0.0004 Precipitation rate - Pr 0.744 0.4645 Previous precipitation - AP 0.940 0.3571
P x Pr -1.657 0.1120
P x AP -0.661 0.5153
Pr x AP -0.657 0.5175
all the watershed area is under natural vegetation and it is protected to avoid destructive burning events. However, R/P annual percentages obtained for this watershed may only be extrapolated to other similar watershed after a longer period of observation. The R/P ratio, also used to compute peak rate of runoff, is given more importance nowadays because of the possibility of predicting dispersion of dissolved pollutant. According to Church et al. (1995) R/P ratios were established for the northeast United States. However, direct gathering of data at the site itself was recommended for a specific site.
CONCLUSIONS
1. The amount of measured runoff obtained in the Capetinga watershed allowed to verify the effective infiltration capacity and its high dependency on total rainfall.
2. Simulated values for 31 events underestimated and overestimated measured values when using tabulated and computed CNII values, respectively.
3. For the 210 and 31 rainfall-runoff events, the average flow coefficient given by the annual R/P percentages were 3.0 and 6.5, respectively, suggesting that the watershed provided good conditions for rainfall infiltration.
LITERATURE CITED
ARNOLD, J.G.; ALLEN, P.M. & BERNHARDT, G. A comprehensive surface-ground water flow model. J. Hydr., 142:47-69, 1993.
BINGNER, R.L. Runoff simulated from Goodwin Creek Watershed using SWAT. Trans. Am. Soc. Agric. Eng., 39:85-90, 1996.
CASTRO, O.M.; LOMBARDI NETO, F.; VIEIRA, S.R. & DECHEN, S.C.F. Sistemas convencionais e reduzidos de preparo do solo e as perdas por erosão. R. Bras. Ci. Solo, 10:167-171, 1986.
CHAVES, H.M.L. Novo enfoque para o dimensionamento da área de seção transversal de terraços de retenção. R. Bras. Ci. Solo, 20:141-150, 1996.
CHOW, V.T.; MAIDMENT, D.R. & MAYS, L.W. Applied hydrology. New York, Mc Graw-Hill, 1988. 572p.
CHURCH, M.R.; BISHOP, G.D. & DAVID, L.C. Maps of regional evapotranspiration and runoff precipitation ratios in the northeast United States. J. Hydr., 168:283-298, 1995. DOLABELLA, R.H.C. Caracterização agroambiental e avaliação
da demanda e da disponibilidade dos recursos hídricos para a agricultura irrigada na bacia hidrográfica do rio Jardim - DF. Brasília, Universidade de Brasília, 1996. 108p. (Tese de Mestrado)
GILLEY, J.E.; FINKER, S.C. & VARVEL, G.E. Slope length and surface residue influences on runoff and erosion. Trans. Am. Soc. Agric. Eng., 30:148-152, 1987.
HAUSER, V.L. & JONES, O.R. Runoff curve numbers for the southern high plains. Trans. Am. Soc. Agric. Eng., 34:142-148, 1991.
ISTOK, J.D. & BOERSMA, L. Effect of antecedent rainfall on runoff during low-intensity rainfall. J. Hydr., 88:329-342, 1986.
JOHNSON, C.W. & GORDON, N.O. Runoff and erosion from rainfall simulator plots on sagebrush rangeland. Trans. Am. Soc. Agric. Eng., 31:421-427, 1988.
MONTAS, H.J. & MANDRAMOOTOO, C.A. Using the ANSWERS model to predict runoff and soil loss in Southwestern Quebec. Trans. Am. Soc. Agric. Eng., 34:1754-1762, 1991. OLIVEIRA, C.A.S.; HANKS, R.J. & SHANI, U. Infiltration and
runoff as affected by pitting, mulch and sprinkler irrigation. Irrig. Sci., 8:49-64, 1987.
RAO, A.S. Interception losses of rainfall from cashew trees. J. Hydr., 90:293-301, 1987.
SOUZA, J.L.; NETO, F.L. & TUBELIS, A. Estimativa e análise do escoamento superficial em solo descoberto e cultivado com a sucessão soja e trigo, sob diferentes sistemas de manejo. R. Bras. Agron., 3:77-84, 1995.
STEIN, O.R.; NEIBLING, W.H.; LOGAN, T.J. & MOLDENHAUER, W.C. Runoff and soil loss as influenced by tillage and residue cover. Soil Sci. Am. J., 50:1527-1531, 1986.
USDA. Soil Conservation Service. National engineering handbook, Section 4. Hydrology. Washington, D.C., 1972. YOO, K.H.; YOON, K.S. & SOILEAU, J.M. Runoff curve numbers
determined by three methods under conventional and conservation tillage. Trans. Am. Soc. Agric. Eng., 36:57-63, 1993.