www.hydrol-earth-syst-sci.net/15/1185/2011/ doi:10.5194/hess-15-1185-2011
© Author(s) 2011. CC Attribution 3.0 License.
Earth System
Sciences
Rainfall-runoff modelling and palaeoflood hydrology applied to
reconstruct centennial scale records of flooding and aquifer
recharge in ungauged ephemeral rivers
G. Benito1, B. A. Botero2,*, V. R. Thorndycraft3, M. Rico4, Y. S´anchez-Moya5, A. Sope ˜na5, M. J. Machado1, and O. Dahan6
1Museo Nacional de Ciencias Naturales, CSIC, Serrano 115bis, 28006 Madrid, Spain
2Department of Civil Engineering, Universidad Nacional de Colombia sede Manizales, Manizales, Colombia 3Department of Geography, Royal Holloway University of London, Egham, Surrey TW20 0EX, UK
4Pyrenean Institute of Ecology, CSIC, Avda. Monta˜nana 1005, 50059 Zaragoza, Spain 5Institute of Geosciences, CSIC-Universidad Complutense, 28040, Madrid, Spain
6Zuckerberg Institute for Water Research, Ben-Gurion University of the Negev, Sde Boqer, 84990, Israel *current address: Facultad de Ingenier´ıas, Universidad de Medell´ın, Medell´ın, Colombia
Received: 26 November 2010 – Published in Hydrol. Earth Syst. Sci. Discuss.: 21 December 2010 Revised: 21 March 2011 – Accepted: 28 March 2011 – Published: 8 April 2011
Abstract. In this study we propose a multi-source data approach for quantifying long-term flooding and aquifer recharge in ungauged ephemeral rivers. The methodology is applied to the Buffels River, at 9000 km2 the largest ephemeral river in Namaqualand (NW South Africa), a re-gion with scarce stream flow records limiting research in-vestigating hydrological response to global change. Daily discharge and annual flood series (1965–2006) were esti-mated from a distributed rainfall-runoff hydrological model (TETIS) using rainfall gauge records located within the catchment. The model was calibrated and validated with data collected during a two year monitoring programme (2005– 2006) at two stream flow stations, one each in the upper and lower reaches of the catchment. In addition to the mod-elled flow records, non-systematic flood data were recon-structed using both sedimentary and documentary evidence. The palaeoflood record identified at least 25 large floods dur-ing the last 700 yr; with the largest floods reachdur-ing a min-imum discharge of 255 m3s−1(450 yr return period) in the upper basin, and 510 m3s−1 (100 yr return period) in the
lower catchment. Since AD 1925, the flood hydrology of the Buffels River has been characterised by a decrease in the magnitude and frequency of extreme floods, with palaeoflood discharges (period 1500–1921) five times greater than the largest modelled floods during the period 1965–2006. Large
Correspondence to:G. Benito ([email protected])
floods generated the highest hydrograph volumes, however their contribution to aquifer recharge is limited as this de-pends on other factors such as flood duration and storage ca-pacity of the unsaturated zone prior to the flood. Floods hav-ing average return intervals of 5–10 yr (120–140 m3s−1)and
flowing for 12 days are able to fully saturate the Spektakel aquifer in the lower Buffels River basin. Alluvial aquifer storage capacity limiting potential recharge by the largest floods is a common problem in arid environments, with the largest infiltration volumes favoured by increasing depth to groundwater levels.
1 Introduction
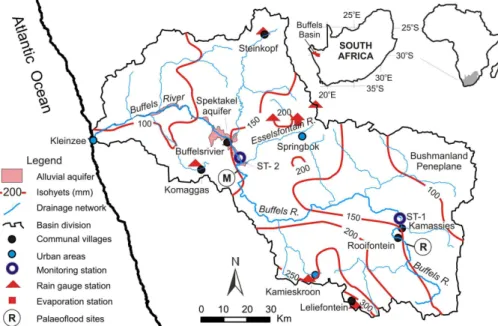
Fig. 1.The Buffels River catchment illustrating the drainage network and rainfall isohyets. The location of the WADE project monitoring stations, rainfall and evaporation stations used in the rainfall-runoff model, palaeoflood study reaches and the Spektakel aquifer system are also shown. Palaeoflood sites: circle-R, Rooifontein; circle-M, Messelpad site.
logistical/monitoring problems that may occur during the oc-casional large floods that produce flow (Morin et al., 2009). In addition, there is a wide diversity of ephemeral river forms and processes (Tooth, 2000), encompassing a range of hydrological, ecological and geomorphic characteristics (Knigton and Nanson, 1977; Enzel and Wells, 1997; Tooth, 2000), which limit theoretical extrapolation of results ob-tained from well documented dryland rivers (e.g. Reid et al., 1995). As a contribution to improving information on flood-recharge hydrology in ephemeral rivers (e.g. Greenbaum et al., 2002; Morin et al., 2009), we propose a multidisciplinary methodological approach to quantify flood discharge, flood-water volume and aquifer recharge for ungauged ephemeral rivers. The methodology was applied in the Buffels River basin, the largest ephemeral river in Namaqualand (north-west South Africa), an example of a large dryland region (ca. 45 000 km2)with virtually no ephemeral river flow monitor-ing stations.
The specific objectives of this study are to: (1) gener-ate an annual flood series through rainfall-runoff modelling for the available rainfall period 1965–2006; (2) combine the modelled flood series with non-systematic flood data derived from centennial scale documentary evidence and geomor-phic palaeoflood records to improve flood frequency analysis (FFA); (3) identify the magnitude and frequency of floods required to produce significant floodwater contribution to aquifer recharge; and (4) discuss the implications of the re-sults for flood hazards and water resources in the context of future climate projections.
2 Study area
The Buffels River (∼250 km in length) is the largest ephemeral river in Namaqualand (Northern Cape Province; South Africa) and drains an area of 9249 km2 into the At-lantic Ocean (Fig. 1). The Buffels catchment bedrock is com-posed of impermeable metasedimentary rocks, basic gran-ites and ultrabasic intrusive rocks, cut by basement faults (Marais et al., 2001). Average annual precipitation is 450 mm near the Kamiesberg headwaters (1200–1600 m in elevation), 102 mm at the western Bushmanland peneplane (914 m), 215 mm at the Springbok mountains (1067 m) and 110 mm at Komaggas on the coastal plain (Fig. 1). Rainfall occurs pre-dominantly in the austral winter between May and Septem-ber, and is usually associated with frontal systems that bring gentle rain and drizzle. Towards the east of Namaqualand and the Buffels River catchment there is a transition to a pre-dominantly summer rainfall regime which is associated with thunderstorms. As a result of this pattern, the majority of floods occur during the winter months although occasional summer rainfall may also cause flash floods. According to an oral history survey carried out in the villages of Rooifontein and Buffelsrivier (Rohde et al., 2005), the Buffels River has flooded 35 times in the last 115 yr: 12% of floods occurred in early winter (April and May); 70% during the mid-winter months (June and July), 6% in August and 12% during sum-mer.
disconnected. These rock outcrops create a series of narrow gorge reaches where suitable sites for palaeoflood hydrology were identified (Fig. 1). In the alluvial valley, the perennial riparian vegetation is dominated by the treesAcacia karroo andTamarix useneoidesand the shrubs,Salsola aphyllaand Suaeda fruticosa. Repeated photographs in the lower reaches of the Buffels River system showed little change in the cover of riparian species since 1930s (Hoffman and Rohde, 2011). The largest alluvial aquifers are located in the lower Buf-fels River: the Kleinzee and Spektakel aquifers (Fig. 1); the latter the focus of this study. The Spektakel aquifer is situ-ated next to the communal village of Buffelsrivier and down-stream from the Messelpad palaeoflood site. It is a 14.6 km long and 680 m wide sand-filled basin carved from granite, with alluvial sand thickness varying between 17 m, in the southern upstream side, to nearly zero (exposed bedrock) in the northern side near the confluence with the Schaap River (Marais, 1981; Fig. 2). The average total porosity of the allu-vial aquifer is 30% and the average effective porosity, or spe-cific yield, is estimated at 20% based on laboratory and in-situ field measurements (Marais, 1981). The total water bear-ing capacity is estimated at 20.85 million m3with a specific yield (drainable porosity) of 13.6 million m3. Considering evaporation and other sources of natural outgoing discharge (mostly negligible), the total volume available for water ab-straction is 11.33 million m3when fully replenished (Marais, 1981; Marais et al., 2001). Water table monitoring over 27 yr fluctuated under natural conditions between 3 and 5 m be-low the river bed level (data from O’okiep Copper Company in Marais, 1981). These observations indicate that during the period 1962 to 1981 (18 yr) full recharge only occurred twice, namely in 1962 and 1967. After full recharge in 1967, a sequence of 6 yr (1968–1973) with abstractions at a rate between 2.2 and 2.4 million m3yr−1 led to nearly depleted aquifer conditions (Marais, 1981). Sustainable long-term abstraction is estimated at 0.7–0.87 million m3yr−1(Marais, 1981; Benito et al., 2009).
3 Methodology
The methodology applied was based on multi-source flood data including: (a) a two year continuous monitoring pro-gramme (2005–2008), (b) hydrological rainfall-runoff mod-elling (1965 to 2006), (c) instrumental rainfall records (1870 to 2006), (d) documentary records since AD 1810, and (e) sedimentological records for the last 700 yr (Benito et al., 2011). The nested chronological approach provided by these overlapping periods enabled cross-checking and, in the case of the hydrological modelling, calibration allowing improved interpretation of the data.
Two hydrological monitoring stations were installed in 2005 near the communal villages of Kamassies and Buffel-srivier (Fig. 1), located in the upper and lower catchments, respectively. The monitoring system included: multilevel,
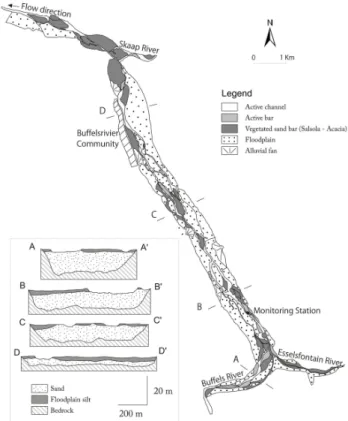
Fig. 2. Geomorphogical map showing the main fluvial units along the Spektakel aquifer and the location of the WADE project moni-toring station. The aquifer cross-sections at locations A to D were adapted from Marais (1981).
Flexible Time Domain Reflectometry probes (FTDR) that were designed to measure the temporal variation of water content in the vadose zone during recharging floods; and wa-ter level devices to record flood stage and groundwawa-ter vari-ations (Dahan et al., 2003, 2008; Rimon et al., 2007). Flood hydrographs, infiltration rates and groundwater table changes were monitored continuously between September 2005 and December 2008.
The TETIS distributed rainfall runoff model (Franc´es et al., 2007) was used to provide a simulated runoff series for the period 1965–2006. The model is based on the balance of water storage components in an extended soil column and runoff propagation was carried out using the kinematic wave approach. Several maps were used to feed the model with the required geomorphic characteristics of the basin: infor-mation such as slope, flow directions and flow paths (cell connection) were obtained from a digital elevation model; hydraulic conductivity of saturated rock (Kp) was derived
from the regional geological map; and the SOTER-GIS for South Africa (Batjes, 2004) was used to obtain the water con-tent capacity (Hu) and hydraulic conductivity of saturated
soil (Ks). The Soil and Terrain (SOTER) report for South
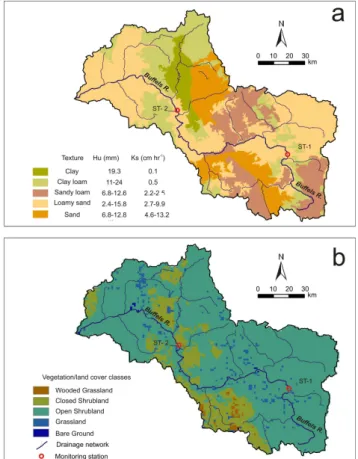
SOTER-GIS map was supported with an additional 47 rep-resentative field soil descriptions in which soil horizon sam-ples were taken for texture and chemical analysis (organic matter content, pH, Eh, and cation exchange capacity). Soils with lower conductivity and higher soil storage capacity are located within the central and northern parts of the Buffels River basin (Fig. 3). The highest soil hydraulic conductivity values vary between 4.6 and 13.3 cm h−1, corresponding to sandy soils in the northeast and central region of the catch-ment. A vegetation cover index map based on data from land use, soil and geologic mapping was also used (Fig. 3).
Rainfall series from seven rainfall gauge stations, which covered most of the Buffels River catchment (Fig. 1), were used in the modelling. Calibration was performed on: (a) correction factors for runoff production and propagation; (b) the initial conditions of storage stage; and (c) the corre-lation coefficient between precipitation and elevation for the spatial interpolation of rainfall distribution. For model cali-bration, a data sequence of daily discharges from 27 Septem-ber 2005 to 28 July 2006 was used, whilst the validation was performed using the period 29 July to 29 September 2006. In both of these periods at least one flood event at Buffelsrivier and Kamassies was recorded. Once the model was calibrated and validated, daily stream flow data were obtained for the period 1965 to 2006, the timespan for which the most com-plete rainfall record is available. For practical purposes mod-elling output results were focused on the palaeoflood study reaches to enable comparison between the systematic and non-systematic discharge records.
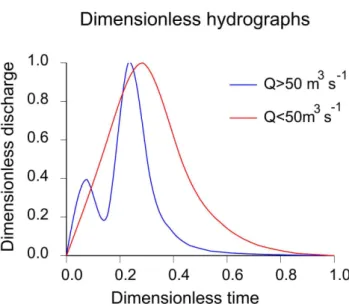
Flood frequency analysis (FFA) was carried out on the combined modelled annual flood series for the period 1965 to 2006 (considered as systematic data) and the non-systematic record compiled from historical documents (Kelso and Vo-gel, 2007) and palaeoflood hydrology. The methodology and results of these palaeoflood records are discussed in Benito et al. (2011). A set of probability distribution functions was fit-ted to the reconstrucfit-ted flood data series and the parameters of these distribution functions were estimated by the max-imum likelihood method (Stedinger and Cohn, 1986). The two-component extreme value (TCEV) distribution was fi-nally selected on the basis of best statistical estimators of ad-justment. Associated infiltration/recharge volumes for var-ious return period floods at the Spektakel alluvial aquifer were estimated for different probabilistic hydrographs. A probabilistic hydrograph is defined as one that preserves a peak discharge exceedance probability and dependence be-tween volume and peak for a fixed duration (England, 2003). Hydrograph durations were fixed to the most common ob-served occurrences, namely 6 days for discharges less than 50 m3s−1 and 12 days for flood discharges over 50 m3s−1. The hydrograph volume was estimated on the basis of two dimensionless hydrographs by visually selecting a represen-tative shape of the modelled hydrographs from a sample of twenty small floods (Q <50 m3s−1)and two large floods
(Q >50 m3s−1).
Fig. 3. (a)Soil texture and(b)vegetation cover index maps of the Buffels River catchment.
4 Results
4.1 Reconstruction of annual hydrologic records 4.1.1 Stream flow monitoring record
The 2005–2006 flows recorded at Buffelsrivier lasted for forty days (Fig. 4a), with flow hydrographs showing peaks which fit the rainfall associated with the passage of winter fronts. Most of the Buffels River flows were recorded at both the upper and lower monitoring stations. Winter flows were recorded first at Buffelsrivier in the lower basin reaching Ka-massies in the upper catchment after a delay that typically ranged between 6 and 12 h. This reflects the passing of west to east frontal systems across the basin (Fig. 1). Summer rains produced short-lived floods (<1 day of duration) with peak discharges half the size of the winter flows. The largest flow peak was recorded in May 2006, reaching a discharge of 20 m3s−1 at Buffelsrivier (Fig. 4a) and 8 m3s−1at Ka-massies.
4.1.2 Rainfall-runoff modelling
The widespread winter rainfall conditions in the Buffels catchment provide optimal data for rainfall-runoff modelling to generate discharge data. Daily discharge and annual flood series (1965–2006) were estimated (Fig. 4a and b) using the TETIS model based on hourly and daily rainfall pro-vided by seven rain gauge stations distributed throughout the catchment. The model performance was satisfactory with a Nash-Sutcliffe (NS) efficiency coefficient of 0.78 for the cal-ibration results (>0.6 considered as reasonably good). The simulated versus recorded hydrograph volumes showed er-rors of 7% and 24% for the calibration and validation hy-drographs respectively (Fig. 4a). The largest modelled dis-charge was obtained for 29 July 2002. At Rooifontein this flood event provided a simulated peak of 63 m3s−1, with river flow spanning 11 days resulting in a hydrograph vol-ume of 7.7 million m3. Downstream at Messelpad the sim-ulated flood peak for the event was 106 m3s−1 again with
a flow duration of 11 days and a corresponding flood vol-ume of 21 million m3(Fig. 4b). During the simulated period, only three floods were over 50 m3s−1at Messelpad, all three
events occurred between 2001–2002. Another two floods were estimated at 40 m3s−1during the winters of 1996 and
1997, corresponding with above average annual rainfall in Springbok. During the period 1965–1996, only two isolated floods (1967 and 1974) surpassed 20 m3s−1 at Messelpad, a similar magnitude to the event recorded at the monitoring station in 2006 (Fig. 4a).
Fig. 4. (a)Surface water discharge (in red) recorded at the Buffel-srivier WADE monitoring station (lower catchment) and results of the calibration (black solid line) and validation (black dashed line) for the TETIS distributed rainfall-runoff model based on seven rain-fall gauges.(b)Daily rainfall and daily peak discharge modelled for the period 1968–2005 at Messelpad (lower catchment).
4.2 Reconstruction of non-systematic flood data
4.2.1 Documentary and historical flood records
Fig. 5. Rainfall record of the Springbok rain station (1878–2006, black line) and rainfall anomaly classes (red bars: drought/dry years; blue bars: wet/normal years) from the documentary records of Kelso and Vogel (2007). Rainfall anomaly class values are only for illustrative purposes: −2 drought year;−1 dry year; +0.5
nor-mal year; 2 wet year. Years with insufficient evidence are not plot-ted. Documented flood years are indicated in the upper x-axis.
on record (394 mm: +94% of annual rainfall). During the 20th Century, the rank of winter precipitation at Springbok is headed by 1915 (454 mm) followed by 1925 (427 mm), 1921 (346 mm), 1917 (311 mm), 1920 (297 mm) and 1914 (279 mm). These fall in the wettest decade (1915–1925) of winter rainfall in the record. Since then, there has been a shift towards decreasing the mean decadal precipitation (Fig. 5).
4.2.2 Sedimentary palaeoflood records
The detailed analysis of the sedimentary flood record and a discussion of dating errors, both of which are beyond the scope of this paper, are provided in Benito et al. (2011). Here we present the downstream channel profiles and selected modelled floodwater elevations at the Rooifontein (Fig. 6) and Messelpad (Fig. 7) study reaches, as well as the syn-thesised flood records extending back to AD 1400 at Rooi-fontein and AD 1500 at Messelpad (Fig. 8). Modelled wa-ter surface profiles for floods of 100 and 310 m3s−1, routed
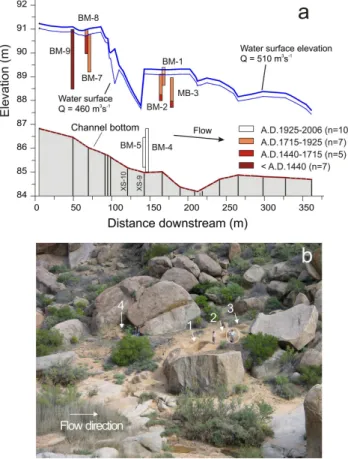
through the Rooifontein reach, are presented in Fig. 6. The figure illustrates the relationship between the floodwater el-evations and the sites of flood sediment deposition, with a simplified indication of sediment ages also presented. The discharge estimation may be compromised at the Rooifontein reach due to scour and fill within the channel bed (see the photograph in Fig. 6 which shows sediment infilling the channel). By contrast the Messelpad reach, where there is exposed bedrock and limited in-channel sediment deposi-tion, is optimal for palaeodischarge reconstruction (Fig. 7). The downstream channel profile here is presented with cal-culated water surface profiles of 460 and 510 m3s−1, which are the discharges associated with the highest elevation flood deposits at the site (Fig. 7).
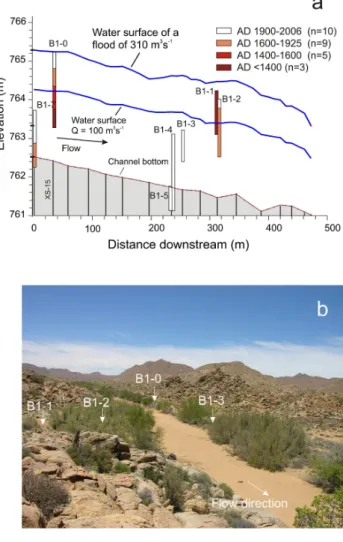
Fig. 6. Rooifontein study reach: (a)longitudinal profile of the stream channel bed and water surface profiles obtained from HEC-RAS modelling for the highest palaeoflood deposits (310 m3s−1)
and for a reference discharge of 100 m3s−1. Stratigraphic profiles
are represented as vertical bars, with colours sketching flood sed-iments of different age. In the legend, n is the number of floods recorded in a given period.(b)General upstream view of the Rooi-fontein reach and location of four stratigraphic profiles B1-0, B1-1, B1-2 and B1-3.
4.3 Flood Frequency Analysis (FFA) combining modelled discharges and non-systematic records
The combined systematic and palaeoflood data is synthesised in Fig. 8a1 and b1, where best-estimate ages are provided for the individual palaeofloods (see Benito et al., 2011). The palaeoflood data represents floods exceeding a given dis-charge threshold (Qh) in a period of known duration, the
Fig. 7. Messelpad reach: (a) longitudinal profile of the stream channel bed and water surface profiles obtained from HEC-RAS modelling (Hydrologic Engineering Center, 1995) for the highest palaeoflood deposits (510 m3s−1)and for a reference discharge of
460 m3s−1. Stratigraphic profiles are represented as vertical bars,
with colours sketching sections of flood sediments of different age.
(b)General view of the upper section of the Messelpad study reach, and location of three profiles: BM-7 (1), BM-8 (2), and BM-9 (4).
methods (Stedinger and Cohn, 1986; Franc´es et al., 1994). Frequency analysis of a 500-yr flood record introduces the question of flood stationarity, since cyclic and systematic climatic and land-use conditions may affect the assumption of statistical parametric models on which the random vari-able (flood discharge) is independent and identically dis-tributed (see discussion in Redmond et al., 2002; Franc´es, 2004). Lang et al. (1999) proposed a stationarity test for non-systematic censored samples that assumes the peak-over-threshold flood series can be described by a homogenous Poisson process. Lang’s stationarity test was passed for the combined flood record at Rooifontein (covering the period 1317–2006) with a lower threshold discharge of 94 m3s−1;
and for Messelpad flood record (period 1526–2006) for a threshold discharge of 460 m3s−1. This indicates, therefore, that the flood series for the Buffels River are suitable for flood frequency analysis.
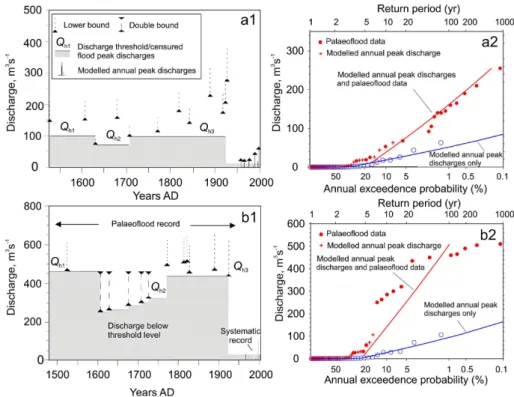
The associated FFA curves are shown in Fig. 8a2 and b2 for the Rooifontein and Messelpad reaches respectively, with a two-component extreme value (TCEV) distribution fitted to: firstly the annual series of modelled discharges only; then the combined modelled and censored palaeoflood data where the grey shaded threshold values are used in the FFA. For the Rooifontein reach in the upper basin, 12 palae-oflood discharges were included, all as lower bound type, with the largest palaeoflood discharge of 255 m3s−1,
signif-icantly greater than the largest discharge (63 m3s−1)for the
modelled annual series (Fig. 8a1). The incorporation of the palaeoflood data into the FFA results in higher values in the magnitude of the flood quantiles (Fig. 8a2; Table 1). In fact, discharge quantiles provided by combining palaeoflood and simulated data are approximately three times larger than ones obtained from annual simulated discharge series alone. For example, the largest palaeoflood discharge (255 m3s−1)is associated with an average return period of 450 yr, whilst the maximum simulated discharge (63 m3s−1)represents an av-erage recurrence interval of 20 yr (Fig. 8a2).
At Messelpad in the lower basin, a total of 12 palaeofloods were included in the FFA, the six palaeofloods post-dating 1750 AD are lower bound type whilst five floods identified between 1600 and 1750 AD are defined using a double cen-sored interval (Fig. 8b1). During AD 1600–1800 flood sedi-mentation occurred exceeding a lower flood bench (threshold levelQh2)but there is no stratigraphic evidence of flood
de-position on the oldest flood bench, which therefore defines an upper threshold levelQh1. At this site, the largest
palae-oflood discharge was 510 m3s−1 (
∼1% annual probability flood) and the largest annual modelled discharge reached 106 m3s−1(
Fig. 8.Palaeoflood and modelled discharges at Rooifontein(a1)and Messelpad(b1). The horizontal shaded areas represent the discharge threshold values (Qh) used in the flood frequency analysis. Two component extreme value distributions fitted to annual series of modelled
peak discharges and palaeoflood information (censored data) for Rooifontein(a2)and Messelpad(b2).
Table 1. Flood quantiles for different return periods for the Rooifontein and Messelpad sites obtained using a two-component extreme value (TCEV) distribution fitted to firstly the annual series of modelled discharges only, then the combined modelled and censored palae-oflood data.
Exceedence Recurrence Annual Average
Probability (%) Interval, yr
Peak discharge m3s−1
Rooifontein Messelpad Modelled Palaeoflood Modelled Palaeoflood
series & Modelled series & Modelled
20 5 8 8 6 23
10 10 18 56 27 140
4 25 32 117 54 287
2 50 42 162 74 397
1 100 52 207 94 505
0.2 500 74 309 139 752
5 Long-term floodwater resources and their contribution to aquifer recharge
Floods are usually viewed as a natural hazard due to their potential damage to society and ecosystems. In arid envi-ronments, however, floods are an important source of wa-ter resulting in long-lasting wawa-ter pools and the recharge of alluvial aquifers (Matlock and Davis, 1972; Enzel and Wells, 1997, Morin et al., 2009). Both natural ecosystems and human societies depend on this scarce water source to
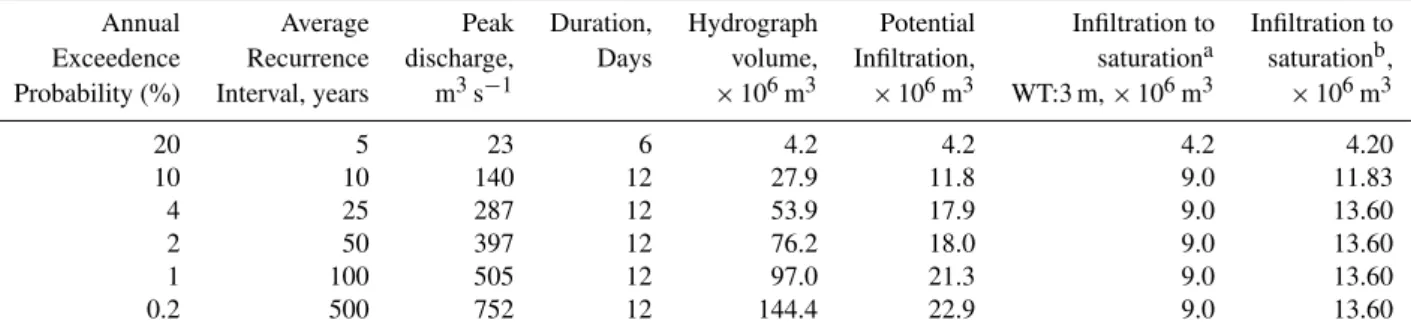
Floodwater contribution to alluvial aquifer recharge in the lower Buffels River was estimated using a set of scaled prob-abilistic hydrographs with peak flows matching those of the FFA (Sect. 4.3). At the Buffelsrivier reach (Fig. 9), flood volumes estimated for the probabilistic scaled hydrographs range between 4 million m3(for a flood with average recur-rence interval of 5 yr) to 144 million m3(average recurrence interval of 500 yr; Table 2). A separate issue is the infiltra-tion potential, which is the hydrograph volume able to infil-trate assuming an unlimited aquifer capacity (Shentsis and Rosenthal, 2003). The infiltration potential is mainly depen-dent on infiltration rate, inundation surface and flow dura-tion. The infiltration rate of the channel bed at Buffelsriv-ier occurs at an average flux of 6 cm h−1, according to the
monitoring station records, whilst an average water flux of 1 cm h−1was estimated for the floodplain sediments which have a similar grain-size distribution to a monitored reach of the Kuiseb River in Namibia (Dahan et al., 2008). The potential infiltration volumes of the Spektakel aquifer were estimated as 4 million m3 for a flood with 5 years of aver-age recurrence interval, and up to 23 million m3 for a flood with 500 yr of average recurrence interval (Table 2). Morin et al. (2009) demonstrated in the Kuiseb River that flood-water infiltration into the alluvial aquifer is mainly sensitive to flood duration and not so much to flood peak discharge, but this is also dependent on river length and aquifer exten-sion. In the Buffels River, however, flood magnitude controls the extent of inundation as for certain flood stages inunda-tion area may cover sand bars and a wider area of the flood-plain, increasing the infiltration volume per unit time. The daily infiltration volumes for floods (Q <50 m3s−1) cover-ing only the channel bed is 2.7 million m3, whilst subsequent inundation of sand bars (Q >50 m3s−1)and floodplain ar-eas (Q >370 m3s−1)increases the daily infiltration volume to 3.8 and 6 million m3, respectively. In a single flood, the mean peak annual discharge from the TCEV distribution fit-ted to the systematic and palaeoflood data, obtained from the expression developed by Beran et al. (1986), was 0.58 m3s−1 with an estimated recharge volume of 105 000 m3. Despite this high floodwater infiltration potential, actual recharge is limited by the water storage potential to full saturation, which depends on water table depth prior to flooding (Morin et al., 2009) as once the groundwater level reaches the surface, transmission losses and recharge cease. In the Spektakel aquifer the water table is relatively shallow (3–5 m below channel bed) even during drought periods due to lateral sub-surface flow from the crystalline basement bedrock (Fersch, 2007). In other arid basins where groundwater is deeper (e.g. Mohave River in southern California; Enzel and Wells, 1997) recharge is highly dependent on flood magnitude. An estima-tion of the probabilistic flood producing effective recharge was undertaken based on two aquifer conditions: a nearly empty aquifer (recharge capacity of 13.6 million m3), and with a water table elevation of 3 m (9 million m3 capacity). The results show that effective recharge is related to
fre-Fig. 9. The dimensionless hydrographs selected from a set of modelled hydrographs for small (Q <50 m3s−1)and large floods
(Q >50 m3s−1).
quent floods (10–20% annual probability floods), whereas for larger flood magnitude/frequency the water table reaches the surface and recharge ceases. This has implications for water resource management under future climate scenarios in southern African ephemeral rivers flowing through land-scapes dominated by basement granitic and metamorphic lithologies. Despite the long-term flood record indicating a reduction in flood magnitude during the last century, a result consistent with future reductions in runoff modelled for global warming scenarios (Milly et al., 2005), there is unlikely to be such a negative impact on the available vol-ume of alluvial aquifer water resources. There could poten-tially, however, be issues affecting water quality as evapo-ration of the shallow groundwater between flows is in-creasing salinity, an issue noted in the communal villages of Buffelsrivier and Rooifontein. This will be especially so if rainfall and flood frequencies decrease under future cli-mate scenarios. Historical observations indicate saturation of the Spektakel alluvial aquifer associated with rainfalls of >75 mm over a period of at least two weeks, causing runoff within the slopes and flow of the main stream and its trib-utaries (Marais, 1981). One possible management solution that could be investigated is the possibility to increase the effective infiltration volume by pumping the alluvial aquifer water, thus lowering the water level along the aquifer length to increase floodwater recharge potential. This could also im-prove water quality due to the low salt content of floodwaters in relation to higher salinity input from lateral flow.
6 Conclusions
Table 2. Peak flood discharges estimated from FFA based on modelled and palaeoflood data at Messelpad (∼5 km upstream of Spektakel
aquifer reach) and characteristics of the probabilistic hydrographs based on dimensionless hydrographs and a fixed duration of 6 days for small floods (Q <50 m3s−1)and 12 days for large floods (Q >50 m3s−1). Potential infiltration considers all the possible infiltration for the
given probabilistic hydrograph assuming a limitless capacity of the aquifer. Infiltration was also estimated for two initial aquifer conditions assuming aawater table (WT) at 3 m below the surface andban empty aquifer at the time of flooding.
Annual Average Peak Duration, Hydrograph Potential Infiltration to Infiltration to Exceedence Recurrence discharge, Days volume, Infiltration, saturationa saturationb, Probability (%) Interval, years m3s−1
×106m3 ×106m3 WT:3 m,×106m3 ×106m3
20 5 23 6 4.2 4.2 4.2 4.20
10 10 140 12 27.9 11.8 9.0 11.83
4 25 287 12 53.9 17.9 9.0 13.60
2 50 397 12 76.2 18.0 9.0 13.60
1 100 505 12 97.0 21.3 9.0 13.60
0.2 500 752 12 144.4 22.9 9.0 13.60
given current interest in assessing the response of such rivers to future global change, especially when future climate sce-narios predict reduced runoff, as is the case for dryland re-gions of southern Africa (Milly et al., 2005). Here, we have proposed a multi-source inter-disciplinary approach applied to improve our understanding of flood magnitude/frequency and aquifer recharge in ephemeral river hydrology. Daily discharge and annual flood series (1965–2006) were esti-mated using the TETIS distributed rainfall-runoff hydrologi-cal model (Franc´es et al., 2007) based on hourly and daily rainfall provided by seven rain gauge stations distributed throughout the catchment. The model was calibrated and validated during a two year monitoring programme (2005– 2006) at two stream flow stations, one in the upper catch-ment and one in the lower basin. Significant flood-producing rainfall events were linked to westerly winter frontal sys-tems passing over the catchment for several days, with floods recorded first in the lower basin reflecting the west to east passage of the rainfall. In the upper catchment at Rooifontein the largest monitored flood (May 2006) reached 8 m3s−1
whilst the largest modelled flood gave a simulated peak of 63 m3s−1, the latter flowing for 11 days. At Messelpad in the lower catchment, the same rainfall events generated the largest monitored flood of 20 m3s−1and the largest modelled peak flow of 106 m3s−1, showing a proportional hydrologi-cal response throughout the basin.
The magnitude and frequency of floods in the pre-instrumental period were retrieved from a combination of documentary descriptions at missionary stations, reported by Kelso and Vogel (2007), and from sedimentary evi-dence (slack-water flood deposits) using the methodology of palaeoflood hydrology. The palaeoflood record, with more than 25 floods preserved over the last 700 yr (Benito et al., 2011), was reconstructed based on the assumptions that: (1) floods recorded at multiple sites occurred on the same dates throughout the catchment; and (2) the record is cen-sored, with event preservation dependent on flood water
lev-els exceeding the threshold elevation of previous deposits at sites of deposition.
In terms of flood magnitude, large floods occurred throughout the centennial palaeoflood record. The largest palaeodischarge(s) in the upper catchment reached a mini-mum discharge of 310 m3s−1compared to 510 m3s−1in the lower basin. These palaeofloods were up to five times greater than the largest modelled peak discharges during the 1965– 2006 period. FFA using the combined modelled and palae-oflood discharges, and based on maximum likelihood esti-mators, was successfully fitted to a two-component extreme value distribution. The fitted distribution shows an average return period of ca. 500 and 100 yr for the largest palaeoflood discharges in the upper and lower reaches respectively, whilst the largest simulated discharges are associated with average return period of 10 yr.
The reconstructed flood data were applied to estimate aquifer recharge in the lower basin. Dimensionless hydro-graphs scaled to the probabilistic flood discharge showed that effective recharge is produced by relatively small floods (return periods of 5–10 yr), since floods exceeding ca. 120– 140 m3s−1 and 12 days duration are able to fully saturate the aquifer. As a result flood magnitude plays a limited role in controlling the infiltrated water volume within allu-vial aquifers in these relatively short ephemeral rivers flow-ing over basement rocks. This suggests that the decreasflow-ing runoff predicted for the region under future global warming scenarios (Milly et al., 2005) will not have such a negative impact on the water resource availability from shallow allu-vial aquifers, although more research is needed to predict the impact on water quality and in particular salinity.
Boyce (Buffelsriver) and Penny Price (University of Cape Town) are gratefully thanked for their field assistance. Azucena Chueca kindly drafted Fig. 2 of this paper, and carried the GIS analysis. We are gratefully for the comments of two anonymous reviewers that improved the original manuscript.
Edited by: N. Basu
References
Batjes, N. H.: SOTER-based soil parameter estimates for Southern Africa (ver. 1.0), Report 2004/04, ISRIC – World Soil Informa-tion, Wageningen, 2004.
Benito, G., Rohde, R., Seely, M., K¨ulls, C., Dahan, O., Enzel, Y., Todd, S., Botero, B., Morin, E., Grodek, T., and Roberts, C.: Management of Alluvial Aquifers in Two Southern African Ephemeral Rivers: Implications for IWRM, Wat. Resour. Man-age., 24, 641–667, doi:10.1007/s11269-009-9463-9, 2009. Benito, G., Thorndycraft, V. R., Rico, M. T., S´anchez-Moya, Y.,
Sope˜na, A., Botero, B. A., Machado, M. J., Davis, M., and P´erez-Gonz´alez, A.: Hydrological response of a dryland ephemeral river to southern African climatic variability during the last millennium, Quatern. Res., doi:10.1016/j.yqres.2011.01.004, in press, 2011.
Beran, M., Hosking J. R. M., and Arnell, N.: Comment on “Two-Component Extreme Value Distribution for Flood Fre-quency Analysis” by Fabio Rossi, Mauro Fiorentino and Pasquale Versace, Water Resour. Res., 22(2), 263–266, doi:10.1029/WR022i002p00263, 1986.
Dahan, O., McDonald, E. V., and Young, M. H.: Flexible time do-main reflectometry probe for deep vadose zone monitoring, Va-dose Zone J., 2, 270–275, doi:10.2113/2.2.270, 2003.
Dahan, O., Tatarsky, B., Enzel, Y., K¨ulls, C., Seely, M., and Ben-ito, G.: Dynamics of flood water infiltration and ground wa-ter recharge in hyperarid desert, Ground Wawa-ter, 46, 450–461, doi:10.1111/j.1745-6584.2007.00414.x, 2008.
England Jr., J. F.: Probabilistic extreme flood hydrographs that use paleoflood data for dam safety applications, Flood Hydrology Group, Bureau of Reclamation, Technical Service Center, Den-ver, Colorado, 29 pp., 2003.
Enzel, Y. and Wells, S. G.: Extracting Holocene paleohydrology and paleoclimatology information from modern extreme flood events: An example from southern California, Geomorphology, 19, 203–206, 1997.
Fersch, B.: Interactions between riparian phreatophytes and allu-vial aquifers, Diplomarbeit am Institut fur Hydrologie, Univer-sit¨at Freiburg, Germany, 2007.
Franc´es, F.: Flood frequency analysis using systematic and non-systematic information, in: Systematic, palaeoflood and histori-cal data for the improvement of flood risk estimation, edited by: Benito, G. and Thorndycraft, V. R., CSIC, Madrid, 55–70, 2004. Franc´es, F., Salas, J. D., and Boes, D. C.: Flood frequency anal-ysis with systematic and historical or paleoflood data based on the two-paramater general extreme value models, Water Resour. Res., 30, 1653–1664, 1994.
Franc´es, F., Velez, J. I., and Velez J. J.: Split-parameter structure for the automatic calibration of distributed hydrological models, J. Hydrol., 332, 226–240, doi:10.1016/j.jhydrol.2006.06.032, 2007.
Greenbaum, N., Schwartz, U., Schick, A. P., and Enzel, Y.: Palae-ofloods and the estimation of long-term transmission losses and recharge to the Lower Nahal Zin alluvial aquifer, Negev Desert, Israel, in: Ancient floods, modern hazards: Principles and appli-cations of Paleoflood Hydrology, edited by: House P. K., Webb R. H., Baker V. R., Levish D. R., American Geophysical Union, Washington DC, Water Sci. Appl., 5, 311–328, 2002.
Hoffman, M. T. and Rohde, R. F.: Rivers through time: Histor-ical changes in the riparian vegetation of the semi-arid, winter rainfall region of South Africa in response to climate and land use, J. Hist. Biol., 44(1), 59–80, doi:10.1007/s10739-010-9246-4, 2011.
Hydrologic Engineering Center: HEC-RAS, River Analysis Sys-tem, Hydraulics Reference Manual, CPD-69, US Army Corps of Engineers, Davis, California, 1995.
Kelso, C. and Vogel, C.: The climate of Namaqualand in the nineteenth century, Climatic Change, 83, 357–380, doi:10.1007/s10584-007-9264-1, 2007.
Knighton, A. D. and Nanson, G. C.: Distinctiveness, diversity and uniqueness in arid zone river systems, in: Arid Zone Geomor-phology, edited by: Thomas, D. S. G., Wiley, Chichester, 185– 203, 1997.
Lang, M., Ouarda, T. B. M. J., and Bob´ee, B.: Towards opera-tional guidelines for over-threshold modeling, J. Hydrol., 225, 103–117, 1999.
Marais, J. A. H.: Updated Technical Report on the Spektakel Water Scheme in the District of Springbok, Cape Provincem Unpub-lished report on the O’Okiep Copper Company Limited, South Africa, Nababeep, South Africa, 1981.
Marais, J. A. H., Agenbacht, A. L. D., Prinsloo, M., and Basson, W. A.: The Geology of Sprinbok Area, Explanation: Sheet 2916. Scale 1:250 000, Council for Geoscience, Pretoria, South Africa, 103 pp., 2001.
Matlock, W. G. and Davis, R. P.: Groundwater in the Santa Cruz Valley, Arizona, Technical Bulletin, 194, University of Arizona, Agricultural Experiment Station, Tucson, 37 pp., 1972. Midgley, G. F. and Thuiller, W.: Could anthropogenic climate
change threaten biodiversity in Namaqualand?, J. Arid Environ., 70, 615–628, doi:10.1016/j.jaridenv.2006.11.020, 2007. Midgley, G. F., Chapman, R. A., Hewitson, B., Johnston, P., De
Wit, M., Ziervogel, G., Mukheibir, P., Van Niekerk, L., Tadross, M., Van Wilgen, B.W., Kgope, B., Morant, P., Theron, A., Sc-holes, R. J., and Forsyth, G. G.: A Status Quo, Vulnerability and Adaptation Assessment of the Physical and Socio-Economic Ef-fects of Climate Change in the Western Cape, Report to the West-ern Cape GovWest-ernment, Cape Town, South Africa, Stellenbosch, CSIR, Report No. ENV-S-C 2005-073, 2005.
Milly, P. C. D., Dunne, K. A., and Vecchia, A. V.: Global pattern of trends in streamflow and water availability in a changing climate, Nature, 438, 347–350, doi:10.1038/nature04312, 2005. Morin, E., Grodek, T., Dahan, O., Benito, G., Kulls, C.,
Jacoby, Y., Van Langenhove, G., Seely, M., and Enzel, Y.: Flood routing and alluvial aquifer recharge along the ephemeral arid Kuiseb River, Namibia, J. Hydrol., 368, 262–275, doi:10.1016/j.jhydrol.2009.02.015, 2009.
R. H., Baker V. R., and Levish D. R., American Geophysical Union, Washington DC, Water Sci. Appl. 5, 21–45, 2002. Reid, I., Laronne, J. B., and Powell, D. M.: The Nahal Yatir bedload
database: sediment dynamics in a gravel-bed ephemeral stream, Earth Surf. Process. Landf., 20, 845–857, 1995.
Reynolds, J. F., Smith D. M. S., Lambin E. F., Turner, II, B. L., Mortimore, M., Batterbury, S. P. J., Downing, T. E., Dowlatabadi, H., Fern´andez, R. J., Herrick, J. E., Huber-Sannwald, E., Jiang, H., Leemans, R., Lynam, T., Maestre, F. T., Ayarza, M., and Walker, B.: Global Desertification: Build-ing a Science for Dryland Development, Science, 316, 847–851, doi:10.1126/science.1131634, 2007.
Rimon, Y., Dahan, O., Nativ, R., and Geyer, S.: Water percolation through the deep vadose zone and groundwater recharge: pre-liminary results based on a new vadose zone monitoring system, Water Resour. Res., 3, W05402, doi:10.1029/2006WR004855, 2007.
Rohde, R., Hoffman, T., Waldeck, D., and Boyce, A. M.: Flood Events in the Buffels River – an internal WADE Report, Un-published, Institute for Plant Conservation, University of Cape Town, Rondebosch, South Africa, 5 pp. 2005.
Seely, M. K., Buskirk, W. H., Hamilton, W. J. I., and Dixon, J. E. W.: Lower Kuiseb River perennial vegetation survey, Journal of the South West Africa Scientific Society, 35, 57–86, 1981. Shentsis, I. and Rosenthal, E.: Recharge of aquifers by flood
events in an arid region, Hydrol. Process., 17, 695–712, doi:10.1002/hyp.1160, 2003.
Stedinger, J. R. and Cohn, T. A.: Flood frequency analysis with historical and paleoflood information, Water Resour. Res., 22, 785–793, 1986.