Rainfall-Runoff Modelling using Modified NRCS-CN,RS and GIS
-A Case Study
P.Sundara Kumar*, T.V.Praveen**, M.A.Prasad***
*(Research scholar, Andhra University, Associate Professor, Department of Civil Engineering K.L.University, Guntur Dist, A.P- India)
** (Professor, Department of Civil Engineering, Andhra University, Vishakhapatnam, India)
*** (Professor, Department of Civil Engineering, Osmania University, Hyderabad, India)
ABSTRACT
Study of rainfall and runoff for any area and modeling it, is one of the important aspects for planning and development of water resources. The development of water resources and its effective management plays a vital role in development of any country more particularly in India, which is an agricultural based economy. Hence it is intended to develop a model of Rainfall and runoff to a river basin and also apply the methodology to Sarada River Basin which has drainage area of 1252.99 Sq.km. The basin is situated in Vishakhapatnam district of Andhra Pradesh, India. The rainfall and runoff data has been collected from the gauging stations of the basin apart from rainfall data from nearby stations. MNRCS-CN method has been adopted to calculate runoff. Various hydrological parameters like soil information, rainfall, land use and land cover (LU/LC) were considered to use in MNRCS-CN method. The depth of runoff has been computed for different land use patterns using, IRS-P4-LISS IV data for the study area. Based on the analysis, land use/land cover pattern of Sarada River Basin has been prepared. The land use/land cover patterns were also visually interpreted and digitized using ERDAS IMAGINE software. The raster data was processed in ERDAS and geo-referenced and various maps viz. LU/LC maps, drainage map, contour map, DEM (Digital elevation model) have been generated apart from rainfall potential map using GIS tool. The estimated runoff using MNRCS-CN model has been simulated and compared with that of actual runoff. The performance of the model is found to be good for the data considered. The coefficient of determination R2 value for the observed runoff and that of the computed runoff is found to be more than 0.72 for the selected watershed basin.
Keywords
-Watershed, Land use/Land cover, MNRCS, Rainfall-Runoff Modelling, DEM,RS and GIS.I.
INTRODUCTION
The USDA Soil Conservation Service curve number (SCS-CN) method has been widely accepted world over for its simplicity in application for rainfall and runoff modelling. It was reported that the concept of curve number has originated from the unit hydrograph theory. The unit hydrograph approach always requires a method for predicting rainfall contribution to the storm runoff. The SCS-CN method arose out of the empirical analysis of runoff particularly from small catchments and also suitable for hilly slope areas as per observations monitored by the USDA [9]. Geographic Information Systems (GIS) has been applied widely in hydrologic modeling in recent studies. The runoff estimated when compared with that of GIS tool indicated that the GIS method is providing satisfactory results and also as an alternative to the manual method of computation. Stuebe, Johnston [8] and Grove et al[3]. Runoff depth estimates using distributed CN are reported to be giving better result when compared with that of composite CN. It was reported that underestimation of runoff depth by CN method may be primarily due to nonlinear relationship between
CN and runoff depth and also when precipitation depths are low and lower ranges of curve numbers. The error in estimation of runoff when design storms are larger and also when distributed CNs are adopted is relatively less. Narayana. V. D. et al. [1], has proposed CNfor estimation of runoff values for four Indian watersheds by assuming initial abstraction as 0.3 times as maximum potential retention and he has reported that estimated value was in close agreement with that of observed value. Moglen[6], Mishra, S.K., Singh, V.P[5] used the US Department of Agriculture, Natural Resources Conservation Service Curve Number (USDA-NRCS-CN) method for determining the runoff depth successfully. They have adopted runoff curve number which was determined based on the factors of hydrologic soil group, land use, land treatment, and hydrologic conditions. GIS and remote sensing were used to provide quantitative measurements of drainage basin morphology for input into runoff models so as to estimate runoff response (Hjelmfelt. A. T. Jr[2], Moglen [6], Melesse and Shih [4]. The results provided as a means that GIS can be effectively used as an alternative to conventional methods. They have also attempted to derive the weighted Curve Number (CN) and runoff
for the watershed. Their study concluded that by adopting an integrated approach of RS, GIS and SCS model it is possible to make management plans for usage and development of water resources. Mishra and Singh modified the existing NRCS-CN method by taking 0.5(P-Ia) in place of (P-Ia). The existing NRCS-CN method and the proposed modifications were compared and the modified version was found to be more accurate than the existing NRCS-CN method. The objectives of the present study are to calculate daily runoff using NRCS and MNRCS-CN and also to create runoff potential map for Sarada River Basin using GIS. It is also intended to develop land use and land cover map for the area using RS and GIS Arc Info-software.
II.
STUDY AREA
Considering the availability of meteorological, hydrological, soil and other data, the present study has been undertaken on Sarada River Basin. This site is located in Vishakhapatnam district of Andhra Pradesh state in India. The Sarada River Basin is
located within 82013’0” E & 83005’0” longitude and 170 25’ 0” & 180 17’ 0” N and latitude. The total
area of the study basin is around 1252.99 km2. This river basin forms a part of Survey of India (SOI) sheets Nos. 65 O/1, 2, 3 and 6 and 65 K/13, 14 and 15 the scale of 1:50000. The Index map of the study area is shown in Fig. 1. After the reconnaissance survey, the watersheds were delineated on the basis of drainage line, land slope and outlet point. Furthermore, on the basis of drainage channels and land topography, the river basin is subdivided into five sub basin Viz., K.Kotapadu, Madugula, Chodavaram, Kasimkota and Anakapalli.
Fig.1: Index Map of the Study Area
III.
MATERIALS AND METHODS
Soil Conservation Service Curve Number (SCS-CN) Method
Soil Conservation Service method is one of the widely used techniques for estimating direct runoff depths from storm rainfall developed by United States Department of Agriculture (USDA) Soil
Conservation Service’s (SCS), now is referred as
Natural Resources Conservation Service, (NRCS) Curve Number (CN) method. The U.S. SCS agency has studied on number of watersheds of varying in size; land use and land cover and the following relationships as given in equation 1 as per Soil Conservation Service [7].
Q = P−Ia 2
P−Ia+ S (1) Where, Q is the direct runoff (mm), P is the depth of rainfall (mm), Iais the initial subtraction (mm) andS is the retention parameter (mm).
The initial abstraction (Ia) mainly includes interception, infiltration, and surface storage, which occurs before runoff begins. By using rainfall and runoff data from small experimental watersheds, the following relationship was developed US. Soil Conservation Service [7].
Ia =λS (2)
where, Iais Initial abstraction (mm),S is Potential maximum retention or infiltration (mm)
λ is a coefficient which indicates the amount of
storage available in the soil. It is a function of antecedent moisture condition.
Substituting Equation 2 in Equation 1 yields the following relationship
Q = P−0.2S 2
P + 0.8S (for P > 0.2 (3)
where Q = 0 for P≤ 0.2S
The potential maximum retention storage S of watershed is related to a CN, which is a function of land use, land treatments, soil type and antecedent moisture condition of watershed. The CN is dimensionless and its value varies from 0 to 100. The S-value in mm can be obtained from CN by using the equation 4.
S =25400
CN −254 (4) where, CN is the curve number which depends upon land use, hydrologic soil group. Narayana [1]
recommended λ equal to 0.3 for most of the regions
in India except for the regions having black soils
where λ is 0.1.
Modification of NRCS-CN Method
Estimation of Runoff using MNRCS-CN relationship developed by Mishra and Singh [5] Q
P= P
S +1 2P
(5)
In general, Equation (5) can be written as Q
P= P
S + aP (6)
where ‘a’ is a coefficient replacing 1
2 in Equation (5) Land Use/ Land Cover Classification
geometrically corrected with respect to rectified topo sheet. The classified images of Sarada River Basin are presented in Fig.2. The Sarada River Basin comprises of eight different types of LU/LC. However, the major land use is agriculture (64.72%) followed by Plantation (19.44%). Other LU/LCs comprising of water bodies, barren land, reserve forest, hilly areas, aquaculture and settlement account for about 16% of the total area of the watershed. The basin has 5.51 % barren land, 4.55 % hilly areas, 1.58% reserved forest, 0.82 % water tanks and aquaculture is also present in that area (0.26 %). In Sarada river basin 3.12 % area is covered by settlement.
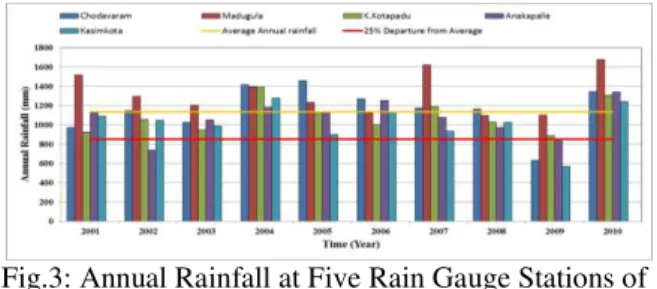
Spatial and Temporal Variation in Rainfall Daily rainfall data has been collected from six rain gauge stations of Sarada river basin for a period of 2001-2010. Graphically these data were represented as plots of magnitude vs chronological time in the form of a bar diagram as shown in Fig.3.
Fig.2: LU/ LC Classification
It was observed from the Fig. 3, that rainfall varies with respect to space and time in the Sarada River Basin to an extent of 800 mm to 1100 mm per year. Based on the data analysis of rainfalls time period in the area and which has provided the information of average annual rainfall of that time period, information of wet years, dry years and normal years have been classified. The years which were above than average annual rainfall can be classified as wet years. 25% departure from the average annual rainfall was also calculated and presented as another bar diagram, as horizontal line shown in Figure 3. The years which were below than 25% departure from the average annual rainfall are classified under dry years. The years which were in between average annual rainfall and 25% departure from the average annual rainfall were classified as normal years. Based on the analysis of rainfalls (2001-2010) in the study area, the year 2010 was characterized as the ‘wet year’ because all the six station has a rainfall above than average annual
rainfall, the year 2009 as the ‘dry year’ because the
rainfall at most of the station was below 25% departure from the average annual rainfall and the year 2004 as the ‘normal year’ because rainfall at five stations were more than average annual rainfall, only one station has rainfall less than average annual
rainfall but more than 25% departure from the average annual rainfall. All other years have been classified as below normal since all the gauging stations were not contributing completely for the annual rain fall values.
Estimation of Mean Rainfall over the Basin The daily rainfall data for raining months of the year was used to estimate daily runoff. The 10 years (2001-2010) daily rainfall data of five rain gauge stations have been utilized to estimate runoff. The rain gauge represent only point sampling of the areal distribution of rainfall but rainfall over the catchment is never uniform.Therefore to identify which rain gauge stations contribute to mean annual rainfall over the entire Sarada River Basin, Theissen polygon method was used.
Fig.3: Annual Rainfall at Five Rain Gauge Stations of Sarada River Basin
The Arc-GIS software has been used to develop polygons and to calculate the area of polygons for better accuracy. The Theissen weightage for each rain-gauge station was calculated and used to calculate mean areal rainfall over the area. The statistic of Theissen polygon of Sarada River Basin is presented in Table 2, it was observed that K.Kotapadu rain-gauge station has most influence in the basin followed by Chodavaram. The rain-gauge station Kotapadu has least influence in the basin. Theissen polygon map of Sarada river basin is shown in Fig. 4.
Fig. 4: Theissen polygon for the study area
Table 2: Theissen polygon statistics
S. No. Stations Name Area - Km2 Weightage Factor
1 Chodavaram 346.6 0.276
2 Madugula 88.54 0.07
3 K.Kotapadu 379.1 0.302
4 Anakapalli 243.24 0.194
Curve Number Map
Curve number is one of the major governing factors that predominantly affect the runoff amount that flows over the land after satisfying all losses. Although the curve number itself having no physical meaning but it plays an important role in defining hydrological response of catchment. Zero curve number describes the hydrological response only with infiltration. All the rainfall water will infiltrate to become subsurface flow. When the Curve Number is 100 it describes the hydrological responses with no infiltration. All the rainfall water will flow as surface flow as soil is in saturation limit that happens in continuous rainfall events. As soon as CN has increased, the runoff from that watershed will also increase. The CN is derived from Land use/Land cover classification and hydrological soil group, the land use coverage and soil coverage were merged using Arc-GIS software. Using Arc-GIS software total of 78 polygons has been developed. All these polygons were having a particular land use and hydrologic soil group and then curve numbers were assigned to these polygons. Thus a curve number coverage has been generated such that different polygons will have different curve number values. The pictorial presentation of CN for different areas is presented in spatial distribution of Curve Number for Sarada River Basin is presented Fig.5.
Fig.5: Spatial distribution of CN
Distributed CN Technique
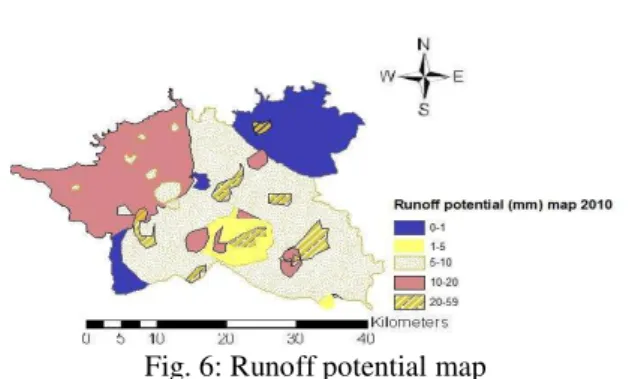
The distributed CN technique has been used to estimate runoff for Sarada River Basin. The initial abstraction (Ia) of 0.3S was used, where S is the maximum potential retention. The CN value for each polygon was used to calculate maximum potential retention S for each polygon by using Equation 4. Then runoff of each polygon was estimated with the help of Equation 1. Therefore, runoff for 78 polygons were estimated for each day rainfall and then summed up to get the total daily runoff from the Sarada River Basin. The daily runoff of all raining months is estimated for 10 year period using daily rainfall data of these months. The runoff potential map derived is shown in Fig.6.
Fig. 6: Runoff potential map
Model Performance and Analysis
To achieve the stated objectives, daily precipitation and runoff data for a period of ten years, soil data, topographic maps and satellite imagery data have been collected for the study area. ERDAS IMAGINE 8.5 and Arc-GIS 9.2 software packages were used for analyzing the data. The Survey of India topo sheets covering the study area were scanned, rectified and digitized for elevation contours, drainage network, and prominent land cover using Arc-GIS software. The IRS satellite images for the year 2010 was classified using supervised classification (after several ground truth verifications) with maximum likelihood classification algorithm in ERDAS IMAGINE software.
Data analysis
The selected basin performance has been evaluated with three performance measures to evaluate the model performance. The performance measures are Nash-Sutcliffe coefficient efficiency (ENS), root mean square error (RMSE) and coefficient
of determination (R2).
(i) Nash-Sutcliffe coefficient efficiency (ENS): It is
expressed as
ENS = 1− oi−pi 2 n
i=1
oni=1 i−oi 2
× 100 (7)
where, oi and pi are the observed and predicted value,oi is the mean of the observed flow; n is the
number of data points. The value of ENS varies between -∞ to 1. The closer the value is to 1, the better the model performance.
(ii) Root mean square error (RMSE): It is expressed as
RMSE = 1
n oi−pi 2 n
i=1
(8)
(iii) Coefficient of determination: It is expressed as
R2= oi− oi pi− pi n
i=0
oi− oi 2 ni=0 pi− pi 2 2
(9)
IV.
RESULTS AND DISCUSSIONS
The distributed CN technique was used to estimate runoff in the study area. The CN value for each polygon is used to calculate maximum potential retention S for each polygon as per Equation (4). The runoff of each polygon thus has been estimated with the help of Equation (3) and Equation (5). Therefore, runoff from the 78 polygons has been estimated as per daily rainfall data cumulated to get the total daily runoff from the study river basin. It is observed from the Table.3 that the predicted runoff by MNRCS-CN model showed acceptable variation of trend when compared with the observed runoff with certain deviation during validation phase is presented in Fig.7. The value of coefficient of determination (R2) is found to be 0.72. It is also observed that MNRCS-CN has resulted in Nash Sutcliffe efficiency (ENS) of 70.01%. The higher coefficient of determination values indicates good relationship between the observed and predicted daily runoff by the selected model. So, it can be suggested that MNRCS-CN can be used for estimation of runoff for this ungauged basin. The model has been successfully applied for longer duration analysis and computation of annual runoff depth.Table 3: Statistics for the Observed and Predicted Runoff for the Study Area
MODEL ENS RMSE R2
MNRCS-CN 70.01 20.16 0.72
V.
CONCLUSIONS
A rain fall runoff model has been successfully developed for a Sarada River Basin in Andhra Pradesh. It is based on the hydrological soil group, Land use/Land cover and daily rainfall data daily runoff depth which were estimated by MNRCS-CN method using distributed CN technique. In the present study, GIS based MNRCS-CN model is used for the estimation of un-gauged runoff in the Sarada River Basin, Vishakhapatnam District, Andhra Pradesh, India. The coefficient of determination indicates good performance of model with that of simulation model for runoff proves the performance of the model. The present model could be used as means to estimate runoff depth in the study area and also develop runoff potential map.
REFERENCES
[1] Narayana. V. D, Soil and Water Conservation Research in India, Indian Council of Agricultural Research, KrishiAnusandhanBhavan, Pusa, New Delhi, 1993, 146-151.
[2] Hjelmfelt. A. T. Jr, Investigation of curve number procedure. Journal of Hydrologic Engineering”, ASCE, 117(.6), 1991, 725-737.
[3] Grove. M., Harbor, J. and Engel, B, Composited Vs. distributed curve numbers: effects on estimates of storm runoff depths,Journal of the American Water Resources Association (JAWRA),34(5), 1998, 1015-1023.
[4] Melesse, A.M. and Shih, S.F, Spatially distributed storm runoff depth estimation using landsat images and GIS. Computers and Electronics in Agriculture, 37(1), 2002, 173-183.
[5] Mishra, S.K., Singh, V.P, Another Look at SCS-CN Method, Journal of Hydrologic Engineering, 4(3), 1999, 257-264. [6] Moglen, G.E, Effect of orientation of
spatially distributed curve numbers in runoff calculations. Journal of the American Water Resources Association, 36(6), 200, 1391-1400.
[7] Soil Conservation Service, Hydrology. Chapter 9, Hydrologic soil cover complex, Soil Conservation Service, National Engineering Handbook, Washington D.C., U.S. Department of Agriculture, (1972), Section -4.
[8] Stuebe. M.M., and Johnston, D.M, Runoff volume estimation using GIS techniques,Water Resources Bulletin,26(4), 1990, 611-620.
[9] United States Department of Agriculture, Soil Conservation Service. National Engineering Handbook. Section 4, Hydrology, Washington, D.C. 1985.