ABSTRACT: The harvesting system of green sugarcane, characterized by mechanized harvesting and no crop burning, affects soil quality by increasing the remaining straw left on the soil surface after harvesting, thus, contributing to the improvement of physical, chemical, and microbiologi-cal soil attributes, influencing CO2 fluxes. This study aimed to evaluate CO2 fluxes and their rela-tion to soil properties in sugarcane crops under different harvesting managements: burned (B), Green harvesting for 5 years (G-5) and Green harvesting for ten years (G-10). For this, a 1 ha sampling grid with 30 points was installed in each area, all located in the Northeast of São Paulo State, Brazil. In each point, CO2 fluxes were measured and the soil was sampled to analyze the microbial biomass, physical (soil moisture and temperature, mean weight diameter, bulk den-sity, clay, macroporosity and microporosity) and chemical characterization (pH, organic C, base saturation and P). The CO2 fluxes were divided into four quantitative criteria: high, moderate, low and very low from the Statistical Division (mean, first quartile, median and third quartile) and the other data were classified according this criterion. The Principal Component Analysis (PCA) was used to identify the main soil attributes that influence CO2 fluxes. The results showed that G-10 CO2 fluxes were 28 and 41 % higher than those in the G-5 and B treatments, respectively. The PCA analysis showed that macroporosity was the main soil attribute that influenced the high CO2 fluxes.
Keywords: Sacharum officinarum, principal component analysis, porosity, biomass 1University of Campinas/FEAGRI – Dept. of Soils, Av. Cândido
Rondon, 501 − 13083-875 − Campinas, SP − Brazil. 2São Paulo State University/FCAV, Via de Acesso Prof. Paulo Donato Castellane, s/n − 14884-900 − Jaboticabal, SP − Brazil.
3São Paulo State University/FEIS, Al. Rio de Janeiro, 266 − 15385-000 − Ilha Solteira, SP − Brazil.
*Corresponding author <[email protected]>
Edited by: Carlos Eduardo Pellegrino Cerri
Soil management of sugarcane fields affecting CO
2fluxes
Rose Luiza Moraes Tavares1*, Diego Silva Siqueira2, Alan Rodrigo Panosso3, Guilherme Adalberto Ferreira Castioni1, Zigomar
Menezes de Souza1, Newton La Scala Jr.2
Received April 23, 2015 Accepted December 21, 2015
Introduction
The practice of burning sugarcane residues prior to harvesting aims to facilitate manual cutting, but the temperature during sugarcane burning is around 160-200 °C on the soil surface, causing nutrients loss by vola-tilization such as phosphorus, sulfur and nitrogen (Ball et al., 1993) and may lead to a great decline in soil C stocks (Song et al., 2013). The “harvesting of green sug-arcane” is a system without burning that leaves biomass waste in the field after harvesting, positively influencing soil quality by increasing the deposited residual straw (mean 10 to 30 Mg ha−1) allowing carbon accumulation in the soil, which implies in a positive CO2 balance as described by Razafimbelo et al. (2006).
Soil CO2 fluxes from areas of sugarcane cultivation were studied by Brito et al. (2009) that found greater fluxes in areas with greater soil macroporosity. Panosso et al. (2009) compared the soil CO2 in pre-harvesting burned crop with a green harvesting system and found that soil cations were the main soil attribute to explain the CO2 fluxes mainly in the burned area.
Soil CO2 fluxes result from physical and biologi-cal processes that affect CO2 production and transport from the soil to the atmosphere. In addition, produc-tion is related to root respiraproduc-tion and the acproduc-tion of mi-croorganisms during OM decomposition (Jenkinson and Ladd, 1981; Brito et al., 2009). Transport of soil gases is influenced by the physical structure parameters, such as porosity, which drive the gas flow. Saturation of soil pores also determines CO2 fluxes. According to the litera-ture, the main soil attributes that influence CO2 fluxes
include temperature and content of soil water (Xu and Qi, 2001; Epron et al., 2004, 2006; Kosugi et al., 2007; La Scala et al., 2010; Leon et al., 2014), attributes with great influence on microbial activities that promote soil respiration.
The principal component analysis (PCA) of CO2 fluxes (Panosso et al., 2012) showed that water filled pore space, and total porosity and macroporosity were the main components to explain the variance of CO2 fluxes. Another study, about soil CO2 efflux in a water limited ecosystem (Leon et al., 2014), showed that the most im-portant attributes were root biomass, soil volumetric wa-ter content and total porosity.
Mitigating CO2 fluxes in sugarcane cultivation still requires further studies aiming to assess their viabil-ity and enhancing their applicabilviabil-ity for environmental purposes. More specifically, there is a need to study the main factors responsible for high soil CO2 fluxes, which can assist in the challenge of achieving stability of soil carbon through improved decision-making manage-ments. This study aimed to evaluate CO2 fluxes and their relation to soil properties in sugarcane areas under dif-ferent harvesting managements.
Materials and Methods
Experimental site
(Figure 1). The soil was classified as Haplustox (USDA Soil Taxonomy) (Latossolo Vermelho Eutroférrico, ac-cording to Brazilian Soil Classification System) with a clayey texture (561 g kg−1 to B, 517 g kg−1 to G-5 and 531 g kg−1 to G-10), and the topography of the area is flat and undulating. The regional climate is classi-fied as B2rB’4a’ by the Thornthwaite system (Rolim et al., 2007), indicating a mesothermal region with rainy summers and dry winters. The average precipitation is 1425 mm yr−1 and is concentrated between Oct and Mar. The average annual temperature over the last 30 years was 22.2 oC.
In 2011, three plots were chosen in areas with different systems and management times (Figure 1): the burned sugarcane (B) area has been managed un-der residue burning since the 1980s and the other areas were harvested under the green sugarcane system (G) with different starting times of green sugarcane adop-tion [5 years (G-5) that started in 2006 and another area with ten years (G-10) that started in 2001]. At the time of renewing the plantations, which occurred in every six ratoons in B and in G-10 in 2007) with mechanical removal of the ratoon of the previous crop and sub-soiling to 0.45 m deep in the planting furrows. After-ward, 2 t ha−1 of dolomitic limestone and 480 kg ha−1
of NPK fertilizer at 10-25-20 formulation were also ap-plied. On average, 100 m3 ha−1 of vinasse (by-product of biomass distillation of the sugarcane fuel industry) and 300 kg ha−1 of urea or 200 kg ha−1 of ammonium nitrate were applied to the areas after 5-7 months of the first fertilization.
In 2011-2012 (experimental evaluation period), treatment B with the sugarcane variety CTC4 (average maturity and high agricultural productivity) was in in its 5th ratoon with average yield of 67 t ha−1. Treatment G-5 with the planted variety RB85 5453 (early maturity, erect growth, high productivity with no limitation of soil water) was in its 4th ratoon with average yield of 80 t ha−1. Treatment G-10 with the sugarcane variety CTC 20 (early maturity, high tillering and high produc-tivity along the cuts) was in its 5th ratoon with an aver-age yield of 75 t ha−1. In this experiment, no manure or fertilizers were applied between the years 2010 and 2011 (before and during the field experiment) to con-trol interferences of these factors on the CO2 fluxes. In each area, a sampling irregular grid of 1 ha was in-stalled with 30 sampling points spaced at intervals with minimum of 2 m and maximum of 100 m. All points were georeferenced with the aid of a total station and a DGPS (Model L1/L2 Hiper Lite Plus).
Measurement of CO2 fluxes
Measurements of soil CO2 fluxes were simulta-neously performed in the three sugarcane areas in the same period (10 d in Aug-Sept 2011) and on the same day time (7:00-11:00 a.m.) after harvesting, for standard-ization. For that, three portable systems (1 system/area) were used to monitor the changes in CO2 concentration inside the chamber using an infrared gas analyzer. The soil chamber has an internal volume of 854.2 cm3 with a circular soil contact area at the base of 83.7 cm2, which was placed on PVC collars previously inserted at each sampling point to 3 cm deep keeping is distant from the ratoon plant (approximately 30 cm) to decrease its influ-ence on the CO2 fluxes. Once the chamber is set to the measurement mode, it takes around 1.5 min to run the time-change interpolation of CO2 concentration inside the chamber. The chambers were previously calibrated for this work.
Soil temperature (Ts) and soil water content (Ms) were measured simultaneously with CO2 concentration through a temperature sensor coupled with the system, and Ms was registered with a portable Hydrosense sys-tem.
Soil sampling and evaluation
For the microbial biomass (Biom) analysis, soil samples were collected at each point in the grid on the same day and time of CO2 measurement, but only for 2 d of each collection period (the first and last day of CO2 measurement) due to the large number of samples to be analyzed in 30 d (recommendation for the micro-biological analysis). In the field, samples were kept in plastic bags inside Styrofoam boxes and transferred im-mediately to a refrigerator at 4 °C. The biomass analysis was performed according to the fumigation-extraction method proposed by Jenkinson and Powlson (1976).
For the other soil analysis, the samples were col-lected once at each point before the CO2 analysis. Dis-turbed soil samples were collected from the first 20 cm of soil to evaluate organic carbon (C) (Nelson and Som-mers, 1982), pH in CaCl2 and phosphorus (P) by resin procedure (Raij et al., 2001), clay and mean weight di-ameter of soil aggregates (MWD).
Samples were exposed to air for 24 h, kept moist for aggregate preservation and then placed on a sieve set of 6.35 and 2 mm mesh diameter. Aggregates were ob-tained from samples reob-tained by the 2 mm mesh, where-as those that pwhere-assed through were again exposed to air until constant weight was achieved. Undisturbed soil
samples were collected with aluminum rings and used to analyze macroporosity (Ma), microporosity (Mi) and bulk density (Bd). These physical analyses were carried out according to Brazilian Agricultural Research Corpo-ration methodologies – Embrapa (1997).
Statistical analyses
Mean daily CO2 fluxes were evaluated by the t test for comparison between management areas (p < 0.05), using the program Minitab 14. These values were inte-grated to calculate the CO2 accumulated during 10 d.
Quantitative criteria of CO2 fluxes were defined by the distribution of CO2 data in each area (Table 1), defined as: very low (VL) fluxes, which included values lower than the first quartile (Q1); low fluxes (L), between Q1 and median values; moderate (M) fluxes, between me-dian and third quartile (Q3); and high (H) fluxes, values greater than Q3.
This criterion was used to identify the influence of soil attributes on different CO2 concentrations, mainly by high fluxes and if the amount of soil attributes fol-lowed the same trend of CO2 criterion. When the values were different for the three sugarcane systems, discus-sion was made separately for each area.
The multivariate structure in the original data set was evaluated by the PCA that condensed the relevant information into a smaller set of orthogonal latent vari-ables called principal components (PC-eigenvectors). Each pair of principal components (PCs) generates a two-dimensional representation of the original sample space, known as a biplot. The biplot explains the struc-ture of variables directing beams of variable regions of maximum variability. In this work, we considered the principal components whose eigenvalues were greater than a unity (Kaiser, 1958). The sign and relative size of the linear function coefficients, which define the PC scores were used as an indication of the weight to be assigned to each variable in the different experimental plots (Johnson and Wichern, 2002). The correlation be-tween soil attributes with PCs to explain the manage-ment types were compared with the mean values of soil CO2 fluxes.
Results and Discussion
CO2 total fluxes
Considering the CO2 total fluxes, G-10 showed higher values (mean 2.71 µmol CO2 m−2 s−1), represent-ing a significant difference (p < 0.05) of 28 % compared
Table 1 − Summary of soil CO2 flux (µmol m−2 s−1) distribution statistics of burned and green cane areas.
Area Mean Variance Minimum Q1 Median Q3 Maximum K-S
B 1.58 b 0.21 0.54 1.37 1.62 1.85 2.47 0.10
G-5 1.93 b 0.34 1.06 1.56 1.78 2.34 3.32 0.12
G-10 2.71 a 0.91 1.12 2.12 2.39 3.21 4.76 0.14
with G-5 (1.93 µmol CO2 m−2 s−1) and 41 % compared with B (1.58 µmol CO2 m−2 s−1) (Table 1). The G-5 and B did show statistical difference, the G-5 area is in a transition stage, considering the recent conversion to the green sugarcane system. This effect can be seen in Fig-ure 2 that shows the CO2 total emission accumulation in the three management systems.
Most CO2 fluxes in G-10 may be associated with greater microbial activity in areas with major plant resi-due deposition on soil surface. Minimum soil tillage, like the green sugarcane management, provides favorable conditions for the development of microorganisms in the soil surface layer, which increases microbial biomass and CO2 production (Matias et al., 2009).
Biom results showed similar trends of fluxes in the three experimental areas (Table 2), with higher values of Biom falling in the high and moderate CO2 flux groups and lower values in the low and very low CO2 flux groups. This indicates a direct participation of the microbial biomass in CO2 production during soil organic matter (SOM) decomposition (Jenkinson and Ladd, 1981). How-ever, this process is not always favorable for storing soil carbon, and for some authors, the reduction in SOM can be a result of CO2 fluxes (Cerri et al., 2007).
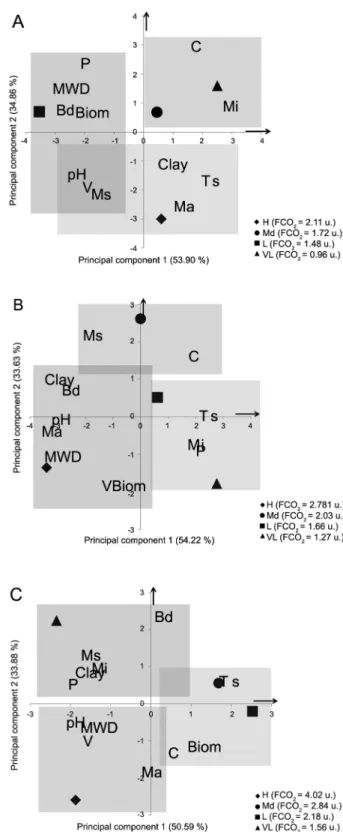
The physical and chemical soil attributes showed no clear relation with the different groups of CO2 fluxes, with the exception of macro- and microporosity, where macroporosity was the soil attribute of high frequency in all three areas, mainly to explain the high CO2 fluxes group (Figures 3A, B, C). This can be attributed to gas transport in the soil, because according to Fick's gas dif-fusion Law, macroporosity provides better conductivity for the CO2 molecule in the soil, facilitating gas fluxes (Alvenäs and Jansson, 1997; Brito et al., 2009). In turn, microporosity provides a more irregular path hindering CO2 fluxes in the soil. Thus, G-10 presented greater mac-roporosity than B and G-5 (Table 2), meaning that despite greater bulk density in G-10 due the mechanized traffic, soil porosity did not impair the fluxes compared to B and this aspect can be attributed to the straw left on the soil that promotes more soil aggregation and porosity.
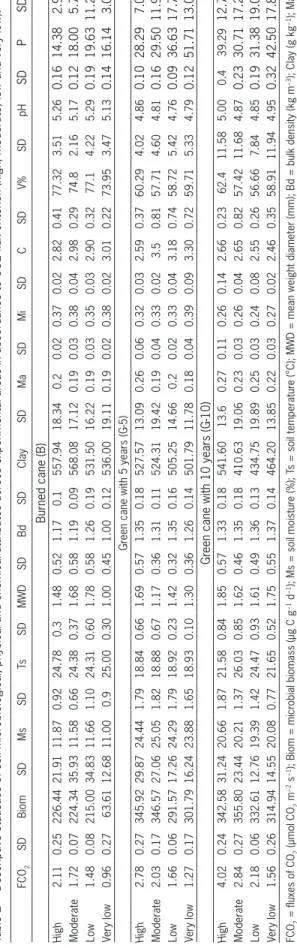
Table 2 − Descriptive statistics of soil micr
obiological, physical and chemical attributes acr
oss experimental ar
eas in accor
dance to CO2 flux criterion (high, moderate, low and very low).
FCO 2 SD Biom SD Ms SD Ts SD MWD SD Bd SD Clay SD Ma SD Mi SD C SD V% SD pH SD P SD
Burned cane (B)
High 2.11 0.25 226.44 21.91 11.87 0.92 24.78 0.3 1.48 0.52 1.17 0.1 557.94 18.34 0.2 0.02 0.37 0.02 2.82 0.41 77.32 3.51 5.26 0.16 14.38 2.92 Moderate 1.72 0.07 224.34 35.93 11.58 0.66 24.38 0.37 1.68 0.58 1.19 0.09 568.08 17.12 0.19 0.03 0.38 0.04 2.98 0.29 74.8 2.16 5.17 0.12 18.00 5.73 Low 1.48 0.08 215.00 34.83 11.66 1.10 24.31 0.60 1.78 0.58 1.26 0.19 531.50 16.22 0.19 0.03 0.35 0.03 2.90 0.32 77.1 4.22 5.29 0.19 19.63 11.24 V ery low 0.96 0.27 63.61 12.68 11.00 0.9 25.00 0.30 1.00 0.45 1.00 0.12 536.00 19.11 0.19 0.02 0.38 0.02 3.01 0.22 73.95 3.47 5.13 0.14 16.14 3.02 Gr
een cane with 5 years (G-5)
High 2.78 0.27 345.92 29.87 24.44 1.79 18.84 0.66 1.69 0.57 1.35 0.18 527.57 13.09 0.26 0.06 0.32 0.03 2.59 0.37 60.29 4.02 4.86 0.10 28.29 7.06 Moderate 2.03 0.17 346.57 27.06 25.05 1.82 18.88 0.67 1.17 0.36 1.31 0.11 524.31 19.42 0.19 0.04 0.33 0.02 3.5 0.81 57.71 4.60 4.81 0.16 29.50 11.95 Low 1.66 0.06 291.57 17.26 24.29 1.79 18.92 0.23 1.42 0.32 1.35 0.16 505.25 14.66 0.2 0.02 0.33 0.04 3.18 0.74 58.72 5.42 4.76 0.09 36.63 17.74 V ery low 1.27 0.17 301.79 16.24 23.88 1.65 18.93 0.10 1.30 0.36 1.26 0.14 501.79 11.78 0.18 0.04 0.39 0.09 3.30 0.72 59.71 5.33 4.79 0.12 51.71 13.07 Gr
een cane with 10 years (G-10)
High 4.02 0.24 342.58 31.24 20.66 1.87 21.58 0.84 1.85 0.57 1.33 0.18 541.60 13.6 0.27 0.11 0.26 0.14 2.66 0.23 62.4 11.58 5.00 0.4 39.29 12.76 Moderate 2.84 0.27 355.80 23.44 20.21 1.37 26.03 0.85 1.62 0.46 1.35 0.18 410.63 19.06 0.23 0.03 0.26 0.04 2.65 0.82 57.42 11.68 4.87 0.23 30.71 17.23 Low 2.18 0.06 332.61 12.76 19.39 1.42 24.47 0.93 1.61 0.49 1.36 0.13 434.75 19.89 0.25 0.03 0.24 0.08 2.55 0.26 56.66 7.84 4.85 0.19 31.38 19.09 V ery low 1.56 0.26 314.94 14.55 20.08 0.77 21.65 0.52 1.75 0.55 1.37 0.14 464.20 13.85 0.22 0.03 0.27 0.02 2.46 0.35 58.91 11.94 4.95 0.32 42.50 17.88 FCO 2
= fluxes of CO
2 (µmol CO 2 m −2 s −1
); Biom = micr
obial biomass (µg C g
−1
d
−1
); Ms = soil moistur
e (%); T
s = soil temperatur
e (°C); MWD = mean weight diameter (mm); Bd = bulk density (kg m
−3
); Clay (g kg
−1
); Ma =
macr
opor
osity (m
3 m
−3
); Mi = micr
opor
osity (m
3 m
−3
); C = or
ganic carbon (g kg
−1
); V% = base saturation; P = phosphorus (mg dm
−3
); SD = Standar
d deviation.
Figure 2 − Accumulated soil CO2 emission on soil during Aug-Sept
The PCA results showed that the first two princi-pal components, PC1 and PC2, explained respectively 50 and 30 % of the variance for all areas and jointly was responsible for more than 80 % of the variance. A similar result was found in a study by Panosso et al. (2011) on CO2 fluxes, where the PCs together explained 70 % of the variability of soil attributes (physical and chemical), with PC1 explaining 52 % and PC2, 18 %. This means that the soil attributes included in the two principal components are sufficient to explain the CO2 flux variations in the soil. This is because the soil attri-butes used in this study promote the CO2 flux, such as porosity that makes gas transportation in the soil viable (Xu and Qi, 2001; Kosugi et al., 2007; Brito et al., 2009) and the microbiological attribute that produces CO2 by microbial respiration during OM decomposition increas-ing the CO2 flux (Fang et al., 1998).
Burned sugarcane
In the burned area, the attributes contributing most to PC1 by order of influence represented by the correlation coefficient were Bd (-0.99), Biom (-0.97) and Mi (0.94) (Table 3). Bd and Biom influenced the low CO2 fluxes (mean 1.48 µmol CO2 m−2 s−1) (Figure 3A), Bd de-scribed 15 % of the variability and Biom in 14 %. The positive and negative correlation could indicate that in places with low bulk density and microbial biomass, there was a greater incidence of low CO2 fluxes (Figure 3A), reinforcing the relation between biomass and CO2, in areas where biomass was low, there were more low
CO2 fluxes. This is because the microorganisms promote the CO2 flux, as cited previously.
Bulk density influences soil porosity in general, in-creasing Mi, and the prevalence of more Mi than Ma can hinder gas transportation in the soil and the emission to the surface, resulting in more low category of CO2 fluxes. This effect can be confirmed by the Mi analysis that de-scribed 13 % of the variability in very low CO2 fluxes (mean 0.96 µmol CO2 m−2 s−1) (Figure 3A), because Mi hinders the soil gas circulation through the less recti-linear and more irregular paths, diminishing high CO2 fluxes and promoting very low CO2 fluxes.
The PC2 showed that the attributes explaining most of the variance were Ma (-0.91), C (0.84) and Ms (-0.78). Ms explained 14 % of the high CO2 flux class (2.11 µmol CO2 m−2 s−1) (Figure 3A). Similar results were found by Ryu et al. (2009) in soils in California (U.S.A.), where Ms explained 14 % of the CO2 flux variability and showed a negative correlation with CO2. Epron et al. (2006) also found a negative correlation between CO2 and Ms in a study on CO2 fluxes from forest soils in French Guiana.
Still, the negative relationship between soil respira-tion and soil water content contrasted with results that highlighted soil moisture controlling temporal soil respira-tion (Panosso et al., 2008; Maier et al., 2010; Goutal et al., 2012), but not spatial variation and, in our study, only the spatial variability of CO2 was analyzed, which explained the non-direct effect of soil moisture on the CO2 flux.
Figure 3 − Two-dimensional representation of the principal components 1 and 2 (biplot) in areas of B (A), G-5 (B) and G-10 (C),
with the description of high (H), moderate (Md), low (L) and very
low (VL) CO2 fluxes. Biom = microbial biomass; Ms = Soil water
Soil C content showed a positive correlation with PC2 and an opposite trend with Ma for the group high
CO2 fluxes (Figure 3A), which suggests that in places with high CO2 fluxes, the C trend is decreased, that is, more fluxes and less C storage (Cerri et al., 2007). A similar result was found by Panosso et al. (2012) where the CO2 results showed a positive correlation with PC2 (0.77) and negative with carbon stock (-0.31). Intense
OM decomposition tends to consume the C available in the soil with increasing CO2 released by microorgan-isms. On the other hand, low organic carbon content can be understood as protected and stabilized inside microaggregates (Lenka and Lal, 2013). Moreover, cor-roborating the results of our study, Fang et al. (1998) detected more CO2 associated with the low C content in pine soils.
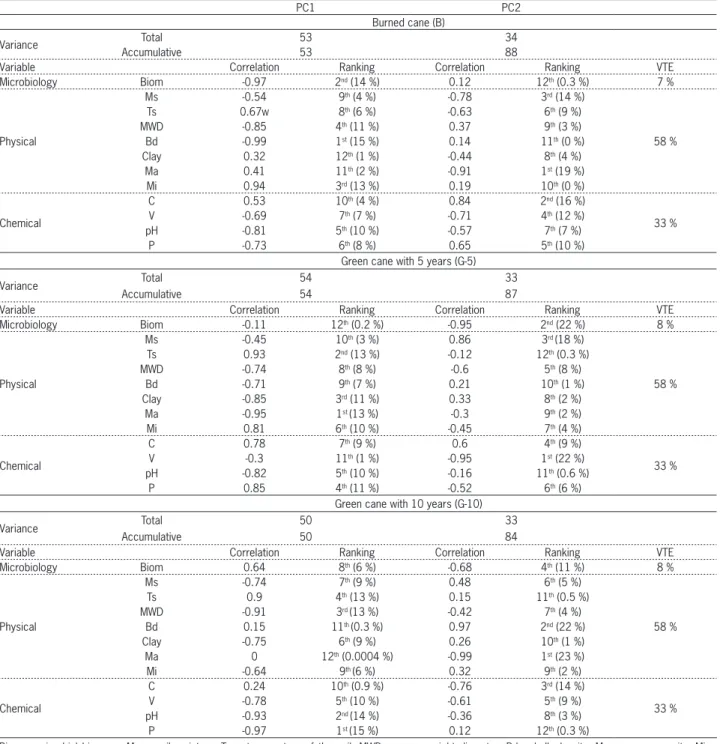
Table 3 − Variance data of the principal components PC1 and PC2 with correlation and ranking of importance of the microbiological, physical and chemical soil attributes.
PC1 PC2
Burned cane (B)
Variance Total 53 34
Accumulative 53 88
Variable Correlation Ranking Correlation Ranking VTE
Microbiology Biom -0.97 2nd (14 %) 0.12 12th (0.3 %) 7 %
Physical
Ms -0.54 9th (4 %) -0.78 3rd (14 %)
58 %
Ts 0.67w 8th (6 %) -0.63 6th (9 %)
MWD -0.85 4th (11 %) 0.37 9th (3 %)
Bd -0.99 1st (15 %) 0.14 11th (0 %)
Clay 0.32 12th (1 %) -0.44 8th (4 %)
Ma 0.41 11th (2 %) -0.91 1st (19 %)
Mi 0.94 3rd (13 %) 0.19 10th (0 %)
Chemical
C 0.53 10th (4 %) 0.84 2nd (16 %)
33 %
V -0.69 7th (7 %) -0.71 4th (12 %)
pH -0.81 5th (10 %) -0.57 7th (7 %)
P -0.73 6th (8 %) 0.65 5th (10 %)
Green cane with 5 years (G-5)
Variance Total 54 33
Accumulative 54 87
Variable Correlation Ranking Correlation Ranking VTE
Microbiology Biom -0.11 12th (0.2 %) -0.95 2nd (22 %) 8 %
Physical
Ms -0.45 10th (3 %) 0.86 3rd (18 %)
58 %
Ts 0.93 2nd (13 %) -0.12 12th (0.3 %)
MWD -0.74 8th (8 %) -0.6 5th (8 %)
Bd -0.71 9th (7 %) 0.21 10th (1 %)
Clay -0.85 3rd (11 %) 0.33 8th (2 %)
Ma -0.95 1st (13 %) -0.3 9th (2 %)
Mi 0.81 6th (10 %) -0.45 7th (4 %)
Chemical
C 0.78 7th (9 %) 0.6 4th (9 %)
33 %
V -0.3 11th (1 %) -0.95 1st (22 %)
pH -0.82 5th (10 %) -0.16 11th (0.6 %)
P 0.85 4th (11 %) -0.52 6th (6 %)
Green cane with 10 years (G-10)
Variance Total 50 33
Accumulative 50 84
Variable Correlation Ranking Correlation Ranking VTE
Microbiology Biom 0.64 8th (6 %) -0.68 4th (11 %) 8 %
Physical
Ms -0.74 7th (9 %) 0.48 6th (5 %)
58 %
Ts 0.9 4th (13 %) 0.15 11th (0.5 %)
MWD -0.91 3rd (13 %) -0.42 7th (4 %)
Bd 0.15 11th (0.3 %) 0.97 2nd (22 %)
Clay -0.75 6th (9 %) 0.26 10th (1 %)
Ma 0 12th (0.0004 %) -0.99 1st (23 %)
Mi -0.64 9th (6 %) 0.32 9th (2 %)
Chemical
C 0.24 10th (0.9 %) -0.76 3rd (14 %)
33 %
V -0.78 5th (10 %) -0.61 5th (9 %)
pH -0.93 2nd (14 %) -0.36 8th (3 %)
P -0.97 1st (15 %) 0.12 12th (0.3 %)
Green sugarcane with 5 years
For the G-5 treatment, the attributes with greater correlation to PC1 were Ma (-0.95), Ts (0.93), and clay (-0.85) (Table 3). Ma and clay were grouped in the high
CO2 class (2.78 µmol CO2 m−2 s−1)(Figure 3B), where the Ma explained 13 % and clay 11 % of variance. Panosso et al. (2011) showed correlation of -0.73 between clay and PC1 in a study of CO2 fluxes, with greater clay in the green than in the burned cane, however, the CO2 showed more significance in PC2, indicating little interaction of clay with CO2.
A possible explanation of negative correlation of clay with PC1 to explain the high CO2 flux is that clay promotes a type of carbon protection in the soil, that is, the adsorption of OM with mineral particles (mainly clay minerals and oxides) protects OM from microbial decomposition and prevents C loss as CO2, however, if the clay content is low, as shown in our study, protection is smaller, promoting more high CO2 flux situations.
Soil temperature Ts explained 13 % of the variance in low CO2 fluxes (mean of 1.66 µmol CO2 m−2 s−1) for the G-5 treatment. It is justifiable because soil temperature in G-5 was lower than B and G-10 and low temperature can promote low CO2 fluxes due the slow microorganism activity. The great performance of soil microorganisms occurred around 30 °C (Kononova, 1975) and in G-5, soil temperature was 18 °C (Table 2). The correlation between CO2 and Ts was also found in studies of Car-bonell-Bojollo et al. (2012), Lenka and Lal (2013), Shres-tha et al. (2013) and Song et al. (2013).
In PC2, the attributes that showed higher correla-tion were V (-0.95), Biom (-0.95) and Ms (0.86). The V and Biom were grouped in the very low CO2 flux class (mean 1.27 µmol CO2 m−2 s−1) (Figure 3B), indicated by the negative correlation coefficient, with places of low V and Biom with more incidences of very low CO2 fluxes. This is because low base saturation and soil acidity af-fected the soil microbial activity resulting in lower CO2 fluxes.
Green sugarcane with 10 years
The attributes that mostly contributed to the ex-planation of PC1 on the G-10 were, in order of influ-ence, P (-0.97), pH (-0.93) and MWD (-0.91) (Table 3). In addition, we observed that pH and MWD influenced the
high CO2 fluxes group (mean 4.02 µmol CO2 m−2 s−1) in 14 % and 13 % respectively, with negative correlations with PC1. This indicates that the greater incidence of
high CO2 fluxes can be explained by the low values of pH and MWD.
The pH values ranged from 4-5 (Table 2), probably due to the more intense OM decomposition than in the other areas due the greater amount of straw that stimu-lates microbial decomposition and this process may de-crease the pH during the nitrification stage. Xu and Qi (2001) showed negative correlation of CO2 emission with the pH in a study on spatial variation of soil CO2 fluxes.
MWD is associated with the physical protection of OM, and soil aggregates play this role by preventing the release of occluded carbon that serves as a source of energy for the microbial biomass. Thus, the negative cor-relation between MWD with PC1, mainly to explain the
high CO2 fluxes, helps to understand that lower MWD can promote less C protection and, thus, high CO2 fluxes.
Some variation (15 %) of CO2 fluxes within very low CO2 (1.56 µmol CO2 m−2 s−1) was explained by the P content, with a negative correlation with PC1. This indicates that the increased amount of P in the G-10 area influenced the smaller incidence of very low fluxes. The P content stimulates the production of the phosphatase enzyme produced by specific phosphate solubilizing mi-croorganisms (Barroso and Nahas, 2006), resulting in greater CO2 by microorganisms during decomposition, thus, explaining the smaller incidence of very low CO2 fluxes.
PC2 presented a greater explanation by the attri-butes Ma (-0.99), Bd (0.97) and C (-0.76). The Ma trend was the same in B and G-5 areas in which high CO2 flux-es were explained by Ma (Table 3). Panosso et al. (2012) studied CO2 soil fluxes in sugarcane management and also found significant correlation of PC1 with CO2 (0.77) and with Ma (0.75).
In a study by Leon et al. (2014), the PCA showed that the principal soil attribute responsible for High CO2 fluxes season was root biomass. In our study, Ma was always present and explained the significant variance of
high CO2 flux, despite the negative correlation with PC1 (Figure 3B) and PC2 (Figures 3A, C). Ma explained 19 % in B, 13 % in G-5 and 23 % in G-10 of high CO2 fluxes.
Ma has an important relationship with soil CO2 fluxes, as the greater number of macropores enables soil gas circulation (Brito et al., 2009), furthermore, an in-creased number of Ma enables greater concentrations of soil O2, which stimulates the activity of microbial de-composition and consequent soil CO2 fluxes. In a study by Goutal et al. (2012), changes in soil macroporosity percentages affected plant roots and associated micro-bial activities. Thus, soil Ma and Mi influenced possible flux trajectories of soil gases, which affected O2 and CO2 fluxes (Brito et al., 2009). According to the Fick's law (Alvenäs and Jansson, 1997), the relations between Ma and CO2 are controlled by several factors including total porosity, soil water content and tortuosity coefficient.
Other soil attributes interpreted in isolation can cause double interpretation, for example, Bd and C were attributes that presented both positive and negative cor-relations with the principal components (Table 3). A study of Panosso et al. (2011) concluded that the bulk density associated with the humification index relates better than other properties with soil CO2 emission, as this property is the most important to understand the emission variability in the area of burned cane.
the substrate to microbial activity. Negative correla-tions (Fang et al., 1998) associated with the limitation of decomposition due to adverse soil and climate con-ditions have also been observed, although their influ-ence was not always significant (Epron et al., 2004). According to Song et al. (2013), the increase in CO2 fluxes associated with soil carbon is complex and may involve both positive and negative feedbacks. This re-quires further studies of the CO2 flow and soil carbon dynamics.
Conclusions
The harvesting of green sugarcane presented higher CO2 total fluxes than the burned sugarcane did. This effect is associated with greater microbial activity in areas with greater plant waste deposition on the soil surface. On the other hand, the CO2 fluxes based on high-low criteria showed that macroporosity explained the "high" CO2 fluxes, this is because the greater number of macropores improved soil gas circulation and enabled greater concentrations of soil O2, which stimulate the activity of microbial decomposition and consequent soil CO2 fluxes.
Acknowledgments
To the São Paulo State Foundation for Research Support (FAPESP - 2010/18.979-5; 2011/04.842-0) for fi-nancial support and to the São Martinho ethanol mill for providing the study area.
References
Alvenäs, G.; Jansson, P.E. 1997. Model for evaporation, moisture and temperature of bare soil: calibration and sensitivity analysis. Agricultural and Forest Meteorology 88: 47-56. Ball, B.C.; Tiessen, H.; Stewart, J.W.B.; Salcedo, I.H.; Sampaio,
E.V.S.B. 1993. Residue management effects on sugarcane yield and soil properties in northeastern Brazil. Agronomy Journal 85: 1004-1008.
Barroso, C.B.; Nahas, E. 2006. Solubilization of iron phosphate by free or immobilized pellets and spores of Aspergillus niger. Research Journal of Microbiology 1: 210-219.
Brito, L.F.; Marques Júnior, J.; Pereira, G.T.; Souza, Z.M. 2009. Soil CO2 emission of sugarcane fields as affected by topography. Scientia Agricola 66: 77-83.
Carbonell-Bojollo, R.; Torres, M.A.R.R.; Rodriguez-Lizana, A.; Ordónez-Fernández, R. 2012. Influence of soil and climate conditions on CO2 emissions from agricultural soils. Water Air and Soil Pollution 223: 3425-3435.
Cerri, C.E.P.; Sparoveki, G.; Bernoux, M.; Easterling, W.E.; Melillo, J.M.; Cerri, C.C. 2007. Tropical agriculture and global warming: impacts and mitigation options. Scientia Agricola 64: 83-99. Brazilian Agricultural Research Corporation [Embrapa]. 1997.
Elisabeth, M., Claessen, C. Manual methods of soil analysis = Manual de análise de solos. 2ed. Embrapa, Rio de Janeiro, RJ, Brazil (in Portuguese).
Epron, D.; Bosc, A.; Bonal, D.; Freycon, V. 2006. Spatial variation of soil respiration across a topographic gradient in a tropical rain forest in French Guiana. Journal of Tropical Ecology 22: 565-574.
Epron, D.; Nouvellon, Y.; Roupsard, O.; Mouvondy, W.; Mabiala, A.; Saint-Andre, L.; Joffre, R.; Jourdan, J.; Bonnefond, J.M.; Berbigier, P.; Hamel, O. 2004. Spatial and temporal variations of soil respiration in a eucalyptus plantation in Congo. Forest Ecology and Management 202: 149-160.
Fang, C.; Moncrieff, J.B.; Gholz, H.L.; Clark, K.L. 1998. Soil CO2 efflux and its spatial variation in a Florida slash pine plantation. Plant and Soil 205: 135-146.
Goutal, N.; Parent, F.; Bonnaud, P.; Demaison, J.; Nourisson, G.; Epron, D.; Ranger, J. 2012. Soil CO2 concentration and efflux as affected by heavy traffic in forest in northeast France. Europan Journal of Soil Science 63: 261-271.
Jenkinson, D.S.; Ladd, J.N. 1981. Microbial biomass in soil: measurement and turnover. Soil Biology and Biochemistry 5: 415-471.
Jenkinson, D.S.; Powlson, D.S. 1976. The effects of biocidal treatments on metabolism in soil. V. Method for measuring soil biomass. Soil Biology and Biochemistry 8: 209-213.
Johnson, R.A.; Wichern, D.W. 2002. Applied Multivariate Statistical Analysis. 5ed. Prentice Hall, Upper Saddle River, NJ, USA.
Kaiser, H.F. 1958. The varimax criterion for analytic rotation in factor analysis. Psychometrika 23: 178-200.
Kononova, M.M. 1975. Humus of virgin and cultivated soils. In: Gieseking, J.E., ed. Soil components. Springer, Berlin, Germany.
Kosugi, Y.; Mitani, T.; Itoh, M.; Noguchi, S.; Tani, M.; Matsuo, N.; Takanashi, S.; Ohkubo, S.; Nik, A.R. 2007. Spatial and temporal variation in soil respiration in a southeast Asian tropical rainforest. Agricultural and Forest Meteorology 147: 35-47.
La Scala, N.; Mendonça, E.S.; Souza, J.J.; Panosso, A.R.; Simas, F.N.B.; Schaefer, C.E.G.R. 2010. Spatial and temporal variability in soil CO2-C emissions and relation to soil temperature at King George Island, Maritime Antarctica. Polar Science 4: 4479-487.
La Scala, N.; Marques Júnior, J.; Pereira, G.T.; Corá, J.E. 2000. Carbon dioxide emission related to chemical properties of a tropical bare soil. Soil Biology and Biochemistry 32: 1469-1473.
Lenka, N.K.; Lal, R. 2013. Soil aggregation and greenhouse gas flux after 15 years of wheat straw and fertilizer management in a no-till system. Soil and Tillage Research 126: 78-89.
Leon, E.; Vargas, R.; Bullock, S.; Lopez, E.; Panosso, A.R.; La Scala, N. 2014. Hot spots, hot moments, and spatio-temporal controls on soil CO2 efflux in a water-limited ecosystem. Soil Biology and Biochemistry 77: 12-21.
Maier, M.; Schack-Kirchner, H.; Hildebrand, E.E.; Holst, J. 2010. Pore-space CO2 dynamics in a deep, well-aerated soil. European Journal of Soil Science 61: 877-887.
Nelson, D.W.; Sommers, L.E. 1982. Total C, organic C and OM. In: Page, R.H.; Kenny, D.R., eds. Methods of soil analysis. II. Chemical and microbiological properties. 2ed. Soil Science Society of America, Madison, WI, USA.
Panosso, A.R.; Perillo, L.I.; Ferraudo, A.S.; Pereira, G.T.; Miranda, J.V.G.; La Scala, N. 2012. Fractal dimension and anisotropy of soil CO2 emission in a mechanically harvested sugarcane production area. Soil and Tillage Research 124: 8-16.
Panosso, A.R.; Marques Júnior, J.; Milori, D.M.B.P.; Ferraudo, A.S.; Barbieri, M.; Pereira, G.T.; La Scala, N. 2011. Soil CO2 emission and its relation to soil properties in sugarcane areas under Slash-and-burn and Green harvest. Soil and Tillage Research 111: 190-196.
Panosso, A.R.; Marques Júnior, J.; Pereira, G.T.; La Scala, N. 2009. Spatial and temporal variability of soil CO2 emission in a sugarcane area under green and Slash-and-burn managements. Soil and Tillage Research 105: 275-282.
Panosso, A.R.; Pereira, G.T.; Marques Junior, J.M.; La Scala, N. 2008. Spatial variability of CO2 emission on Oxisol soils cultivated with sugarcane under different management practices = Variabilidade espacial da emissão de CO2 em Latossolos sob cultivo de cana-de-açúcar em diferentes sistemas de manejo. Engenharia Agrícola 28: 227-236 (in Portuguese, with abstract in English).
Raij, B. van; Andrade, J.C.; Cantarella, H.; Quaggio, J.A. 2001. Chemical Analysis to Evaluate the Fertility of Tropical Soils = Análise Química para Avaliação da Fertilidade de Solos Tropicais. Instituto Agronômico, Campinas, SP, Brazil (in Portuguese).
Razafimbelo, T.; Barthès, B.; Larré-Larrouy, M.C.; De Luca, E.F.; Laurent, J.Y.; Cerri, C.C.; Feller, C. 2006. Effect of sugarcane residue management (mulching versus burning) on OM in a clayey Oxisol from southern Brazil. Agriculture, Ecosystems and Environment 115: 285-289.
Rolim, J.S.; Camargo, M.P.B.; Lania, D.G.; Moraes, J.F.F. 2007. Climatic classification of Koppen and Thornthwait systems their applicability in the determination of agroclimatic zonning for the state of São Paulo, Brazil. Bragantia 66: 711-720 (in Portuguese, with abstract in English).
Ryu, S.; Concilio, A.; Chen, J.; North, M.; Ma, S. 2009. Prescribed burning and mechanical thinning effects on belowground conditions and soil respiration in a mixed-conifer forest, California. Forest Ecology Management 257: 1324-1332. Shrestha, R.K.; Lal, R.; Rimal, B. 2013. Soil carbon fluxes and
balances and soil properties of organically amended no-till corn production systems. Geoderma 197-198: 117-185.
Song, Z.; Yuan, H.; Kimberley, M.O.; Jiang, H.; Zhou, G.; Wang, H. 2013. Soil CO2 flux dynamics in the two main plantation forest types in subtropical China. Science of the Total Environment 444: 363-368.