Received July 3, 2009 and accepted March 17, 2010. Corresponding author: [email protected]
Identification of demand characteristics in the production of sires using a
conceptual model of quality function deployment: a case study
Adriano Garcia Rosado Júnior1, José Fernando Piva Lobato1, Márcia Echeveste2, Adriano Schaun Gerber2, Samanta Yang2, Karina Rossini2
1PPG - Zootecnia/UFRGS.
2PPG - Engenharia de Produção/UFRGS.
ABSTRACT -The objective of this study is to identify demands of customers of a sire-producing company in Rio Grande do Sul, Brazil, by using a methodology adapted from quality function deployment tool. The adaptation consisted on the fact that matrices are treated in an unified manner among product and services due to the high perception of inter-relationship among these business components. The results evidenced that clients priorize traits related to the product, especially genetic value of the bulls. Service items were also highlighted, and they may be presented as an opportunity of differentiation among suppliers. Customer profile influenced priority order inasmuch as farmers with no technical services prioritized performance traits over genetic traits, opposing to those who were assisted and to technical consultants. Concerning to farm size, there were changes only in the tertiary level of the priority order of the demands. The adaptation of the methodology for joint analysis interfered in the results, especially in service prioritization. This study contributed to formatting a model for using quality function deployment in sire production, helping to identify quality demands and its priority levels for the population and researched company, and it may be used in further studies on the product beef sires.
Key Words: agribusiness, genetics characteristics, quality demand
Determinação das características da demanda para produção de touros por meio de
um modelo conceitual de desdobramento da função qualidade: um estudo de caso
RESUMO -Este trabalho foi realizado com o objetivo de identificar as demandas dos clientes de uma empresa produtora de touros de corte no Rio Grande do Sul por meio de uma metodologia adaptada da ferramenta desdobramento da função qualidade. A adaptação consistiu no fato de que as matrizes são tratadas de forma unificada entre o produto e os serviços, devido à percepção do elevado nível de inter-relacionamento entre esses componentes no negócio. Os resultados evidenciaram que os clientes priorizam as características relacionadas ao produto, especialmente o valor genético dos touros. Os itens de serviços também se destacaram, podendo configurar-se como uma oportunidade de diferenciação entre as empresas fornecedoras. O perfil dos clientes influenciou a ordem de priorização, uma vez que os produtores sem assistência técnica priorizaram as características de desempenho às genéticas, ao contrário dos assistidos e dos consultores técnicos. No tamanho da propriedade, só houve alterações na ordem de priorização no nível terciário das demandas. A adaptação da metodologia para a análise conjunta interferiu no resultado, principalmente na priorização dos serviços. O estudo contribuiu com a formatação de um modelo de uso do desdobramento da função qualidade na produção de touros, auxiliando na identificação da qualidade demandada e no seu nível de priorização para a população e empresa pesquisada, podendo ser utilizado em outros estudos para o produto touro.
Palavras-chave: agronegócio, características genéticas, qualidade demandada
www.sbz.org.br
Introduction
The focus of companies on the need to adapt their products to the demands of consumers has been widely discussed in current literature. At the manufacturing level, the methodology of Quality Function Deployment(QFD) is used to qualify products and services, allowing the determination of needs and demands of customera by systematizing information flow (Ribeiro et al., 2000; Chan &
Supplying the demand of sire replacement according to actual market needs is a challenge for genetic companies, particularly today, as in order to survive, the products must be rapidly adapt to the consumers’ preferences. In this context, quality function deployment is an alternative method to determine which product characteristics should be prioritized, considering that sire production, as identified by Rosado Júnior & Lobato (2009), is closely linked to added services, and that their evaluation cannot be performed separately, which requires adapting quality function deployment to allow an overall perspective.
The objective of the present study was to determine the main quality traits demanded by sire purchasers in terms of products and associated services, as well as their priority levels as it was identified by using the method of quality function deployment. The study also aimed at contributing to the method used as foundation (Ribeiro et al., 2000), proposing a new method that analyzes demands related to products and services together.
Material and Methods
This study was based on an investigation performed in two stages: firstly, a qualitative approach, and secondly a quantitative approach was used, and the procedure is classified as survey (Gil, 1991). The study was carried out in an animal-production company located in Rio Grande do Sul, Brazil, which was selected due to its tradition and importance in the production of beef sires both at state and national level.
The Quality Function Deployment (QFD) model, proposed by Ribeiro et al. (2000), was adapted by considering products and services together (Figure 1). This combination was proposed by the authors of the present study because most of quality function deployment models consider matrices separately. Quality function deployment is defined as the systematic deployment of work functions and operations by using table and matrices, providing step-by-step details of the demanded quality of a product or service (Miguel, 2005). This method can be applied in different contexts, such as in development of new products, association of market demands, and to project and process specifications, as applied in the studies of Dikmen et al. (2005) and Marsot (2005). It can also be used as a tool to support management decision as to understand what is important and critical according to the perception of the customer or uses, as shown in the studies of Killen et al. (2005), LePrevost & Mazur (2005), and Bosh & Enríquez (2005). Moreover, it is an interesting opportunity to change entrepreneurial culture, as it makes companies more pro-active, solving
quality-related problems, and allowing them to compare their products with those of competitors (Zairi & Youssef, 1995). Aiming at performing a practical study to allow the supply of demands by the customers, a market survey was carried out in two stages. During the first stage, a qualitative questionnaire, consisting of nine discursive questions, was developed and applied to a selected group using convenience sampling (Schiffman & Kanuk, 2000) that included a total of five people, university professors, producers, and professionals with previous experience in the matter and working in Rio Grande do Sul. The aim of the survey was to identify quality demands associated to products and services at the time sires are purchased. The results were used to structure the demanded quality tree, and later, to develop the quantitative survey applied in the second stage.
In the qualitative survey, interviewees were asked questions regarded to sire quality and available information, important marketing characteristics, options of payment and added services, expected sire traits, and previous satisfaction or dissatisfaction with this type of product. Answers were hierarchically organized, generating a quality tree with primary, secondary, and tertiary levels, which were used to develop the quantitative questionnaire applied to identify the order of importance of the demanded characteristics of sires as product and added services. During this stage, the questionnaire was applied to 58
customers of the studied company during its main auction event in October, 2008. The interviewees were directed to classify the tertiary items of demanded quality in an increasing 1-10 scale, in which 1 was considered as not important and 10 extremely important. The interviewees were the asked to prioritize the secondary items, which group tertiary items by affinity, and this was used to calculate percentage weight of each group. The average score attributed by the interviewees to each tertiary item was used to compose a demanded quality prioritization index (IDi) using the percentage weight of the secondary group, and classifying the item by applying equation 1 (Echeveste, 1997).
(1)
in which: Qm = relative importance of demanded quality at the primary level n; Gn = relative importance of demanded quality at secondary level n.
The quantitative questionnaire also contained two questions to identify profile of interviewees as to farm size (based on the number of breeding cows: up to 500 cows = small; from 501 to 1000 cows = intermediate; more than 1000 cows = large) and the presence or not of technical services in the farm. It also allowed identifying consultants that provide services to the farmers. By using this stratification, demanded quality was ranked according to the priority attributed to each item according to the specific profile of the interviewed customers.
Concerned to quality matrix, for each demanded quality item in the quality tree, the characteristic that allowed quantitative measurement of this item was determined, and their relationship level was evaluated using 1-9 scores, which identified the influence of each quality characteristic (DQij) on the answer for the following question: if the “x” characteristic is maintained at excellent level, will the demanded quality be supplied? The higher the score, the higher the impact of the characteristic on the supply of the demand (Ribeiro et al., 2000).
Based on the IDi index generated by the demanded quality tree, relative weights were established for the characteristics that were used to calculate the importance (IDi*) of each items. Relative weights were corrected using two indexes: competitive evaluation (Mi), in which 0.5 = better than competitors; 1.0 = similar to competitors; 1.5 = worse than competitors; and 2.0 = much worse than competitors; and strategic evaluation (Ei), in which 0.5 = little importance; 1.0 = intermediate importance; 1.5 = high importance; 2.0 = very high importance. This allowed the calculation of relative importance (IDi*) according to
equation 2, which reorganizes quality characteristics considering the previous items.
(2) The importance of each quality characteristic (IQj) was then determined, considering its relationship with the demanded quality items (DQij) and their relative importance (IDi*), according to equation 3.
(3) Corrected importance index (IQj*) was then calculated according to equation 4, considering the importance of the previously calculated quality characteristics, the difficulty to change these characteristics (Dj), and the results of the competitive evaluation (Bj).
(4) In order to weigh difficulty to change (Dj) and competitive evaluation (Bj), 0.5 to 2.0 scales were used: difficulty to change (Dj), 0.5 = very difficult, 1.0 = difficult, 1.5 = moderate, and 2.0 = easy; and competitive evaluation (Bj), 0.5 = better than competitors, 1.0 = similar to competitors, 1.5 = worse than competitors, and 2.0 = much worse than competitors.
The matrix of parts separates product/services as a function of their parts. The aim is to identify which parts are associated to the previously highlighted quality characteristics, helping to identify the parts that are critical to final product quality (Ribeiro et al., 2000). The importance of each part (IPi) was calculated considering the intensity of the relationship among parts (PQij) and the importance defined for quality characteristics (IQj*) using equation 5: (5) After Ipi was obtained, prioritization (IPi*) was calculated considering the importance of each component and the correction for practical aspects evaluated at this step, which are improvement implementation difficulty (Fi) and time (Ti). The scale of implementation difficulty was 0.5 = very difficult, 1.0 = difficult, 1.5 = moderate, and 2.0 = easy, and the scale of implementation time was 0.5 = very long; 1.0 = long; 1.5 = moderate, and 2.0 = short.
Based on these indexes, the corrected importance of each component was calculated according to equation 6.
(6)
In the process matrix, the aim is to identify the processes associated to the previously highlighted quality characteristics, identifying those considered as critical for product and service quality (Ribeiro et al., 2000).
(7) After defining the importance of each process, process prioritization (IPi*) was calculated considering the importance of each function (IPi), as well as the difficulty to change the process (Fi) and the time required to change it (Ti). Scales from 0.5 to 2.0 were used to attribute scores to these indexes (Table 3).
Based on these indexes, the corrected importance of each process was calculated according to equation 8.
(8) The process matrix derives two resource matrixes: human resources and infrastructure, as represented in the conceptual model. The importance of each human resource component (IRj) was calculated by considering the intensity of their relationship with product and service process (PQij), as well as the importance defined for both (IPi*), according to equation 9.
(9) After the importance of each human resource was defined, their priority was calculated (IRj*). The human resource prioritization index is based on cost (Ct) and implementation difficulty (Lj). The scale of implementation difficulty was 0.5 = very difficult, 1.0 = difficult, 1.5 =
moderate, and 2.0 = easy, and the cost scale was (Ct), 0.5 = very high, 1.0 = high, 1.5 = moderate, and 2.0 = low.
Therefore, the corrected importance is calculated based on resource prioritization, according to equation 10.
(10) The second matrix derived from the process matrix is the infrastructure resource matrix, which evaluates the contribution of this resource to production and services. The importance of each of these resources (IRj) was to calculate the intensity of their relationship with processes (PQij) and their defined importance, according to equation 11.
(11) After the importance of each infrastructure resource was defined, the priority was to calculated IRj*, as a function of cost (Ct) and implementation difficulty (Lj). Their corrected importance is calculated based on resource prioritization, according to equation 12.
(12)
Results and Discussion
By using the qualitative questionnaire, the main demands related to the product sire were identified, totaling
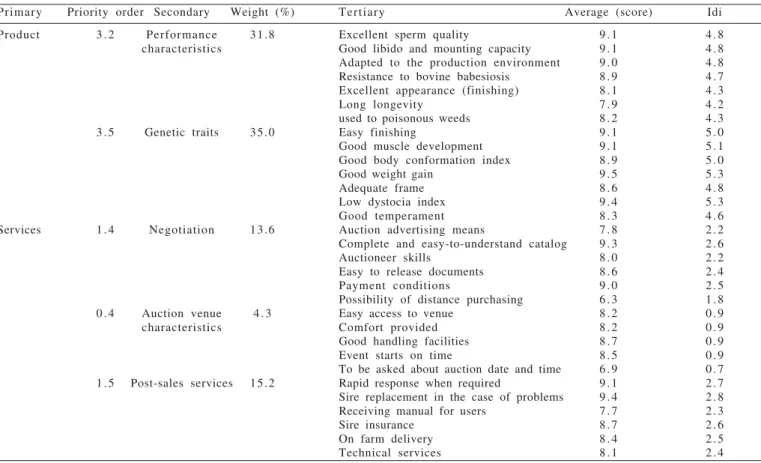
Primary Priority order Secondary Weight (%) Tertiary Average (score) Idi
Product 3 . 2 Performance 31.8 Excellent sperm quality 9 . 1 4 . 8
characteristics Good libido and mounting capacity 9 . 1 4 . 8
Adapted to the production environment 9 . 0 4 . 8
Resistance to bovine babesiosis 8 . 9 4 . 7
Excellent appearance (finishing) 8 . 1 4 . 3
Long longevity 7 . 9 4 . 2
used to poisonous weeds 8 . 2 4 . 3
3 . 5 Genetic traits 35.0 Easy finishing 9 . 1 5 . 0
Good muscle development 9 . 1 5 . 1
Good body conformation index 8 . 9 5 . 0
Good weight gain 9 . 5 5 . 3
Adequate frame 8 . 6 4 . 8
Low dystocia index 9 . 4 5 . 3
Good temperament 8 . 3 4 . 6
Services 1 . 4 Negotiation 13.6 Auction advertising means 7 . 8 2 . 2
Complete and easy-to-understand catalog 9 . 3 2 . 6
Auctioneer skills 8 . 0 2 . 2
Easy to release documents 8 . 6 2 . 4
Payment conditions 9 . 0 2 . 5
Possibility of distance purchasing 6 . 3 1 . 8
0 . 4 Auction venue 4 . 3 Easy access to venue 8 . 2 0 . 9
characteristics Comfort provided 8 . 2 0 . 9
Good handling facilities 8 . 7 0 . 9
Event starts on time 8 . 5 0 . 9
To be asked about auction date and time 6 . 9 0 . 7
1 . 5 Post-sales services 15.2 Rapid response when required 9 . 1 2 . 7
Sire replacement in the case of problems 9 . 4 2 . 8
Receiving manual for users 7 . 7 2 . 3
Sire insurance 8 . 7 2 . 6
On farm delivery 8 . 4 2 . 5
Technical services 8 . 1 2 . 4
Table 1 - Demanded quality tree
31 characteristics (tertiary level), which derived, according to affinity grouping, five secondary and two secondary levels, as shown in the quality tree (Table 1).
In the evaluation of the importance of services added to the product, the number of items was similar to those related specifically to product characteristics. However, prioritization at secondary level, obtained when the quantitative questionnaire was applied to customers, indicated that the concern with product-related items is still predominant, with emphasis on genetic and performance traits. This may be related to the large impact of sire choice in herd genetic quality (Lôbo, 2000; Giacomini, 2006).
As second priority, post-sales services show a small advantage concerned to negotiation conditions, evidencing
the importance given by customers as to the safety of their investment as well as to information on the use and care of the product that allow maximal expression of the production potential.
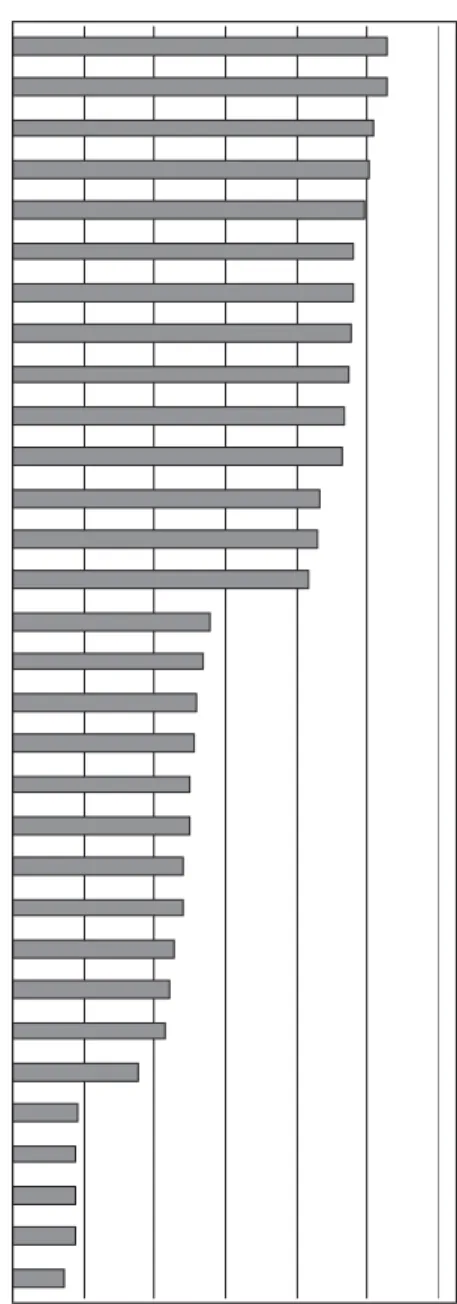
When the priority given by the customers to the demanded quality was analyzed with no corrections as to the specificities of the studied company, genetic and functional traits were more important than services (Figure 2). The concern with traits related to finishing rate and potential, and good quality carcass were evident. Dystocia rate received a high score, as calving loss is an important factor of beef cattle production loss, particularly in farms that practice breeding heifers at 14 to 15 months of age (Pilau & Lobato, 2009; Vaz & Lobato, 2010).
The customers gave higher scores to services that ensure their investments, such as sire replacement and product insurance, as well as to service quality and quick response from the supplier to solve post-sales issues. The characteristics related to the auction venue were placed in the lowest priority level.
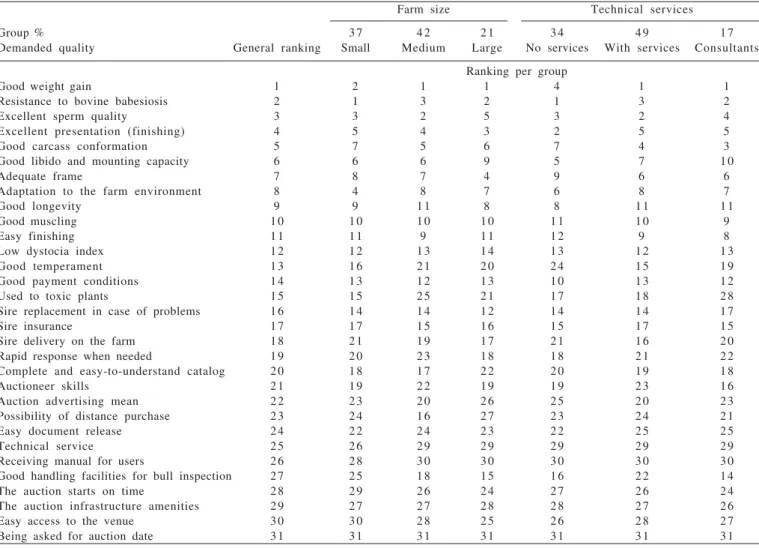
When analyzed by customer profile (farm size and type of technical service), primary demanded quality items are classified according to the importance given by each customer group (Table 2).
The trait ‘weight gain’ was almost uniformly distributed among the different groups, except for those with no technical services, who, together with the small producers, prioritized ‘resistance to bovine babesiosis’, possibly because of the concern with losses, which might have been caused by this disease, to their investment in sires. Farmers with no technical services prioritized external aspects, rather than those related to production traits expressed by the breeding values of the sires. Even among consultants and farmers with technical services, external sire traits are considered important and they are in the fifth
priority level, showing the importance of these traits for sire producers.
The large farmers were placed in the fourth priority level aspects related to frame score, differently from the other customer groups, perhaps for considering the results obtained per animal (e.g., slaughter weight) as more important than its performance per unit of area inasmuch as land is not a limiting factor in their production systems. Another possibility, which does not exclude the previous one, would be rearing cattle for export market because this market demands heavy carcasses to comply with specifications, and therefore farmers would obtain better market prices. As for the demand for ‘adaptation to the production system’, which is critical for the expression of sire production potential, it is more important for small farmers than for the other groups, including consultants and farmers with technical services, which may indicate that the latter underestimate this item.
At the secondary level, the factor ‘technical services’ influenced the highest customer priority, with farmers with no technical services prioritizing performance traits over
Farm size Technical services
Group % 3 7 4 2 2 1 3 4 4 9 1 7
Demanded quality General ranking Small Medium Large No services With services Consultants
Ranking per group
Good weight gain 1 2 1 1 4 1 1
Resistance to bovine babesiosis 2 1 3 2 1 3 2
Excellent sperm quality 3 3 2 5 3 2 4
Excellent presentation (finishing) 4 5 4 3 2 5 5
Good carcass conformation 5 7 5 6 7 4 3
Good libido and mounting capacity 6 6 6 9 5 7 1 0
Adequate frame 7 8 7 4 9 6 6
Adaptation to the farm environment 8 4 8 7 6 8 7
Good longevity 9 9 1 1 8 8 1 1 1 1
Good muscling 1 0 1 0 1 0 1 0 1 1 1 0 9
Easy finishing 1 1 1 1 9 1 1 1 2 9 8
Low dystocia index 1 2 1 2 1 3 1 4 1 3 1 2 1 3
Good temperament 1 3 1 6 2 1 2 0 2 4 1 5 1 9
Good payment conditions 1 4 1 3 1 2 1 3 1 0 1 3 1 2
Used to toxic plants 1 5 1 5 2 5 2 1 1 7 1 8 2 8
Sire replacement in case of problems 1 6 1 4 1 4 1 2 1 4 1 4 1 7
Sire insurance 1 7 1 7 1 5 1 6 1 5 1 7 1 5
Sire delivery on the farm 1 8 2 1 1 9 1 7 2 1 1 6 2 0
Rapid response when needed 1 9 2 0 2 3 1 8 1 8 2 1 2 2
Complete and easy-to-understand catalog 2 0 1 8 1 7 2 2 2 0 1 9 1 8
Auctioneer skills 2 1 1 9 2 2 1 9 1 9 2 3 1 6
Auction advertising mean 2 2 2 3 2 0 2 6 2 5 2 0 2 3
Possibility of distance purchase 2 3 2 4 1 6 2 7 2 3 2 4 2 1
Easy document release 2 4 2 2 2 4 2 3 2 2 2 5 2 5
Technical service 2 5 2 6 2 9 2 9 2 9 2 9 2 9
Receiving manual for users 2 6 2 8 3 0 3 0 3 0 3 0 3 0
Good handling facilities for bull inspection 2 7 2 5 1 8 1 5 1 6 2 2 1 4
The auction starts on time 2 8 2 9 2 6 2 4 2 7 2 6 2 4
The auction infrastructure amenities 2 9 2 7 2 7 2 8 2 8 2 7 2 6
Easy access to the venue 3 0 3 0 2 8 2 5 2 6 2 8 2 7
Being asked for auction date 3 1 3 1 3 1 3 1 3 1 3 1 3 1
genetic traits, which were prioritized by farmers with technical services and consultants (Table 3). These customers, with higher education level and better access to information, gave more importance to scientific knowledge. Although weightings were different, there was no change in the classification as to the priority level of the other secondary items. Farm size did not influence priority order.
Quality matrix transformed customer demands into quality characteristics that should be sought by the company in its process, in addition to prioritizing them, considering the analyses of the internal and external environment of the company (Figure 3). The characteristic ‘production system’ was ranked as first, indicating that sire production system was closely related to the production
Farm size Technical services
3 7 4 2 2 1 3 4 4 9 1 7
Secondary characteristic General index Small Medium Large No services With services Consultants
Index per group
Genetic traits 1 . 5 1 . 6 0 . 9 1 . 0 1 . 5 1 . 0 1 . 0
Performance traits 1 . 8 1 . 6 1 . 3 1 . 3 1 . 2 1 . 5 1 . 7
Post-sales services 3 . 5 3 . 1 2 . 6 2 . 5 2 . 6 2 . 8 2 . 8
Negotiation 3 . 6 3 . 2 2 . 6 2 . 8 2 . 8 3 . 0 2 . 8
Auction venue 4 . 6 4 . 0 3 . 5 3 . 4 3 . 6 3 . 7 3 . 4
Table 3 - Prioritization index (group %) of secondary characteristics according to farm size and technical service profile
systems of the target customers inasmuch as the expression of the production potential and the achievement of the desired economic results depend on this interaction (Cundiff, 2006). This characteristic mainly supplies the demand for adaptation to the production environment and expression of genetic potential, which was highly ranked by the customers.
Among the functional characteristics, ‘longevity’ presented high priority, because when the initial investment is diluted in a longer period, customer production costs are reduced. Sire longevity is correlated to several other quality characteristics, such as ‘sperm production’ and ‘incidence of bovine babesiosis’, which also appear with high priority indexes. As to services, the high value given to ‘manual for users’ and ‘technical services’ is consistent with the discussion above.
The adaptation of the method to a combined analysis of product with services made in the matrixes confirm the hypothesis that there is a crossed relationship, as some services critically influence post-sales product performance. The impact was more significant on the order of prioritization of characteristics related to services (Table 4).
When services were focused, there were significant changes when analysis was combined, with emphasis on the high ranking of quality characteristics, such as ‘instructions on product use’ and ‘receiving technical services’, possibly due to the relationship of these services with product characteristics that are highly valued by the customers. As to product quality characteristics, there was only a change in the second position between ‘frame score’ and ‘longevity’, which was prioritized in the combined analysis, while the other priorities remained in the same
position. The comparison made by the authors between separate and combined matrixes was applied only to the quality matrix, and it is assumed that any change in this matrix will result in changes in the subsequent matrixes.
In the matrix of parts (Figure 4), the process of sire production was divided in six subgroups: one representing the traits transmissible to the herd (additive genetics; two functional subgroups, which include the traits that allow the sire to efficiently breed for the longest possible time (adaptation/health and breeding soundness); and three subgroups related to product marketing (presentation, sales, and post-sales).
Product appearance was defined as the highest priority, probably because it is interpreted by the customers as the expression of the genetic traits of the sire, which are considered as priorities. The corrected applied indexes promoted significant changes in the prioritization order of the parts. When correcting for difficulty and action time, additive genetics moved from the first to the fifth position because the quality function deployment method prioritizes actions that are easier and faster to be implemented. This needs to be considered carefully because
Separate analysis Combined analysis
Quality characteristic related to services Index Order Index Order
Instructions on product use 0.33 3 1.35 1
Possibility of having technical services 0.15 1 3 0.73 2
Individual insurance policy 0.32 4 0.71 3
Possibility of free freight 0.28 7 0.42 4
Contingency plan for replacement 0.37 1 0.37 5
Number of payment options 0.34 2 0.34 6
Number of alternatives for distance purchase 0.31 5 0.31 7
Time for document release 0.28 6 0.28 8
Auctioneer evaluation scale 0.24 8 0.24 9
Venue access quality evaluation 0.21 9 0.21 1 0
Presence of relevant items in the catalog 0.20 1 0 0.20 1 1
Response time 0.18 1 1 0.18 1 2
Period and used media 0.17 1 2 0.17 1 3
Supplying handling facilities requirements 0.15 1 4 0.15 1 4
Supplying comfort requirements 0.11 1 5 0.11 1 5
Time of delay to begin the auction 0.10 1 6 0.10 1 6
Consulting customers for auction date and time 0.06 1 7 0.06 1 7
Table 4 - Order of prioritization of service characteristics according to the type of analysis
genetic improvement in cattle is a difficult and long process (due to the long interval between generations), but it must be always prioritized in the production of breeding animals. The process matrix allowed crossing the main processes in charge of realizing the main product parts, prioritizing them according to their importance, and then correcting them for implementing easiness and time (Figure 5).
The process ‘preparation for sales’ was ranked as first, followed by other related processes such as ‘classification and grouping for sales’, ‘feed supply’, and ‘rearing’, all of them related to the objective of offering a product that expresses its maximal production potential, which is consistent with the goal of supplying the quality demand prioritized by the customers.
When the human resources involved in sire production were analyzed, stockpeople, despite being characterized by people with low education and training levels, were ranked
very high due to their effective participation in several production processes, and therefore deserving special attention related to the training plan and to motivation (Figure 6).
Prioritization also stresses the importance of the production manager, as he or she is in charge of determining the breeding program, which will define the quality of the generated products both in terms of genetic value and to adaptation to the market for which the company produces. The veterinarian is responsible for planning health and nutritional programs, in addition of assessing fertility and breeding capacity, and these programs and assessments are linked to the functional aspects of the sires.
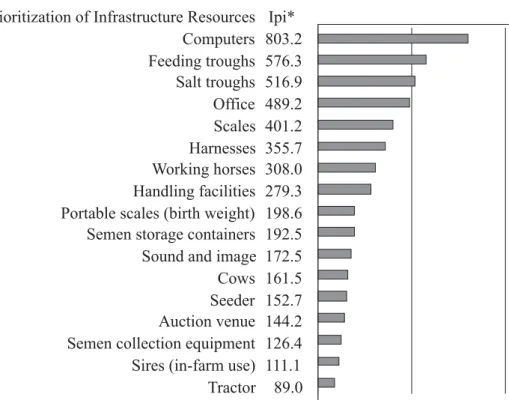
Regarded to the infrastructure resource matrix, it was evident that the quality function deployment method prioritizes the items that are more involved in the processes and that are cheaper and easier to be implemented. This was
calves is 50%. This means that for every 20 sold sires, approximately 200 cows weaning their calves are required, considering all productive cycle losses. This makes cows one of the most important production resources, not only due to their quantity and financial value, but also to the added genetic value, which requires a long time of selection for producing traits that will be transmitted to the sires they produce.
evidenced by the classification obtained in the studied case, where seemingly less important items were prioritized (Figure 7). However, office infrastructure and handling facilities, which are essential for working with the bulls, followed with a good priority level.
Another critical resource for sire production are the cows, since, in average, only 20% of the born males are selected as sires, and the normal frequency of male to female
Conclusions
The use of quality function deployment methodology in sire production allows the identification of the demanded quality and of the prioritization level for the production of sires and for the analyzed company. The adaptation of this methodology for combined analysis interferes in the results, particularly those related to service prioritization, and it may be used for other studies on this product.
References
ANUALPEC 2008, Anuário da Pecuária Brasileira. São Paulo: FNP Consultoria, 2008. 332p.
BOSCH, V.G.; ENRÍQUEZ, F.T. TQM and QFD: exploiting a customer complaint management system. International Journal of Quality & Reliability Management, v.22, n.1, p.30-37, 2005.
CHAN, L.K.; WU, M.L. Quality function deployment: A literature review. European Journal of Operational Research, v.143, n.3, p.463-467, 2002.
CHENG, L.C. QFD em desenvolvimento de produto: características metodológicas e um guia para intervenção. Revista Produção, v.3, n.2, 2003 (on line).
CUNDIFF, L.V. The impact of quantitative genetics on productive, reproductive, and adaptive traits in beef cattle. In: AUSTRALIAN BEEF-THE LEADER! THE IMPACT OF SCIENCE ON THE BEEF INDUSTRY, 2006, Armidale.
Proceedings... Armidale: University of New England, 2006. p.29-46.
DIKMEN, I.; BIRGONUL, M.T.; KIZILTAS, S. Strategic use of quality function deployment (QFD) in the construction industry.
Building and Environment, v.40, n.2, p.245-255, 2005. ECHEVESTE, M.E. Planejamento da otimização experimental
de processos industriais. 1997. 166f. Dissertação (Mestrado em Engenharia de Produção) - Programa de Pós-Graduação em Engenharia de Produção, UFRGS, Porto Alegre.
ECHEVESTE, M.E.;GIACOMINI, G. O impacto econômico da compra de touros melhoradores. Disponível em: <http:// www.paginarural.com.br/artigos_detalhes.php?id=1217>. Acesso em: 1/4/2008.
GIACOMINI, G. [2006] O impacto econômico da compra de touros melhoradores. Disponível em: <http:// www.paginarural.com.br/artigos_detalhes.php?id=1217>. Acesso em: 1/4/2008.
GIL, A.C. Como elaborar projetos de pesquisa. 3.ed. São Paulo: Atlas, 1991. 102p.
KILLEN, C.P.; WALKER, M.; HUNT, R.A. Strategic planning using QFD. International Journal of Quality & Reliability Management, v.22, n.1, p.17-29, 2005.
LEPREVOST, J.; MAZUR, G. Quality infrastructure improvement: QFD to manage project priorities and project management resources. International Journal of Quality & Reliability Management, v.22, n.1, p.10-16, 2005.
LÔBO, R.N.B.; MADALENA, F.E.; PENNA, V.M. Avaliação de esquemas de seleção alternativos para bovinos zebus de dupla aptidão. Revista Brasileira de Zootecnia, v.29, n.5, p.1361-1370, 2000.
MARSOT, J. QFD: a methodological tool for integration of ergonomics at the design stage. Applied Ergonomics, v.36, n.2, p.185-192, 2005.
MIGUEL, P.A.C. Evidence of QFD best practices for product development: a multiple case study. International Journal of Quality & Reability Management, v.22, n.1, p.72-82, 2005.
PILAU, A.; LOBATO, J.F.P. Desenvolvimento e desempenho reprodutivo de vacas primíparas aos 22/24 meses de idade.
R e v i s t a B r a s i l e i r a d e Z o o t e c n i a, v.38, n.4, p.728-736, 2 0 0 9 .
RIBEIRO, J.L.; ECHEVESTE, M.E.; DANILEVICZ, A.F. A Utilização do QFD na otimização de produtos, processos e serviços. Porto Alegre: FEENG, 2000. 94p.
ROSADO JÚNIOR, A.G.R; LOBATO, J.F.P. Application of a model of management by macroprocesses to a beef cattle enterprise: a case study. Revista Brasileira de Zootecnia, v.38, n.11, p.2280-2288, 2009.
SCHIFFMAN, L.; KANUK, L. Comportamento do consumidor.
6.ed. Rio de Janeiro: LTC Editora, 2000. p.27.
VAZ, R.Z.; LOBATO, J.F.P. Efeito da idade do desmame no desenvolvimento de novilhas de corte até os 14/15 meses de idade. Revista Brasileira de Zootecnia, v.39, n.2, p.289-298, 2010.