Production of Nanometric Bi
4Ti
3O
12Powders: from Synthesis to Optical and Dielectric
Properties
Jeferson Almeida Diasa* , Jéssica Ariane Oliveirab, Carmen Greice Rendaa,
Márcio Raymundo Morellia
Received: February 15, 2018; Revised: April 28, 2018; Accepted: June 08, 2018
This paper aims to evaluate the synthesis and annealing parameters for production of nanometric Bi4Ti3O12 and its properties. The powders were obtained through the solution combustion route and the impacts of annealing temperature on the materials’ physicochemical features as well as their optical and electrical properties were investigated. Thus, the prepared powders were annealed at 600ºC, 700ºC and 800ºC and then characterized by several techniques. The results demonstrated that the combustion
method was effective for production of nanocrystalline powders with high levels of purity. A trend
for particle and crystallite growth was observed as the calcination temperature increased. X-Ray,
HRTEM and Raman spectroscopy confirmed the crystalline nature of the powders, whereas impedance
spectroscopy demonstrated a reduction of electrical resistance according to the calcination temperature
applied. Optical properties were not highly influenced by annealing. The temperature of 600ºC was
appropriate to produce crystalline particles with desirable low sizes for application.
Keywords: nanotechnology, spectroscopy, annealing, synthesis, thermal etching.
*email: [email protected]
1. Introduction
Nowadays, many efforts have been made in order to
develop new lead-free optoelectronic materials1,2. Among them,
bismuth titanates have demonstrated promising optoelectronic properties3, such as ferroelectricity, photoconductivity and
piezoelectricity1,4-6. These characteristics make them an
alternative to lead-containing materials, being useful for several devices including optical displays, capacitors, catalysts, sensors and transducers, among other applications7-15.
The Bi4Ti3O12 compound belongs to the Aurivillius family5,9,16,17 and it has been studied due to its promising
piezoelectric and dielectric properties1. Based on this material,
piezoelectric and pyroelectric devices have been produced to be utilized in a broad range of temperatures5. A highly
anisotropic layered structure is characteristic of that material, in which the (Bi2O2)2+ fluorite-sheets are periodically arranged
with the (Bi2Ti3O10)2‒ pseudoperovskite-sheets3,5,6,9,10,12,18-21
along the c-axis22. This phase presents a significant thermal
stability, which melts around 1200ºC4,23.
Different synthesis routes have been proposed for
production of bismuth titanates and related materials. Methods such as sol-gel3, polymeric precursors24, high
energy milling25,26, hydrothermal10,18,27 and coprecipitation6,9
have been assessed for their production. In addition, the use of the solution combustion route has been reported in some studies with promising results20,22. In this chemical synthesis
method, a self-induced high temperature is attained by an exothermic reaction based on a homogeneous mixture of
metal salts and fuel. In addition to the relative ease and short time required for the synthesis, the properties of the synthesized powders are commonly quite superior to the ones produced by conventional routes20.
Among existing techniques of Bi4Ti3O12 synthesis, traditional procedures as the mixing of powders have been avoided due to the bismuth volatilization1,8. The long periods
of time at high temperatures can cause significant volatilization of this element, impacting on the material’s final properties.
Moreover, repetitive stages of grinding and calcination are necessary to attain a satisfactory chemical homogeneity of the powders, which can be considered onerous compared to the other chemical routes of synthesis.
Besides these considerations, the production of Bi4Ti3O12 compound in nanometric scale is highly desired28 in order to
increase the powders’ surface area and related properties. It has become crucial to applications involving direct use of the powder, such as in case of catalysts8. Moreover, some
properties can be greatly improved when the material is composed by nanocrystals29. The nanometric scale can also
allow greater ease of sinterization, promoting the ceramic
body densification even at low firing temperatures1.
Despite the remarkable importance of controlling the particle sizes and crystallinity of nanometric Bi4Ti3O12 powders, a systematic study correlating these features with annealing temperature; optical and electrical properties has not been reported yet. In this context, this work aims at evaluating the parameters of synthesis and calcination temperatures for production of nanometric Bi4Ti3O12 powders by means of aDepartamento de Engenharia de Materiais, Universidade Federal de São Carlos, São Carlos, SP,
Brasil
solution combustion route, analyzing their physicochemical features and properties.
2. Methodology
The powders were obtained through solution combustion route and the annealing temperature subsequent to the ignition was assessed in order to produce nanometric powders with optimal physicochemical characteristics. The conditions of synthesis and characterizations utilized in this work are better described in the following topics.
2.1. Synthesis
The synthesis of Bi4Ti3O12 powders was performed by the solution combustion route. Stoichiometric amounts of titanium (IV) bis (ammonium lactato) dihydroxide (Sigma-Aldrich, 50% wt aqueous solution) and bismuth (III) nitrate pentahydrate (Sigma-Aldrich, 98%) were mixed and disposed in porcelain crucible. Urea (Synth, 98%) was chosen as the fuel, based on the good relationship between its heat of combustion (10.2 kJ.g-1) and low decomposition
temperature (135ºC) when compared to other ones such as glycine and citric acid30. These characteristics allow the
flame generation and also prevent non-reacted fuel remains
after the synthesis.
The quantity of urea could be estimated by means of the ratio31,32:
When φ equals unity, the quantity of fuel is in stoichiometric
proportion. It can provide a large generation of gases and
high flame temperature, which increases the powders crystallinity and surface area. Values of φ less than unity
commonly culminate in a lower combustion temperature since the quantity of fuel is not enough for the complete
reaction. On the other hand, when φ values are much
higher than the unity, the reaction becomes incomplete due
to the insufficient quantity of oxygen in the atmosphere31.
It also reduces the temperature of the flame and facilitates
the excess of reactants remaining on the powders surfaces after synthesis.
Therefore, a stoichiometric quantity of urea was mixed to the precursor salts and they were vigorously stirred in aqueous medium for 30 min at about 80ºC. Afterwards, water excess was eliminated at 100ºC also under magnetic stirring; and the viscous solution was then introduced in a partially opened EDG 3000 oven at 600ºC for ignition.
After the end of reaction (extinction of the flame), the
remaining powders were maintained at 600ºC for 15 minutes in order to eliminate excessive amounts of residual organic matter and precursors salts partially decomposed. Then, the
prepared powders were annealed at different temperatures
(600ºC, 700ºC and 800ºC) for one hour. This procedure
aimed for the determination of the optimal calcination temperature to eliminate residual organic matter, as well as for a systematic evaluation of its impacts on the powders’ crystallinity and particle sizes. The samples calcinated at
600ºC, 700ºC and 800ºC were named 600‒1, 700‒1 and 800‒1 respectively. It is noteworthy that an additional sample, 600‒0, also was evaluated in this study. It refers
to the powder synthesized (600ºC for 15 minutes) without subsequent additional annealing.
2.2. Characterization
The powders' crystallographic properties were evaluated
by the X-Ray diffraction technique (XRD). The analyses were performed in the Shimadzu XRD6000 diffractometer
with Cu Kα radiation between 5º and 80º, 1º.min‒1. Rietveld
refinement was used to acquire the structural parameters of the synthesized phase. The GSAS‒EXPGUI software (ICDD card nº. 73‒2181) was used. For these analyses,
micrometric yttrium oxide (Sigma Aldrich, 99.99%) was used as the pattern; instrumental parameters were acquired by the Le Bail method. The crystallite sizes were estimated by means of the Williamson-Hall methodology.
The surface area was determined by nitrogen physisorption
(BET) in the Micromeritics ASAP 2020 equipment at 77 K. Purity of the samples was assessed by X-Ray fluorescence
utilizing a Shimadzu EDX-720 equipment. The morphology and particle sizes were observed by means of Scanning Electron Microscopy (SEM). A JEOL JSM 6701F microscope was
used under magnifications of 200 thousand times.
The presence of residual organic matter and phase transition
were evaluated by Differential Scanning Calorimetry and
Thermogravimetric Analysis (DSC/TGA). The same was done simultaneously in a Netzsch STA 449F3 equipment under argon atmosphere. The samples were disposed into the
Pt-Rh crucibles and a sapphire disk was used as a reference.
Furthermore, as a complementary analysis, infrared absorption technique (FTIR) was performed by an Agilent Technologies Cary 630. The analyses were performed between 4000 cm-1 and 650 cm-1.
High Resolution Transmission Electron Microscopy (HRTEM) was carried out by a TECNAI G2F20 microscope.
Electron diffraction patterns were acquired by the same
equipment.
The optical properties were evaluated by Diffuse Reflectance Spectroscopy (DRS). The analyses were carried
out in a Varian Cary 5G spectrophotometer between 250 nm and 800 nm.
Micro-Raman spectra were obtained by means of a
Horiba Labram HR spectrophotometer. Magnifications of 50
times were used with a focusing area of 100 µm2. A He-Ne
laser (632.8 nm) without filter (17 µW) was applied. Silicon
was used as the pattern. The analyses were performed in triplicate, between 100 cm-1 and 1000 cm-1.
total valence of oxidizer
total valence of fuel
In order to observe the ceramics microstructure after
sinterization, fired pellets were produced. First, the powders were uniaxially pressed in a steel mold (5 kPa, 10 mm x 2
mm approximately) and heated at 1000ºC for one hour. The heating and cooling rates applied were 1ºC.min‒1. To avoid bismuth volatilization, the green pellets were covered with
sacrifice powders with the same composition.
To reveal the grains’ morphologies, the ceramics were polished and thermally etched at 900ºC for 15 min, also under
sacrifice powders. The ceramic surfaces were then covered
with gold by sputtering. After that, their microstructures were analyzed by SEM using a FEI Magellan 400L under
magnifications of 100 thousand times.
The electrical responses of the ceramic pellets were acquired by Impedance Spectroscopy technique (IS) in a Solartron SI 1260 impedanciometer coupled with a Solartron 1296 dielectric interface. The measurements were performed between 1 MHz and 500 mHz; alternate current amplitude of 100 mV and at temperature range of 25ºC-350ºC. Gold was used as an electrode deposited by sputtering.
3. Calculation Procedures
To evaluate the electrical and optical performance of the materials, some physicochemical models are required. These equations and their meanings are described in the sequence below.
3.1. Electrical properties
The real Z’ and imaginary Z” parts of impedance measurements can be represented by the Nyquist complex-plane for several values of frequency. Based on the vector
nature of impedance ‒ Z(ω) = Z’ + jZ”, in which ω is the
angular frequency and j the complex number ‒ the electrical responses can also be plotted under polar coordinates (Bode diagram). For such, the following transformations are useful33:
Where ɸ is the phase angle and |Z| the impedance modulus.
Immitance functions can be used to emphasize electrical
phenomena which were not clearly defined only by Nyquist
or Bode diagrams33,34. Among them, the modulus M = M’ +
jM” can be defined by the following equation33-35:
Were C0 is the capacitance of the empty cell (C0 = ε0 A/l, in which A is the area of electrodes and l the distance between them34). The parameter ε
0 is the dielectric permittivity of the free space, 8.85. 10-12 C2N-1m-2.
The dielectric permittivity ε = ε’ + j ε” is another derived quantity of impedance that is quite important to characterization of dielectrics36. The immitance function
for ε is defined by means of the ratio33,34:
Therefore, the complex dielectric constant can be estimated by inversing the modulus, i.e., ε = M -1.
3.2. Optical properties
The optical band gap can be estimated by the Tauc’s plot37
,
38 and McLean analysis of absorption edge39. It can
be achieved by following the equation40-42:
Where α is the absorption coefficient, h is the Plank
constant and ν the photon frequency. The parameter B is a constant dependent on the material’s physicochemical characteristics and Eg is the optical band gap40. The parameter
n can assume different values according to the nature of
transition. Usually, n = 2 is applied in indirect transitions and n = 0.5 in direct ones40,41.
Thus, the parameter Eg can be estimated by plotting
(αhν)2 versus the photon energy and extrapolating the straight line to α = 042, known as Tauc plot. Diffuse reflectance
measurements R∞ can be converted into a magnitude proportional to absorption F(R∞) by applying the Kubelka-Munk function43,44:
The scattering factor S is almost independent from radiation wavelength. Hence, it can be neglected for this analysis. Therefore, this transformation allows the use of
diffuse reflectance for measurement of the optical band
gap of powders.
4. Results and Discussion
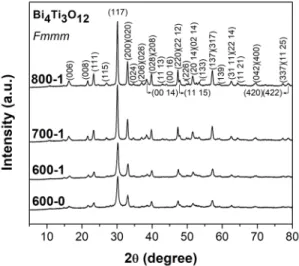
X-ray diffraction patterns of the samples are presented on the Figure 1. Even though the XRD diffractograms for different compounds into the TiO2-Bi2O3 system seem to be
quite similar, all the peaks were indexed to the Fmmm structure according to the crystallographic card previously cited.
It can be observed that the Bi4Ti3O12 compound was formed even in absence of annealing subsequent to the synthesis. In comparison, Subohi et al8 reported the production
of bismuth titanate (selenite structure) achieved also by the combustion route using TiO2 as the titanium source. After ignition at 450ºC, the remaining powder was non-crystalline. The same characteristic was obtained for their posterior study1, where the synthesized powders presented amorphous
tan
Z
Z
1
U
=
-l
m
Z
=
Q
Z
l
V
2+
Q
Z
m
V
2M
=
j C Z
~
0j C Z
1
0
f
~
=
h
B h
Eg
na y
=
R
y
-
W
F R
S
1
2
R
R
2
a
=
=
-3 3 3structure after the ignition. Therefore, the crystalline powder obtained for the prepared powder at this study indicates that the metal precursors and fuel quantity were satisfactory in order to produce crystalline powders even in the absence of subsequent annealing.
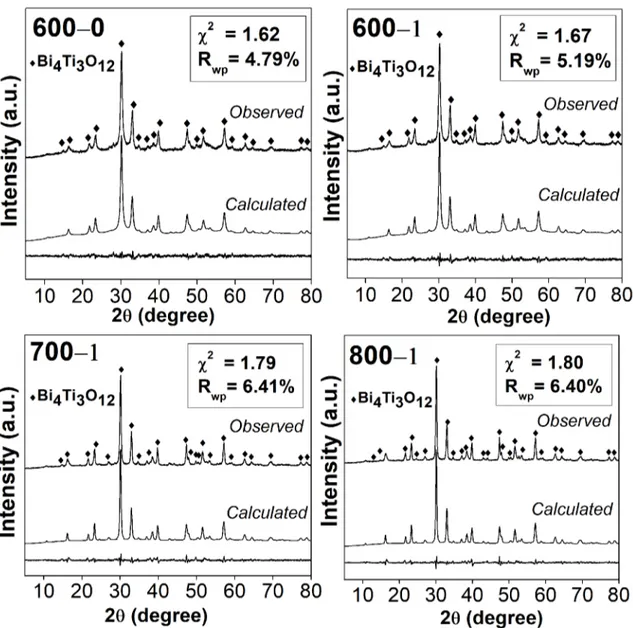
The indexed phase has a highly anisotropic orthorhombic structure, space group Fmmm. The profiles adjusted by
Rietveld refinement, as well as the parameters χ2 and R wp are presented on Figure 2. Satisfactory adjusts were obtained taking into account the low values attained for the parameter
Rwp, and χ2 close to the unity. Moreover, no remarkable
difference between experimental data and adjusted profiles
was observed.
The broadening of the diffraction peaks decreases with
the increment of the annealing temperature. It is related to the growing of the crystallites, which can also occur in the particle sizes. In order to assess this phenomenon, Table 1 indicates the crystallite sizes estimated for the samples, as
well as the lattice parameters estimated by Rietveld refinement
and surface area.
The lattice parameters were close to those reported by the crystallographic card previously cited (5.41 Å, 5.45 Å and 32.84 Å for a, b and c respectively), which emphasizes
that the structure utilized for the Rietveld refinement was
suitable. Moreover, according to the Table 1 the powders presented nanometric crystallites sizes for all the conditions of annealing, which may be an indicative of small particle sizes. A tendency for increment of the crystallites according to the annealing temperature was observed. The sample treated at 800ºC, for instance, presented average crystallite size of 70 nm, which is close to three times larger than the
samples treated at 600ºC (600‒0 and 600‒1).
Regarding the materials annealed at 600ºC, the sample
600‒1 showed crystallite size greater than the powder without subsequent thermal treatment (600‒0). Therefore, even in
relative low values of temperature (600ºC), annealing for one hour was enough time to promote crystallite growth.
These results are relevant due to the fact that crystallites in nanometric scale can be considered as an indicative of small particle size. This characteristic can facilitate the sintering
process and it enables the obtainment of fine grains after
the processing. The sizes obtained for the crystallites are slightly larger than the ones related to High Energy Milling process (10 - 17 nm)25 and considerably smaller than those
obtained in hydrothermal synthesis when utilizing raw oxide as precursors (197 - 242 nm)10.
Concerning the surface area, this parameter was gradually reduced according to increment of temperature. The value
regarding the sample 600‒0 is 10.41 m2.g‒1, which is much
higher than the value obtained for the 800‒1 (5.73 m2.g‒1).
This fact is probably a result of the particle growth promoted by the thermal treatment.
To evaluate the powders purity, the quantitative results of
X-Ray fluorescence are indicated on Table 2. It is noteworthy
that the powders are mainly composed by bismuth and titanium cations as expected for the Bi4Ti3O12 phase. The measured weight percentage of these ions was also in good agreement with those values expected for Bi4Ti3O12 compound (85.34% and 14.66% for Bi3+ and Ti4+ respectively, taking
into account only the cations from the structure). Inorganic impurities arising from the precursor salts such as thorium and iron ions might be found in the samples, however in low quantity (lower than 1% wt).
Figure 3 shows the SEM micrographs under magnifications
of 200 thousand times. Nanometric particles were observed for all conditions of annealing, arranged in soft-agglomerates. The tendency of particle growth according to the temperature was observed, while the same behavior was observed for the crystallite sizes. The average values of particle size observed by SEM micrographs were 39; 61; 89 e 132 nm
for the samples 600‒0, 600‒1, 700‒1 e 800‒1, respectively. These results confirm that the powders are nanometric and
the temperature of annealing highly impacts particles and crystallite sizes.
The nanometric particles observed in the powders are
justified by the characteristics of the solution combustion method: the energy provided by the flame is rapidly dissipated
after its extinction. Thus, the particle coalescence and growth is interrupted by the reduction of the atomic mobility.
Concerning the morphological characteristics, the particles are elongated arising from the anisotropic structure; and most of them present plate-like morphology, which is characteristic of Bi4Ti3O12 powders18,20.
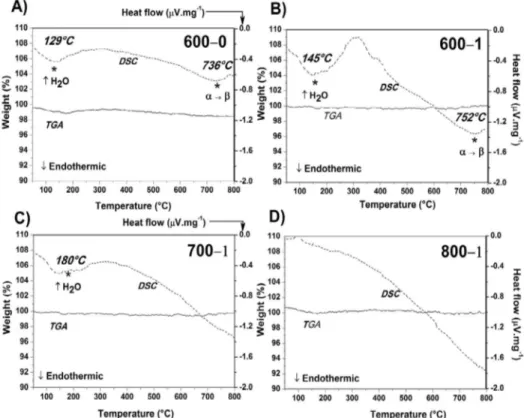
The thermal behavior of the samples was assessed by simultaneous DSC/TGA analyses. The results are shown
in Figure 4. Regarding the DSC profiles, two endothermic phenomena were identified. The first occurred around 150ºC
and it is usually related to elimination of adsorbed water. Nevertheless, the amount of adsorbed water is probably quite
Figure 1. XRD patterns of Bi4Ti3O12 powders synthesized by
Figure 2. Graphical results of Rietveld refinement for the samples according to the temperature of annealing
Table 1. Crystallite size, lattice parameters and surface area of the synthesized powders.
D (nm) a (Å) b (Å) c (Å) Surface area (m2.g‒1)
600‒0 18 5.4281(5) 5.4358(2) 32.688(3) 10.41
600‒1 24 5.4267(4) 5.4326(2) 32.704(2) 9.37
700‒1 49 5.4240(2) 5.4302(2) 32.741(1) 6.21
800‒1 70 5.4252(2) 5.4306(1) 32.750(1) 5.73
low due to the fact that this event is not strongly detected
in the TGA profiles.
Regarding the second phenomenon, it can be visualized at around 750ºC (DSC) without mass loss. This event is attributed to crystalline conversion from tetragonal to orthorhombic structure, which was previously reported by Martinez et al4 and Thongtem et al9. However, this result is
Table 2. Quantitative results of X-Ray fluorescence (% wt) for the samples.
Sample Bi Ti Th Fe
600-0 83.72 15.50 0.68 0.10
600-1 83.77 15.56 0.57 0.10
700-1 83.82 15.54 0.54 0.10
Figure 3. SEM micrographs of Bi4Ti3O12 powders synthesized by combustion reaction and thermally treated at
different temperatures: A) 600‒0; B) 600‒1; C) 700‒1; and D) 800‒1. Magnification of 200 thousand times
only observed for the samples heat-treated at 600ºC. Therefore,
it is possible that small quantities of tetragonal‒Bi4Ti3O12
could have remained in these samples but were not clearly detected by XRD.
With respect to TGA profiles, no significative mass loss
could be visualized for all the samples. This fact indicates that basically the whole amount of volatile components were eliminated during the synthesis even in short periods of time
(15 min, sample 600‒0) and at relative low temperatures.
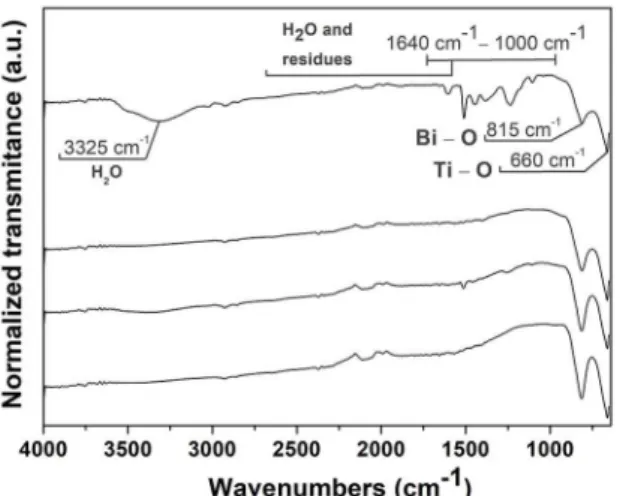
To complement the results acquired by thermal analyses, the powders were analyzed by FTIR technique (Figure 5). Bands can be visualized at around 3325 cm‒1, which are more
intense for sample 600‒0 and are related to water adsorbed
on the particles surfaces. Furthermore, two bands common for all samples occurred approximately in 815 cm‒1 and 660 cm‒1. In fact, infrared active modes are expected taking into account the elements and structure of the Bi4Ti3O12 material45.
They correspond to the Bi‒O and Ti‒O stretching vibration
respectively46,47. These bands are therefore characteristic of
the Bi4Ti3O12 material.
Furthermore, low intense bands can be visualized for the
sample 600‒0 between 1640 and 1000 cm-1. These bands are
related to water and residual molecules from the partially decomposed precursors, which remained adsorbed on the surface of particles. The probable infrared interactions and their respective groups present on the samples are
the O‒H stretching, arising from the free adsorbed water
(close to 1500 cm‒1); NO2, arising from the nitrate precursors (1200 cm‒1 ‒ 1000 cm‒1); and C‒H stretching, arising from the organic subproducts of the titanium precursor (1200 cm‒1 ‒ 800 cm‒1)48.
These bands disappeared for the sample annealed for one hour at 600ºC, as well as for samples annealed at higher temperatures. These results corroborate that, even in low quantity (undetectable by thermogravimetric analysis), there are traces of residual volatiles arising from the precursors
for the sample 600‒0.
The absence of bands in that range of wavenumbers (1640 cm‒1 ‒1000 cm‒1) for the samples 600‒1, 700‒1 and
800‒1 indicates that residual volatile matter was continuously
being eliminated by the annealing treatments subsequent to synthesis. Thus, the temperature of 600ºC for one hour was
efficient in completely eliminating the residual precursor
molecules of the material.
The presence of residues on the powders surface can be
insignificant for applications that require subsequent thermal treatment − production of sintered ceramic devices such as capacitors, for instance ‒ or can be crucial to applications
that require direct use of the powders, such as some types of catalysts49 and sensors. For the second situation, the
active sites of the particles may be blocked by the organic
molecules, limiting their efficiency50.
The optical properties were evaluated by means of DRS technique. The results are indicated on Figure 6. It
is noteworthy that two distinct regions define the diffuse reflectance spectra. The first one occurs in wavelengths lower than 360 nm, approximately. In this case, the diffuse reflection is low, indicating that radiation absorption has been
occurring intensively. On the other hand, on the second region
related to wavelengths higher than 400 nm the reflection
seems to be very high, indicating that the photons absorption follows the opposite behavior. Hence, the samples are not
able to significantly absorb photons from the visible and
near-infrared spectra.
For wavelengths between 360 and 400 nm, approximately,
a transition of low-to-high diffuse reflectance can be observed,
indicating that the optical band gap has been reached. To better evaluate this phenomenon, inset of Figure 6 presents the Tauc’s plot for the samples. It is noticed that the tangent for the (F(R∞ )hν)2 function intercepted similar values of energy, around 3.2 eV, in good agreement with recent reports51.
The band gap energy for dielectrics usually corresponds to the electron transference from the completely occupied anion valence subshell to the unoccupied cation ones52.
Figure 5. FTIR spectra of the synthesized samples
Specifically for Bi4Ti3O12, it is attributed to the electron
transference from a combination of Bi‒6s and O‒2p levels to Ti‒3d ones53,54. Therefore, these results indicated that the
annealing subsequent to the synthesis was not significant as
to impact the materials’ band gap.
The structural orders at short and medium ranges were evaluated by micro-Raman technique; the results are shown in Figure 7. Several characteristic modes for the Bi4Ti3O12 can be observed between 100 cm‒1 and 1000 cm-1. The
spectra may be divided in two distinct regions: above 227 cm‒1, related to internal phonon modes of TiO6 octahedrons from the pseudoperovskite-type sheets (A1g, Eg and F2u
normal octahedron modes are Raman actives45); and below
186 cm-1, attributed to the translation modes of Bi and Ti
sites55,56. Table 3 relates these modes with their respective
structural assignment.
As shown on the inset of Figure 7, the samples treated at 600ºC presented the same phonon modes than the others. This indicates that crystalline Bi4Ti3O12 was formed even at this temperature, which corroborates with XRD and FTIR
results. However, the intensity of the modes significantly
increased according to the annealing temperature. It can be due to the increasing crystallinity promoted by the thermal treatment, making the signal from the structural assignment more intense. The increment in phase crystallinity with the annealing temperature is also in agreement with the results observed at XRD (Figure 1).
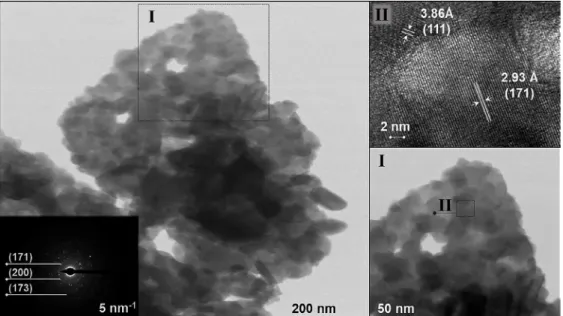
Based on results of particle sizes and crystallinity, the temperature of 600ºC has demonstrated the best conditions for bismuth titanate production. To better evaluate the powders’ crystallinity and morphology at this temperature, Figure 8
shows the HRTEM for the sample 600‒1. Nanometric crystals with sizes at about 50 nm were observed, confirming the
nanocrystalline nature of the samples.
Figure 7. Micro‒Raman spectra of the synthesized samples. Inset focuses samples annealed at 600ºC
Table 3. Raman phonon modes and their respective structural assignments.
Wavenumbers
(cm‒1) Structural assignment
116; 146; 186 Bi into the fluorite–type sheets
38 ;
translational modes of Bi and Ti39.
227 TiO6 bending and tilting39,40.
269 O‒Ti‒O bending vibration38.
328 TiO6 octahedron bending–stretching and
tilting39,40.
537 TiO6 octahedron stretching
39–41.
615 O‒Ti‒O into (Bi2Ti3O10) 2- blocks40.
848 Symmetric Ti‒O vibration38,41.
Figure 8. High Resolution Transmission Electrons Microscopy (HRTEM) and Electron Diffraction pattern for sample 600‒1
Electron diffraction demonstrated distinct spots, which is
confirming that this layered compound was produced.
Interplanar distances of 2.93 and 3.86 Å related to (171) and (111) planes, respectively, were measured. They are quite close to the ones reported by the ICDD card previously cited (2.97 and 3.81 Å).
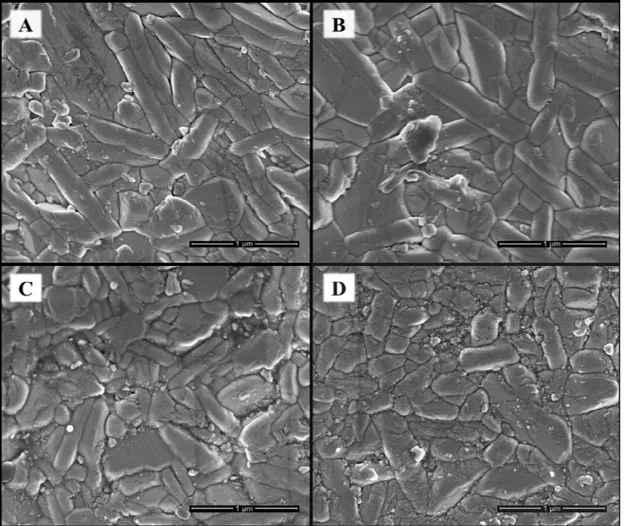
Fired pellets were produced in order to evaluate the materials’ microstructure after sintering. Coverage with
sacrificing powder is quite important to avoid bismuth
volatilization at high temperatures (1000ºC). The SEM
micrographs at magnification of 100 thousand times are presented on Figure 9. It is observed that fine grains, in
sub-micrometric scale, are found in all samples. No evident alteration in the grain sizes after sintering according to the annealing temperature utilized for the powders preparation was observed (spherical equivalent diameter around 0.5 µm).
Only a few numbers of pores were observed, indicating
satisfactory densification even under low values of temperature and time of firing process (1000ºC during 1 h). This result
is probably a consequence of the nanometric sizes of the powders. The grains presented anisotropic morphology as
Figure 9. SEM micrographs of polished and thermally etched surface of sintered samples at 1000ºC/1h from Bi4Ti3O12 powders: A) 600‒0; B) 600‒1; C) 700‒1; and D) 800‒1. Magnification of 100 thousand times
a result of their highly anisotropic structure ((117)-plane preferentially oriented). The plate-like shape was observed for all samples after sintering, which is characteristic of the Bi4Ti3O12 material.
To evaluate the electrical performance of the ceramic pellets, the electrical properties were assessed by IS. The results are shown in Figure 10. The samples have presented high electrical resistivity at room temperature (above 10
GΩ). Complete semicircles could be observed in Nyquist
plots only for temperatures above 250ºC (Figure 10-A). It is noteworthy that the temperature utilized for the annealing
affected the electrical performance after sintering significantly.
The sample 600-0 has demonstrated the highest resistance at 250ºC, at about 1.8x10⁸ Ω, which decreased to 1.2x10⁸ Ω.cm
for 600-1 and 1.3x10⁷ Ω.cm for 700-1. The sample 800-1
demonstrated the lowest electrical resistivity, 9x10⁵ Ω.cm,
Figure 10. Electrical responses of Bi4Ti3O12 ceramics: A) Nyquist plot comparing the samples at 250ºC; B) Bode diagram of sample
600-0 (logarithmic scale). Inset displays the phase angle ɸ according to frequency
Therefore, these results suggest that the electrical
resistance is highly affected by the temperature and time of
annealing applied in the stage of powders preparation. Since the microstructure is very similar for all the samples (see Figure 9), this phenomenon may be explained by the creation of point defects. Bismuth vacancies VBi’’’ generated by the
volatilization of this element impose the creation of oxygen vacancies VO•• to maintain the charge neutrality22,36,52. These
charged defects can reduce the electrical resistivity, which may culminate in leakage current and domain pinning24.
To better evaluate the materials’ electrical performance according to temperature of measurements, Figure 10-B shows the Bode diagram for the most resistive sample (600-0). A continuous reduction of the electrical resistance with increment of temperature is evident, displaying a non-metallic conduction behavior that is characteristic of dielectrics36. It is
noteworthy that the phase angle ɸ (shown on inset of Figure
10-B) does not vary from 90 to 0º, indicating the presence of more than one arc contributing to the global resistance33.
Hence, some distortions in the impedance modulus together
with non-defined plateaus at phase angle can be observed.
High resistivity phenomena in the Nyquist diagram can overlap the impedance semicircles, limiting data interpretation. In this case, electrical modulus may help understand the
electrical measurements. Whereas the Z (ω) focuses on higher resistivity phenomena, M (ω) focuses on the lower capacitive
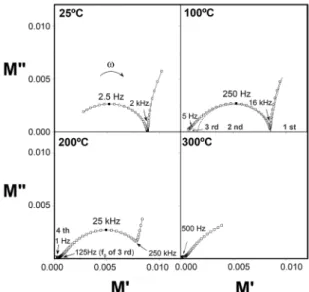
ones34. This way, Figure 11 shows the modulus formalism
for sample 600-0 according to increment of temperature. It is noteworthy that even at room temperature (25ºC), two
distinct arcs can be visualized. The first at high frequency
(incomplete, occurring at frequencies above 2 kHz) and the
second, better defined, with relaxation frequency of 2.5 Hz. When temperature increases to 100ºC, the whole profile is
displaced to higher values of frequency and a third semicircle appears at lower values of frequency. Literature studies
Figure 11. Results of modulus immitance for sample 600–0 according to temperature of measurements.
have demonstrated that impedance data related to bismuth titanates are quite complex; therefore, several semicircles are indeed expected. According to recent reports57,58, the
first semicircle at higher frequencies can be attributed to
crystalline plate, followed by plate boundary and grain boundary, respectively. Moreover, when temperature achieves 200ºC, a fourth arc appears in the modulus diagram for lower values of frequency. Based on its high capacitance (greater than 10-8 F), this semicircle is attributed to the electrode57.
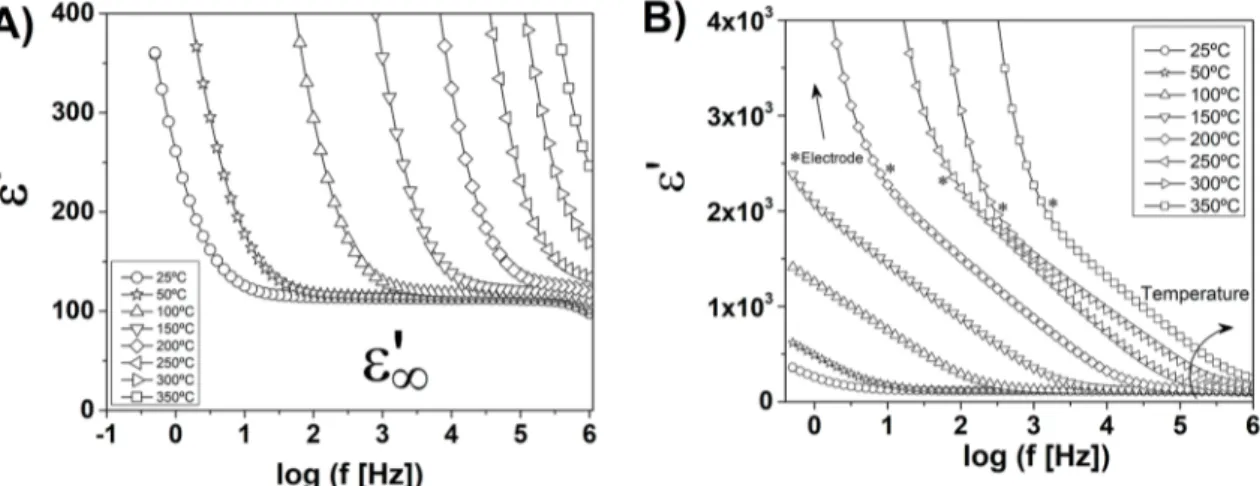
Once the main phenomena that contribute to electrical properties are known, the dielectric characterization could be then evaluated by means of dielectric permittivity. The results for sample 600-0 are shown in Figure 12. It is meaningful
Figure 12. Dielectric permittivity for sample 600–0: A) high frequency phenomena; B) low frequency phenomena.
of events that contribute to the polarization. At higher frequencies (close to 1 MHz, focused in Figure 12-A), electronic, ionic and even orientation polarization contribute to the dielectric constant36. For this condition, ε’ seems to
be close to 115 (25ºC, 1 MHz), which agrees with previous reports from literature59. Since the temperature does not
significantly affect the ionic and electronic polarization36,
ε’ does not considerably increase with temperature at high
values of frequency.
The dielectric constant considerably increases by reducing
the frequency of electric field (Figure 12-B). At 25ºC for instance, ε’ increases from 115 (1 MHz) to 360 (500 mHz).
It can be explained by the space charge creation, attributed to the movement and accumulation of charged carriers in the interfaces. Since the concentration and movement of point defects decisively increase with temperature, the dielectric constant containing space charge contribution follows the same trend36. The results have revealed, for example, that ε’
at 500 mHz increased from 360 (25ºC) to 2.4x10³ (150ºC).
It is possible to notice a low inflexion in the ε’ profile
at low frequency (marked in Figure 12-B with an asterisk),
followed by an indefinitely growth of the dielectric constant.
This phenomenon was more evident at higher temperatures. Comparing to the modulus results and recent reports from literature57, it can be attributed to the electrode.
Therefore, several properties were evaluated in this work. In summary, the optical properties don’t seem to be
very influenced by the temperature of annealing, whereas the
electrical resistivity, particle size, powder’s crystallinity and surface area are highly impacted. It occurs because temperature provides energy for atom mobility, which culminates in particles growth and consequent reduction of surface area, accompanied by an increment of the materials crystallinity. However, point defects are concomitantly created arising from bismuth volatilization, which reduces the electrical
resistance of the final product. Higher values of temperature
also provide energy to eliminate volatile residues and to
convert small quantity of tetragonal phases to orthorhombic, which can also be formed at the synthesis stage.
Thus, Figure 13 presents a summary of the main physicochemical characteristics and their tendencies evaluated. The choice of the best condition of synthesis and calcination
temperature can be made taking into account the specific requirements from the final application.
Figure 13. Summary of the main properties and their tendencies according to calcination temperature utilized in the synthesis stage.
5. Conclusions
In this work, the synthesis parameters and annealing temperature to produce nanometric Bi4Ti3O12 powders by the solution combustion route were evaluated. Beyond that, the samples structure; and optical and dielectric properties were analyzed. It was observed that the combustion synthesis
Bi4Ti3O12 powders. An evident tendency for particle size growth was observed by increasing the calcination temperature after the combustion reaction.
Powders were crystalline even in absence of subsequent
annealing. In this case, traces of volatile matter arising from the precursor salts and fuel, which were completely eliminated by the annealing (600ºC for 1 h was enough for this), remained in the prepared powder. Moreover, at this temperature (600ºC) it is possible that a low quantity of tetragonal phase remains in the samples, which is completely converted to orthorhombic at higher temperatures. The crystalline nature
of the powders could be confirmed by characteristic Raman
modes and HRTEM technique. The optical properties were
not significantly influenced by the heat treatment and the fired ceramics presented sub-micrometric grain sizes. The
ceramic pellets have presented high electrical resistance, which is gradually reduced according to the temperature of annealing. For further work, anisotropy in these properties may be considered.
Therefore, the temperature of 600ºC has presented the best results for production of nanometric Bi4Ti3O12, under the experimental conditions, when low particle sizes are required. Depending on the application, the annealing procedure can be employed as to modify the powders characteristics required for the application.
6. Acknowledgments
The authors thank CAPES for financial support; UNIFAL‒MG, UNESP, Embrapa - Instrumentation (Dr. Elaine Cristina Paris; MSc. Viviane Faria Soares and MSc. Silviane Hubinger) and DEMa (Prof. Dr. Ana Candida
Martins Rodrigues and Dr. Rosário Suman Bretas) for technical assistance. Moreover, the authors would like to thank the Laboratory of Structural Characterization- LCE/ DEMa/UFSCar for the use of general facilities. The authors
declare that this research has no conflict of interest.
7. References
1. Subohi O, Kumar GS, Malik MM, Kurchania R. Dielectric properties of Bismuth Titanate (Bi4Ti3O12) synthesized using solution combustion route. Physica B: Condensed Matter. 2012;407(18):3813-3817.
2. Herrera-Pérez GH, Castillo-Sandoval I, Solís-Canto O, Tapia-Padilla G, Reyes-Rojas A, Fuentes-Cobas LE. Local piezo-response for lead-free Ba0.9Ca0.1Ti0.9Zr0.1O3 electro-ceramic by switching spectroscopy. Materials Research. 2018;21(1):e20170605. DOI: http://dx.doi.org/10.1590/1980-5373-mr-2017-0605
3. Rao AVP, Robin AI, Komarneni S. Bismuth titanate from nanocomposite and sol-gel processes. Materials Letters. 1996;28(4-6):469-473.
4. Lopez-Martinez J, Romero-Serrano A, Hernandez-Ramirez A, Zeifert B, Gomez-Yañez C, Martinez-Sanchez R. Thermal analysis and prediction of phase equilibria in the TiO2-Bi2O3 system. Thermochimica Acta. 2011;516(1-2):35-39.
5. Chen H, Shen B, Xu J, Zhai J. The grain size-dependent electrical properties of Bi4Ti3O12 piezoelectric ceramics. Journal of Alloys and Compounds. 2013;551:92-97.
6. Umabala AM, Suresh M, Prasadarao AV. Bismuth titanate from coprecipitated stoichiometric hydroxide precursors. Materials Letters. 2000;44(3-4):175-180.
7. Shin HW, Son JY. Ferroelectric properties of highly ɑ-oriented polycrystalline Bi4Ti3O12 thin films grown on glass substrates. Journal of Materials Science: Materials in Electronics. 2018;29(3):2573-2576.
8. Subohi O, Kumar GS, Malik MM. Optical properties and preparation of Bismuth Titanate (Bi12TiO20) using combustion synthesis technique. Optik - International Journal for Light and Electron Optics. 2013;124(17):2963-2965.
9. Thongtem T, Thongtem S. Characterization of Bi4Ti3O12 powder
prepared by the citrate and oxalate coprecipitation processes. Ceramics International. 2004;30(7):1463-1470.
10. Thomazini D, Gelfuso MV, Eiras JA. Microwave assisted hydrothermal synthesis of Bi4Ti3O12 nanopowders from oxide as raw materials. Powder Technology. 2012;222:139-142.
11. Fei L, Zhou Z, Hui S, Dong X. Electrical properties of CaBi4Ti4O15-Bi4Ti3O12 piezoelectric ceramics. Ceramics International. 2015;41(8):9729-9733.
12. Santos VB, M'Peko JC, Mir M, Mastelaro VR, Hernandes AC. Microstructural, structural and electrical properties of La3+ - modified Bi
4Ti3O12 ferroelectric ceramics. Journal of
the European Ceramic Society. 2009;29(4):751-756.
13. Zhang J, Huang L, Liu P, Wang Y, Jiang X, Zhang E, et al. Heterostructure of epitaxial (001) Bi4Ti3O12 growth on (001) TiO2 for enhancing photocatalytic activity. Journal of Alloys and Compounds. 2016;654:71-78.
14. Bhange PD, Shinde DS, Bhange DS, Gokavi GS. Solution combustion synthesis of heterostructure bismuth titanate nanocomposites: Structural phases and its correlation with photocatalytic activity. International Journal of Hydrogen Energy. 2018;43(2):708-720.
15. Knyazev AV, Maczka M, Krasheninnikova OV, Ptak M, Syrov EV, Trzebiatowska-Gussowska M. High-temperature X-ray diffraction and spectroscopic studies of some Aurivillius phases. Materials Chemistry and Physics. 2018;204:8-17.
16. Knyazev AV, Krasheninnikova OV, Smirnova NN, Shushunov AN, Syrov EV, Blokhina AG. Thermodynamic properties and X-ray diffraction of Bi4Ti3O12. Journal of Thermal Analysis
and Calorimetry. 2015;122(2):747-754.
17. Lazarevic Z, Stojanovic BD, Varela JA. An Approach to Analyzing Synthesis, Structure and Properties of Bismuth Titanate Ceramics. Science of Sintering. 2005;37:199-216.
19. Prasad NV, Babu SN, Siddeshwar A, Prasad G, Kumar GS. Electrical studies on A-and B-site-modified Bi4Ti3O12 ceramic.
Ceramics International. 2009;35(3):1057-1062.
20. Macedo ZS, Ferrari CR, Hernandes AC. Impedance spectroscopy of Bi4Ti3O12 ceramic produced by self-propagating high-temperature synthesis technique. Journal of the European Ceramic Society. 2004;24(9):2567-2574.
21. Pavlovic N, Koval V, Dusza J, Srdic VV. Effect of Ce and La substitution on dielectric properties of bismuth titanate ceramics. Ceramics International. 2011;37(2):487-492.
22. Krengvirat W, Sreekantan S, Ahmad-Fauzi NM, Chinwanitcharoen C, Kawamura G, Matsuda A. Control of the structure, morphology and dielectric properties of bismuth titanate ceramics by praseodymium substitution using an intermediate fuel agent-assisted self-combustion synthesis. Journal of Materials Science. 2012;47(9):4019-4027.
23. Kargin YF, Ivicheva SN, Volkov VV. Phase relations in the Bi2O3-TiO2 system. Russian Journal of Inorganic Chemistry. 2015;60(5):619-625.
24. Simões AZ, Quinelato C, Ries A, Stojanovic BD, Longo E, Varela JA. Preparation of lanthanum doped Bi4Ti3O12 ceramics
by the polymeric precursor method. Materials Chemistry and Physics. 2006;98(2-3):481-485.
25. Stojanović BD, Paiva-Santos CO, Cilense M, Jovalekić Č, Lazarević ZŽ. Structure study of Bi4Ti3O12 produced via
mechanochemically assisted synthesis. Materials Research Bulletin. 2008;43(7):1743-1753.
26. Berbenni V, Milanesi C, Bruni G, Girella A, Marini A. Synthesis of Bi4Ti3O12 by high energy milling of Bi2O3-TiO2 (anatase) mixtures. Journal of Thermal Analysis and Calorimetry. 2016;126(3):1507-1511.
27. Sun X, Xu G, Bai H, Zhao Y, Tian H, Wang J, et al. Hydrothermal synthesis and formation mechanism of single-crystal Auivillius Bi4Ti3O12 nanosheets with ammonium bismuth citrate (C6H10BiNO8) as Bi sources. Journal of Crystal Growth. 2017;476:31-37.
28. Meenakshi P, Selvaraj M. Bismuth titanate as an infrared reflective pigment for cool roof coating. Solar Energy Materials and Solar Cells. 2018;174:530-537.
29. Tan J, Zhang W, Xia AL. Facile synthesis of inverse spinel NiFe2O4 nanocrystals and their superparamagnetic properties. Materials Research. 2013;16(1):237-241. DOI: http://dx.doi. org/10.1590/S1516-14392012005000157
30. Hwang CC, Wu TY, Wan J. Design and modify the combustion synthesis method to synthesize ceramic oxide powders. Journal of Materials Science. 2004;39(14):4687-4691.
31. Li F, Ran J, Jaroniec M, Qiao SZ. Solution combustion synthesis of metal oxide nanomaterials for energy storage and conversion. Nanoscale. 2015;7(42):17590-17610.
32. Jain SR, Adiga KC, Verneker VRP. A new approach to thermochemical calculations of condensed fuel-oxidizer mixtures. Combustion and Flame. 1981;40:71-79.
33. Barsoukov E, Macdonald JR, eds. Impedance Spectroscopy: Theory, Experiment and Applications. 2nd ed. New Jersey: Wiley; 2005.
34. Sinclair DC, West AR. Impedance and modulus spectroscopy of semiconducting BaTiO3 showing positive temperature coefficient of resistance. Journal of Applied Physics. 1989;66(8):3850-3856.
35. Irvine JTS, Sinclair DC, West AR. Electroceramics: Characterization by Impedance Spectroscopy. Advanced Materials. 1990;2(3):132-138.
36. Kingery W, Bowen H, Uhlmann DR. Introduction to Ceramics. 2nd ed. New York: Wiley; 1976.
37. Tauc J. Optical properties and electronic structure of amorphous Ge and Si. Materials Research Bulletin. 1968;3(1):37-46.
38. Wood DL, Tauc J. Weak Absorption Tails in Amorphous Semiconductors. Physical Review B. 1972;5(8):3144-3151. 39. McLean TP. The absorption edge spectrum of semiconductors.
In: Gibson AL. Progress in Semiconductors. Volume 5. New York: Wiley; 1960. p. 55-102.
40. Tripathi AK, Singh MK, Mathpal MC, Mishra SK, Agarwal A. Study of structural transformation in TiO2 nanoparticles and its optical properties. Journal of Alloys and Compounds. 2013;549:114-120.
41. Bai W, Gao YQ, Zhu JY, Meng XJ, Lin T, Yang J, et al. Electrical, magnetic, and optical properties in multiferroic Bi5Ti3FeO15 thin films prepared by a chemical deposition route. Journal of Applied Physics. 2011;109(6):064901.
42. Gringerg I, West DV, Torres M, Gou G, Stein DM, Wu L, et al. Perovskite oxide for visible-light-absorbing ferroelectric and photovoltaic materials. Nature. 2013;503:509-512.
43. Kubelka P, Munk F. Ein Beitrag Zur Optik Der Farbanstriche. Zeitschrift für Technische Physik. 1931;12:593-601.
44. Sandoval C, Arnold DK. Deriving Kubelka-Munk theory from radiative transport. Journal of the Optical Society of America A. 2014;31(3):628-636.
45. Nakamoto K. Infrared and Raman Spectra of Inorganic and Coordination Compounds. 3rd ed. New York: Wiley; 1978. 46. Xie L, Ma J, Zhao Z, Tian H, Zhou J, Wang Y, et al. A novel
method for the preparation of Bi4Ti3O12 nanoparticles in w/o microemulsion. Colloids and Surfaces A: Physicochemical and Engineering Aspects. 2006;280(1-3):232-236.
47. Nyquist RA, Putzig CL, Leugers MA. Infrared and Raman Spectral Atlas of Inorganic Compounds and Organic Salts. San Diego: Academic Press; 1997.
48. Silverstein RM, Webster FX, Kiemle DJ. Spectrometric Identification of Organic Compounds. 7th ed. New York: Wiley; 2005. 49. Lin X, Lv P, Guan Q, Li H, Zhai H, Liu C. Bismuth titanate
microspheres: Directed synthesis and their visible light photocatalytic activity. Applied Surface Science. 2012;258(18):7146-7153.
50. Gonçalves P, Bertholdo R, Dias JA, Maestrelli SC, Giraldi TR. Evaluation of the Photocatalytic Potential of TiO2 and ZnO
Obtained by Different Wet Chemical Methods. Materials Research. 2017;20(Suppl.2):181-189. DOI: http://dx.doi.org/10.1590/1980-5373-mr-2016-0936
52. Chiang YM, Birnie DP, Kingery WD. Physical Ceramics: Principles for Ceramics Science and Engineering. New York: Wiley; 1997.
53. Choi SW, Lee HN. Band gap tuning in ferroelectric Bi4Ti3O12 by alloying with LaTMO3 (TM = Ti, V, Cr, Mn, Co, Ni, and Al). Applied Physics Letters. 2012;100(13):132903.
54. Gu D, Qin Y, Wen Y, Li T, Qin L, Seo HJ. Electronic structure and optical properties of V-doped Bi4Ti3O12 nanoparticles. Journal of Alloys and Compounds. 2017;695:2224-2231.
55. Zhou D, Gu H, Hu Y, Qian Z, Hu Z, Yang K, et al. Raman scattering, electronic, and ferroelectric properties of Nd modified Bi4Ti3O12 nanotube arrays. Journal of Applied
Physics. 2010;107(9):094105.
56. Prasetyo A, Mihailova B, Suendo V, Nugroho AA, Ismunandar. Further insights into the structural transformations in PbBi4Ti4O15 revealed by Raman spectroscopy. Journal of
Applied Physics. 2015;117(6):064102.
57. Long C, Chang Q, Fan H. Differences in nature of electrical conductions among Bi4Ti3O12-based ferroelectric polycrystalline ceramics. Scientific Reports. 2017;7:4193.
58. Huanosta A, Alvarez-Fregoso O, Amano E, Tabares-Muñoz C, Mendoza-Alvarez ME, Mendoza-Alvarez JG. AC impedance analysis on crystalline layered and polycrystalline bismuth titanate. Journal of Applied Physics. 1991;69(1):404-408.