From the Department of Medicine, Nutrology Service, Faculty of Medicine, Federal University of Rio de Janeiro - Rio de Janeiro/RJ, Brazil.
Received for publication on March 26, 2003.
ORIGINAL RESEARCH
ADDUCTOR POLICIS MUSCLE: A NEW
ANTHROPOMETRIC PARAMETER
Edson Braga Lameu, Mauricio Freitas Gerude, Regina Célia Corrêa and Keite Azevedo Lima
LAMEU EB et al. - Adductor policis muscle: a new anthropometric parameter. Rev. Hosp. Clín. Fac. Med. S. Paulo 59 (2):57-62, 2004.
PURPOSE: To measure the thickness of adductor pollicis muscle in healthy adults. This measurement will be used as
a nutritional anthropometric parameter in further studies.
SUBJECTS AND METHOD: Four hundred and twenty-one healthy adults were studied, 209 men and 212 women,
with ages ranging from 18 to 87 years, living in Rio de Janeiro.
The adductor pollicis muscle was also studied in the human anatomy lab as well as in normal healthy volunteers using CAT scans and nuclear magnetic resonance imaging to ensure that only the adductor pollicis was included in measurement of muscle thickness with a Lange caliper.
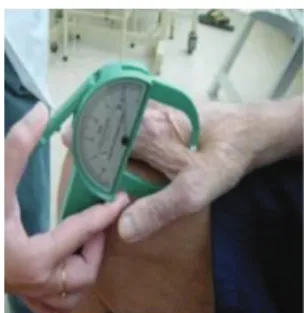
To standardize the measurement, the methodology was detailed, with subjects sitting with the dominant hand dangling over the homolateral thigh and the elbow bent at approximately a 90° angle. The Lange caliper was applied at a pressure of 10 g/mm2, pinching the adductor pollicis muscle at the vertex of an imaginary angle between the thumb and the index finger. The average of 3 consecutive measurements was considered to be the muscle thickness.
RESULTS: This study provides the first estimates of adductor pollicis thickness in normal healthy subjects as an
anthropometric parameter. The normal values in the dominant hand for men were 12.5 ± 2.8 mm (mean ± SD), median 12 mm, and for women were 10.5 ± 2.3 mm, median 10 mm.
KEY WORDS: Adductor pollicis. Muscle atrophy. Malnutrition. Nutritional assessment. Anthropometry.
Technological evolution has ena-bled the development of several so-phisticated devices for the analysis of body composition, but the high costs of such equipment limit their utiliza-tion in clinical practice1. Thus,
anthro-pometric and laboratory parameters, primarily circumferences and muscle areas, are still routinely used as meas-urements in nutritional assessment at the bedside2.
Since there is no report in the lit-erature of the thickness of the adduc-tor pollicis muscle (APM) as an an-thropometric parameter, but only ref-erences on dynamometry3, electric
stimulation of the ulnar nerve4, and
acoustic myography of the thumb ad-ductor5, we standardized the
measure-ment of thickness of APM, correlating it with age, sex, frame size, and race.
SUBJECTS
The assessment involved 421 healthy adults, randomly selected among professors, graduate and under-graduate students, physicians,
employ-ees, and companions of outpatients of our university hospital and employees and companions of outpatients of the National Cancer Institute (INCa) dur-ing a period of 8 months.
Subjects were distributed into the following age groups: 18 to 25 years, 26 to 45 years, 46 to 65 years, and greater than 65 years.
The project was approved by the Ethics and Research Committee of our institution.
METHOD
Classical Anthropometry and Subjec-tive Global Assessment.
Classical anthropometry com-prised height, actual, usual and ideal weight, body mass index (BMI), arm muscle circumference (AMC), total arm circumference (TAC), arm muscle area (AMA), triceps (TSF) and biceps (BSF) skin fold, arm fat area (AFA), and calf circumference (CC). Such measures were taken according to methods classically described by sev-eral authors6-11.
Subjective global assessment was performed using the standard ques-tionnaire described by Baker12,
classi-fying the subjects as eutrophic or mildly, moderately, or severely mal-nourished.
Measurement of Thickness of Adduc-tor Pollicis Muscle (APM)
The technique of measurement of APM thickness was studied in detail through images obtained by CAT scans and magnetic resonance imaging and in anatomical specimens of the Department of Anatomy of Medi-cal School, with the muscle gently pinched by the Lange caliper in the selected location to ensure that no other muscles were involved in the measurement.
It is worth mentioning that meas-uring the adductor muscle with a plas-tic adipometer was reason for disagree-ment among 4 examiners, who ob-served that the use of the Lange caliper is mandatory.
Through these methods, we con-cluded that the point we selected is virtually deprived of fat tissue and that it would be possible to take repeti-tive measurements of the total thick-ness of the muscle. Consequently, the following method was developed: With the subject sitting with the hand lying on the knee and with the elbow in angle of approximately 90° degrees over the homolateral lower limb, the
Lange caliper was used with a continu-ous pressure of 10 g/mm2 to pinch the
adductor muscle in the vertex of an imaginary triangle formed by the ex-tension of thumb and index finger. The average of 3 measurements was consid-ered to be the mean thickness of the adductor muscle.
The APM index (iAPM) was also assessed, which is defined as the rela-tionship between the APM measured in millimeters and the height in square meters, computed using the same for-mula used for the calculation of BMI.
Statistical Analysis
The Student’s t test was used to verify significant differences in anthro-pometric measurements between gen-ders and also between whites and
non-whites. One-way analysis of variance (ANOVA) was used to compare the an-thropometric measurements in the 3 levels of frame size. Tukey’s test for multiple comparisons was applied to identify which body frame size levels differed from one another and analogi-cally in the 4 age groups. The level of significance was set at 5%. Statistical analysis was processed by statistical software SAS® system.
RESULTS
Nutritional State of Subjects
The results in table 1 show that all assessed subjects were well nourished.
Measuring of thickness of APM and iAPM
The average thickness of APM for both genders was 11.50 ± 2.76 mm (mean ± SD)and average iMAP was 4.20 ± 1.01 (Table 1).
Assessment of APM and iAPM ac-cording to gender
Males had an average APM of 12.49 ± 2.85 mm and females an aver-age of 10.53 ± 2.29 mm. The iAPM did not present variation in the values among genders.
Table 1 - General descriptive analysis of anthropometric measurements.
Variable n Mean SE SD Median
Age 421 44.86 0.95 19.41 4 6
Height 421 1.66 0.00 0.10 1.65
Usual weight 421 67.81 0.59 12.19 6 7
Actual weight 421 67.85 0.59 12.15 6 7
Wrist 421 15.88 0.08 1.59 1 6
Ideal Weight 416 66.74 0.34 6.88 6 7
Body Mass Index 421 24.65 0.18 3.64 24.3
Triceps Skin Fold 421 15.52 0.38 7.77 1 5
Biceps Skin Fold 421 9.82 0.27 5.56 8.5
Total Arm Circumference 421 28.17 0.17 3.54 2 8
Arm Muscle Circumference 421 23.29 0.17 3.46 22.86
Arm Muscle Area 421 44.15 0.66 13.57 41.61
Arm Fat Area 421 20.00 0.53 10.77 17.36
Calf Circumference 421 35.40 0.18 3.65 3 6
Adductor Pollicis Muscle 421 11.50 0.13 2.76 11.0
Adductor Pollicis Muscle Index 421 4.20 0.05 1.01 4.1 Figure 1 - How to measure adductor pollicis
Assessment of APM and iAPM ac-cording to race
There was no significant variation for means of APM and iAPM among the races.
Assessment of APM and iAPM ac-cording to frame size
Mean thickness of APM and iAPM is progressively higher in subjects with small, medium, and large frame sizes (Table 2).
Assessment of APM and iAPM ac-cording to age group and gender
Table 3 shows the results of APM and iAPM according to the age group, while tables 4 and 5 show muscle variations according to gender per age group.
DISCUSSION
Man is the only animal able to per-form thumb opposition, and this
move-ment exists in all routine activities de-veloped. Thus, the trophic state of the thumb adductor muscle can reflect an individual’s labor activity. APM, as for every skeletal peripheral muscle, is also consumed during catabolism and atrophied by inactivity13. The loss of
contractile function has already been studied by dynamometry3 and has been
related to a higher prevalence of post-operative complications. Thus, not only is the reduction of muscle mass a
Table 3 - Descriptive analysis of adductor pollicis muscle and adductor pollicis muscle index according to age group.
Variable Age Group n Mean SE SD Median Min Max P value Significant
differences Adductor Pollicis Muscle
<= 25 106 10.69 0.25 2.57 10.5 6 2 1 0.0001 1 ≠≠≠≠≠ 2
26-45 104 11.84 0.28 2.87 11.5 5 2 2 1 ≠≠≠≠≠ 3
46-65 108 12.46 0.25 2.57 1 2 7 2 0 3 ≠≠≠≠≠ 4
> 65 103 10.99 0.26 2.68 1 1 5 1 8
AdductorPollicis Muscle Index
<= 25 106 3.72 0.08 0.81 3.63 2.2 6.86 0.0001 1 ≠≠≠≠≠ 2 1 ≠≠≠≠≠ 3
26-45 104 4.26 0.11 1.11 3.92 1.95 7.79 1 ≠≠≠≠≠ 4
46-65 108 4.61 0.09 0.95 4.52 2.83 7.12 2 ≠≠≠≠≠ 3
> 65 103 4.23 0.10 0.97 4.41 1.73 6.02 3 ≠≠≠≠≠ 4
Table 2 - Descriptive analysis of adductor pollicis muscle according to frame size.
Variable Frame Size n Mean SE SD Median Min Max P value Significant
differences Adductor Pollicis Muscle
0 165 10.49 0.18 2.31 1 0 5 1 6 0.0001 0 ≠≠≠≠≠ 1 0 ≠≠≠≠≠ 2
1 179 11.95 0.20 2.67 1 2 6 2 1 1 ≠≠≠≠≠ 2
2 7 6 12.66 0.36 3.13 1 3 6 2 2
Adductor Pollicis Muscle Index
0 165 3.69 0.06 0.79 3.67 1.73 5.71 0.0001 0 ≠≠≠≠≠ 1 0 ≠≠≠≠≠ 2
1 179 4.40 0.07 0.95 4.41 2.4 7.26 1 ≠≠≠≠≠ 2
2 7 6 4.87 0.12 1.07 4.89 2.13 7.79
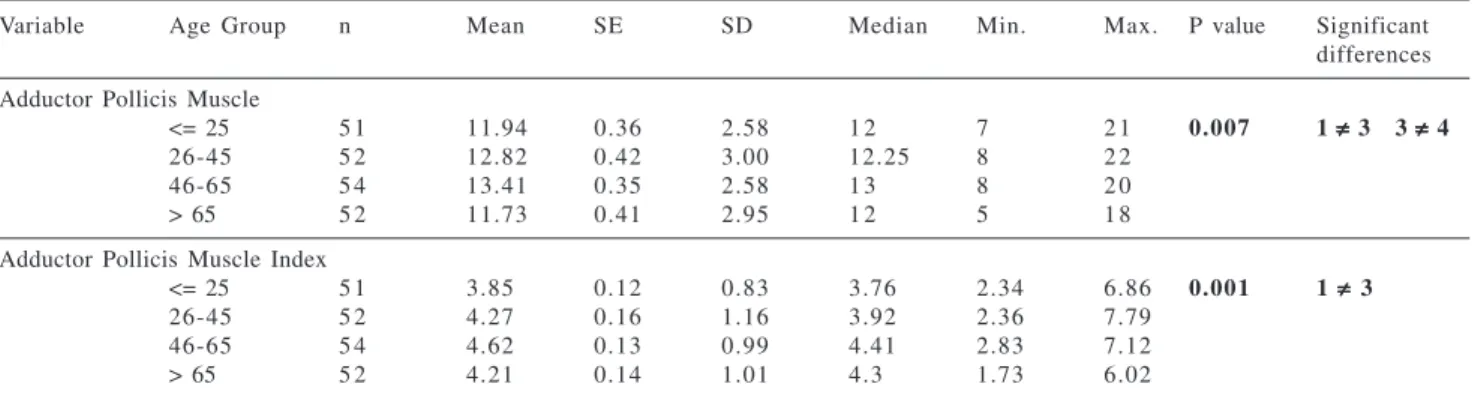
Table 4 - Descriptive analysis of adductor pollicis muscle according to age for males.
Variable Age Group n Mean SE SD Median Min. Max. P value Significant
differences Adductor Pollicis Muscle
<= 25 5 1 11.94 0.36 2.58 1 2 7 2 1 0.007 1 ≠≠≠≠≠ 3 3 ≠≠≠≠≠ 4
26-45 5 2 12.82 0.42 3.00 12.25 8 2 2
46-65 5 4 13.41 0.35 2.58 1 3 8 2 0
> 65 5 2 11.73 0.41 2.95 1 2 5 1 8
AdductorPollicis Muscle Index
<= 25 5 1 3.85 0.12 0.83 3.76 2.34 6.86 0.001 1 ≠≠≠≠≠ 3
26-45 5 2 4.27 0.16 1.16 3.92 2.36 7.79
46-65 5 4 4.62 0.13 0.99 4.41 2.83 7.12
prognostic parameter for complications in postoperative patients14 but the loss
of muscle function is also a predictor of mortality in healthy subjects15.
Malnutrition causes decrease of contraction strength, relaxation rate, and increase of muscle fatigue of the adductor muscle of the thumb. Several functional and morphological altera-tions13 have been demonstrated in
healthy adults related to temperature, neuromuscular blocking16, intensity of
generated force, age17, gender18, race,
perfusion pressure19, and nutritional
state. However, in daily clinical prac-tice, the routine utilization of electro-myography or electric stimulation of the ulnar nerve is difficult, not only due to its high cost, but also because of the need for experience with the procedure.
Because the APM is flat and lo-cated between 2 bone structures, it is the only muscle allowing an adequate assessment of its thickness, since it presents a well-defined anatomic ref-erence, and importantly, measurements are reproducible by other investiga-tors.
The assessment of classical anthro-pometric parameters reflects the degree of malnutrition20, but the alterations in
such parameters appear only after a variable period of malnutrition. Func-tional alterations occur before ana-tomical alterations appear. Thus, all somatic modifications, although im-portant for the diagnosis of chronic malnutrition, are not able to assess such condition in its acute stage21.
Likewise, the reduction of APM shows the loss of working life as a con-sequence to various clinical and sur-gical conditions, with intensity and duration varying according to the un-derlying morbid condition.
Considering only the APM and iAPM value for males and analyzing their variations among the different frame sizes, there was a progressive in-crease of the APM values with signifi-cant differences among small, medium, and large frame sizes. iMAP measure-ments produced the same results for males, with increasing values accord-ing to frame size.
Table 6 below shows normal val-ues for APM using only 2 indexes, the
Z score and the percentage of median. The selection of these 2 indicators was based on their easy application in the clinical practice and their adequate ca-pacity to assess extremes in the popu-lation22 (Table 6).
The APM value in the various age groups was always significantly higher in males, although the iMAP did not vary between genders in the various age groups. Thus, we would emphasize the importance of further characteriza-tion of the sex-related APM values.
The values expressed in Table 6 use the same criteria used by Janssen23 to
classify sarcopenia according to mus-cle mass assessed by bioimpedance. Subjects were considered to have a nor-mal APM thickness if their value was greater than 1 standard deviation above the sex-specific mean, class I values were considered present in subjects whose APM was within 1 to 2 standard deviations of normal values, and class II with values of APM thickness below 2 standard deviations of normal mean value.
Percentages of the mean were simi-larly referred to in the description by
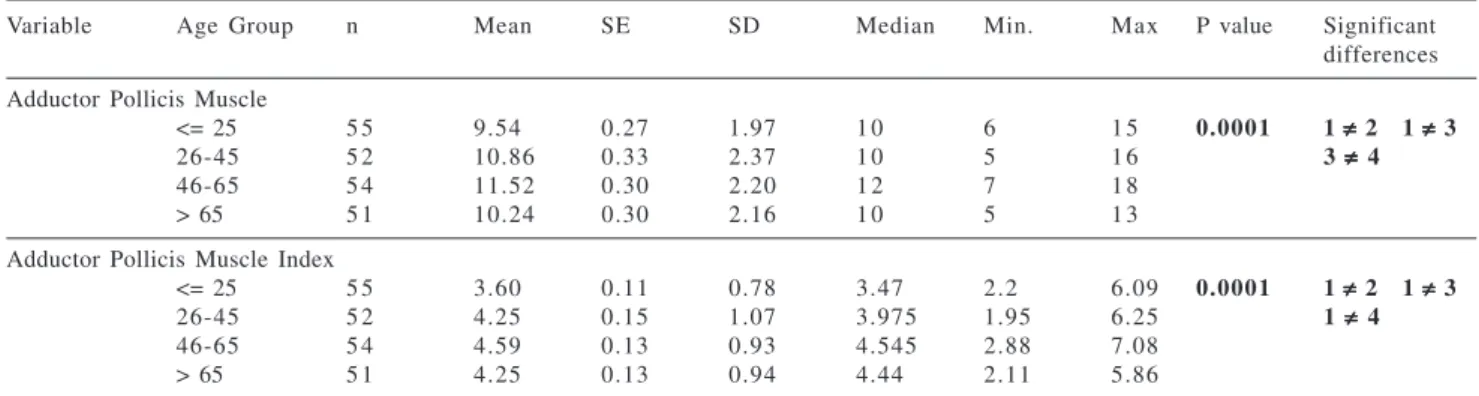
Table 5 - Descriptive analysis of adductor pollicis muscle and adductor pollicis muscle index.
Variable Age Group n Mean SE SD Median Min. Max P value Significant
differences AdductorPollicis Muscle
<= 25 5 5 9.54 0.27 1.97 1 0 6 1 5 0.0001 1 ≠≠≠≠≠ 2 1 ≠≠≠≠≠ 3
26-45 5 2 10.86 0.33 2.37 1 0 5 1 6 3 ≠≠≠≠≠ 4
46-65 5 4 11.52 0.30 2.20 1 2 7 1 8
> 65 5 1 10.24 0.30 2.16 1 0 5 1 3
AdductorPollicis Muscle Index
<= 25 5 5 3.60 0.11 0.78 3.47 2.2 6.09 0.0001 1 ≠≠≠≠≠ 2 1 ≠≠≠≠≠ 3
26-45 5 2 4.25 0.15 1.07 3.975 1.95 6.25 1 ≠≠≠≠≠ 4
46-65 5 4 4.59 0.13 0.93 4.545 2.88 7.08
> 65 5 1 4.25 0.13 0.94 4.44 2.11 5.86
Table 6 - Adults standards for adductor pollicis muscle thickness.
Classification Type: Standard Deviation (SD) Percentages of Median
Sex Mean Median Normal Class I Between Class II Light Moderate Severe
> 1 SD 1 and 2 SD < 2SD >90% 60-90% <60%
Male 12.5 1 2 > 9.5 7 – 9.5 < 7 > 11 11 – 7 < 7
Jellife9 regarding the TSF, in which
light muscle loss was considered to be when the values are above 90% of the mean, moderate between 60% and 90%, and severe when the values are below 60% of the mean.
Although the variation of the mean APM was significant in males and fe-males, the median values remained vir-tually unaltered in the different age groups, making the utilization of val-ues corresponding to each age group unnecessary.
In our case study, AMP progres-sively increased with age up to 65 years and then it showed a clear de-cline (decrease in thickness). As to iMAP, the highest value of thickness
is also found in the 46-65 year age group, suggesting greater activity in such age group. These results demon-strate that after 65 years of age, in the absence of systemic diseases, neuropa-thies, or disuse, sarcopenia does not seem to contribute to the reduction of the adductor muscle mass with conse-quent functional disability. However, the APM mass in individuals over 65 years of age is sustained23,24. As to the
point selected for measuring the thick-ness, Kaufman25 studied the isometric
forces and electric activity generated by voluntary contraction in 7 muscles present in the thumb area. He demon-strated that the highest production of strength is obtained during flexion.
APM was measured in extension (an-gle >70%), preserving at maximum the anatomic architecture of adductor mus-cle.
CONCLUSIONS
1. The thickness of the adductor pollicis muscle was standardized in 421 healthy adult subjects, with results varying according to gender, age, and frame size. The mean for males was 12.5 mm and for females was 10.5 mm. This parameter will be assessed in future works as a predictor of compli-cations in clinical and surgical pa-tients.
RESUMO
LAMEU EB e col. - Músculo adutor do polegar: um novo parâmetro antropométrico. Rev. Hosp. Clín. Fac. Med. S. Paulo 59(2):57-62, 2004.
OBJETIVO: Padronizar a medida
da espessura do músculo adutor do po-legar em adultos saudáveis, para futu-ras avaliações como parâmetro antro-pométrico.
INDIVÍDUOS E MÉTODOS:
Fo-ram estudados 421 adultos saudáveis, oriundos de vários municípios do Rio de Janeiro, de ambos os sexos e nas faixas etárias compreendidas entre 18
a 25 anos, 26 a 45 anos, 46 a 65 anos e mais de 65 anos. Após a confirma-ção pelos estudos radiológicos e anatômicos, concluindo que com a téc-nica empregada, nenhum outro múscu-lo além do adutor do polegar foi in-cluído na medição, foi elaborado o se-guinte método: Com o indivíduo sen-tado, mão dominante repousando so-bre o joelho homolateral, cotovelo em ângulo de aproximadamente noventa graus sobre o membro inferior, foi uti-lizado o paquímetro de Lange exer-cendo uma pressão contínua de 10g/ mm2 para pinçar o músculo adutor no
vértice de um ângulo imaginário
for-mado pela extensão do polegar e o dedo indicador. A média de três aferi-ções foi considerada como a medida da espessura do músculo adutor.
RESULTADOS: A média obtida
para a espessura do músculo adutor do polegar, na mão dominante, no sexo masculino foi de 12,5 ± 2,8 mm, com uma mediana de 12 mm e no sexo fe-minino foi de 10,5 ± 2,3 mm, com uma mediana de 10 mm.
UNITERMOS: Músculo adutor do polegar. Atrofia muscular. Desnutri-ção. Avaliação nutricional. Antro-pometria.
REFERENCES
1. Figueiredo FA, Dickson ER, Pasha TM, et al. Utility of standard nutritional parameters in detecting body cell and mass depletion in patients with end-stage liver disease. Liver Transpl 2000; 6:575-581.
2. Goulet O. Assessment of nutritional status in clinical practice. Baillières Clin Gastroenterology 1998; 12:647-669. 3. Webb AR, Newman LA, Taylor M, et al. Hand grip dynamometry
as a predictor of postoperative complications reappraisal using age standardized grip strengths. JPEN 1989; 13:30-33.
4. DE Ruiter CJ, Jones DA, SargeanT AJ. The measurement of force/ velocity relationships of fresh and fatigued human adductor pollicis muscle. Eur J Appl Physiol Occup Physiol 1999; 80:386-393.
6. Heymsfield SB, Mcmannus CB, Smith J. Anthropometric measurement of muscle. Revised equations for calculating bone-free arm muscle area. Am J Clin Nutr 1982; 36:680-687.
7. Hopkins B. Assessment of nutritional status. In: Gottschlich MM, Materese LE, Shronts EP. Nutrition Support Dietetics – Core Curriculum. 2nd ed, ASPEN, 1993. p.15.
8. Garrow JS, Webster J. Quetelet’s index (W/H2)as a measure of
fatness. Int J Obesity 1985; 9:147-153.
9. Jelliffe DR. The assessment of nutritional status of the community. Nutrition 1997; 13:714-717.
10. Frisancho AR. New norms of upper limb fat muscle areas for assessment of nutritional status. Am J Clin Nutr 1981; 34:2540-2545.
11. Frisancho AR. New standards of weight and body composition by frame size and height for assessment of nutritional status of adults and the elderly. Am J Clin Nutr 1984; 40:808-820. 12. Baker JP, Detsky AS, Wesson DE. Nutritional assessment. A
comparison of clinical judgment and objective measurements. N Engl J Med 1982; 306:969-972.
13. Dastur DK, Gagrat BM, Manghani DK. Human muscle in disuse atrophy. Neurophathol Appl Neurobiol 1979; 5:85-89. 14. Mullen JL, Gertner MH, Buzby GP, et al. Implications of
malnutrition in the surgical patient. Arch Surg 1979; 114:121-125.
15. Metter EJ, Talbot LA, Schrager M, et al. Skeletal muscle strength as a predictor of all-cause mortality in healthy men. J Gerontol A Biol Sci Med Sci 2002; 57:B359-365.
16. Vandervoort AA. Aging of the human neuromuscular system. Muscle Nerve 2002; 25:17-25.
17. Tomlinson BE, Walton JN, Rebeiz JJ. The effects of ageing and cachexia upon skeletal muscle. A histopathological study. J Neurol Sci 1968; 9:321-326.
18. Ditor DS, Hicks AL. The effect of age and gender on the relative fatigability of the human adductor pollicis muscle. Can J Physiol Pharmacol 2000; 78:781-790.
19. Wright JR, Mccloskey DI, Fitzpatrick RC. Effects of muscle perfusion pressure on fatigue and systemic arterial pressure in human subjects. J Appl Physiol 1999; 86:845-851.
20. Blackburn LG, Bistrian RB, Maini SB, et al. Nutritional and metabolic assessment of the hospitalized patient. JPEN 1977; 1:11-22.
21. Bray GA, Greenway FL, Molitch ME, et al. Use of anthropometric measures to assess weight loss. Am J Clin Nutr 1978; 31:769-773. 22. Gorstein J, Sullivan R, Yip R, et al. Issues in the assessment of nutritional status using anthropometry. Bull World Health Organ 1994; 72: 273-280.
23. Janssen I, Heymsfield SB, Ross R. Low relative skeletal muscle mass (sarcopenia) in older persons is associated with functional impairment and physical disability. J Am Geriatr Soc 2002; 50:889-896.
24. Dionne IJ, Kinaman KA, Poehlman ET. Sarcopenia and muscle function during menopause and hormone-replacement therapy. J Nutr Health Aging 2000; 4:156-161.