Agroclimatic zoning of off-season (safrinha) corn for
the first ten days of February in Goiás, Brazil
Raphael Maia Aveiro Cessa1
Felipe Gimenes Rues Silva2
Givaldo Dantas Sampaio Neto3
Nilton Nélio Cometti4
Abstract
Through maps, agroclimatic zoning can help us understand the guidelines for the most sui-table locations for sowing, minimizing risks of produce loss due to climatic adversities. The aim of the present study is to develop an agroclimatic zoning for the cultivation of a non-irrigated off-sea-son (safrinha) corn in the state of Goiás, sown in the first ten days of February. The methodological steps were the delimitation of the representative bands of the climatic requirements for the crop; the spatialization of the climatic elements in the region; the spatial reclassification of climatic elements based on the climatic requirements for the crop; elaboration of the agroclimatic zoning map. Average, minimum, and maximum air temperature, accumulated precipitation, actual crop evapotranspiration and relative humidity of the air registered between February and July for the years 2013 to 2017 were used. The most suitable areas for the cultivation of the non-irrigated off-season corn sown in the first ten days of February in Goiás established by the agroclimatic zoning are concentrated in the Sou-th-Southwest and Northwest regions. The expressive presence of Latosol soil class and the proximity of the values of the climatic elements accumulated precipitation, temperature and altitude, which are proper for the development of the off-season corn, favour suitability of the areas.
Keywords: Rain. Farmers. Maps.
Introduction
Agroclimatic zoning is a useful tool for technicians and farmers. Made available through a map, it facilitates the understanding of the guidance as to the most suitable locations to cultivate plant spe-cies, minimizing risks of produce loss due to climatic adversities (LANDAU et al., 2013). It is impor-tant to note that agroclimatic zoning does not include cultivation in areas of mandatory preservation, in accordance with Law No. 12.727 of 2012 (new Brazilian Forest Code).
The cultivation of agricultural species depends on their adaptation to edaphoclimatic condi-tions; it is necessary that the climatic components are similar to the places of origin of the plants – or the places where they have been genetically improved – according to the requirements of the species, this being the basis of the agroclimatic zoning (LANDAU et al., 2013; FRITZSONS et al., 2016).
1 Instituto Federal de Educação, Ciência e Tecnologia de Brasília – Campus Planaltina, Professor do Ensino Básico, Técnico e Tecnológico – Área Agronomia. raphael.cessa@ifb.edu.br. Rodovia BR 128, km 21, Zona Rural de Planaltina, Brasília, Distrito Federal, CEP: 73380-900.
A consensus among technicians and farmers, the season for sowing the off-season corn in the state of Goiás, associated with lower climatic risks and high yields, is the first ten days of February. This is because early sowing allows the plant to “escape” from water deficit in phenological stages, such as flowering and grain filling; the period also presents lower values of accumulated precipitation, which is important to the complete developmental cycle of the corn (HEINEMANN et al., 2009). Still, late sowing causes an expressive part of the plant cycle to be contemplated by higher temperatures, interfering with physiological aspects of the plant such as photorespiration and respiration (MAREN-CO; LOPES, 2013).
The objective of the present study was an agroclimatic zoning for the cultivation of non-irrigated off-season corn in Goiás sown in the first ten days of February.
Material and methods
The attributes necessary for rasterization to obtain maps were: average, minimum and maxi-mum temperatures, relative air humidity, actual evapotranspiration and accumulated precipitation (climatic data), soil classes, altitude and terrain slope.
To make the agroclimatic zoning map, it was necessary to convert vector data into a matrix format, which enabled the development of map algebra operations through the computational appli-cation ArcGIS 10.1, in its kriging function. The system of geographic coordinates and cartographic projection used were Latitude/Longitude and SIRGAS 2000 (Datum), respectively.
The methodological steps used in the elaboration of an agroclimatic zoning start with the deli-mitation of the representative bands of the climatic requirements of the culture, spatialization of the climatic elements of the region, spatial reclassification of the climatic elements of the region based on the climatic requirements of the culture and elaboration of the map of agroclimatic zoning, delimiting the areas where there is agreement or not, or restrictions between the climatic requirements of the culture and the permissible limits of the climatic indices for that culture (SANTOS et al., 2015).
The climatic data come from the historical series of the National Institute of Meteorology from the automatic meteorological stations located in the state of Goiás, considering the first ten days of February between 2013 and 2017.
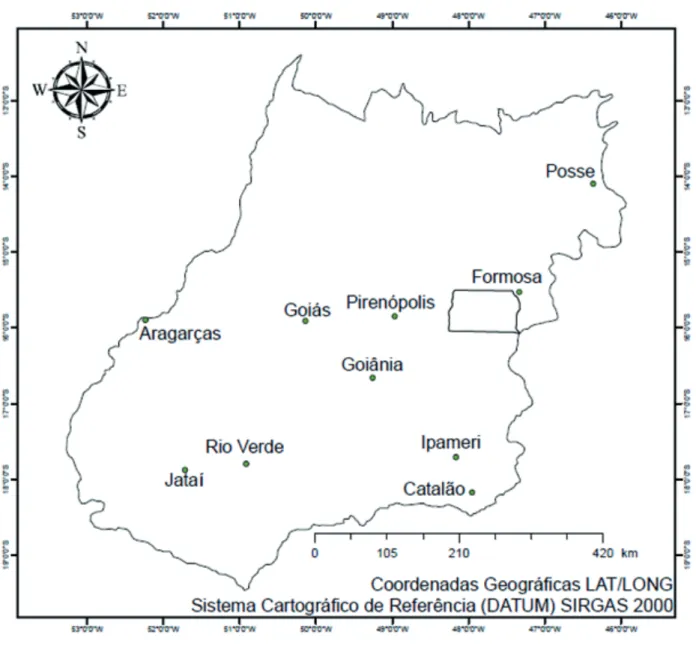
For each climatic element in each automatic meteorological station, the monthly average was obtained between the months of February and July – the period of cultivation of the off-season corn in Goiás – subsequently, through the monthly average, it was estimated the average for the period between the years 2013 and 2017. Thus, each automatic meteorological station (FIGURE 1) contai-ned an average period value for each climatic element, forming a sample grid to produce isoline maps using the kriging model.
Figure 1 – Location of the automated meteorological stations from the National Institute of Meteorology
Source: Elaborated by the authors (2020).
The altitude and slope maps of the state of Goiás were obtained from the generation of the di-gital terrain elevation model produced by the active sensors Shuttle Radar Topography Mission. From those vector data, the numerical model of rasterized terrain is generated to produce the altitude and slope map. The digital soil class map was made available in the computational extension shapfile by the State System of Geoinformation of Goiás, on a scale of 1:100,000.
Initially, using the computational application ArcGIS 10.1, a climate zoning map was created for the non-irrigated offseason corn crop in the first ten days of February in the state of Goiás. To do so, based on vector data, maps were made in raster format of the climatic elements mentioned,
Table 1 – Ranges, classes for accumulated precipitation and coefficients
Accumulated precipitation range Class Coeffi cients
≤550 mm Low 4
>550 mm to 650 mm Good 7
>650 mm to 750 mm Adequate 10
600 mm: average accumulated precipitation used as a reference to create the classes.
Source: Fancelli (1991); Pegorare et al. (2015).
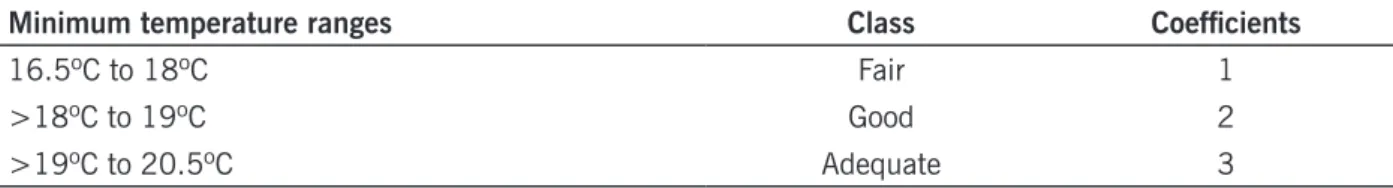
Table 2 – Ranges, classes for minimum temperature for the period between February and July and respective
coefficients
Minimum temperature ranges Class Coeffi cients
16.5ºC to 18ºC Fair 1
>18ºC to 19ºC Good 2
>19ºC to 20.5ºC Adequate 3
10.0ºC: minimum temperature for the development of corn plants used as a reference to create classes.
Source: Fancelli; Dourado Neto (2000).
Table 3 – Ranges, classes for average temperature and respective coefficients
Average temperature range Class Coeffi cients
<23ºC Fair 1
≥23ºC to 24ºC Good 2
≥24ºC to 25ºC Adequate 3
25.0ºC: average temperature for the development of corn plants used as a reference to create classes.
Source: Fancelli; Dourado Neto (2000).
Table 4 – Range, classes for maximum temperature and respective coefficients
Maximum temperature range Class Coeffi cients
29ºC to 30ºC Adequate 3
> 30ºC to 31ºC Fair 2
> 31ºC to 32.5ºC High 1
35.0ºC: maximum temperature for the development of corn plants used as a reference to create classes.
Source: Fancelli; Dourado Neto (2000).
Table 5 – Range, classes for relative humidity and respective coefficients
Relative humidity range Class Coeffi cients
66% to 67% Fair 1
> 67% to 68% Good 2
69% to 70% Adequate 3
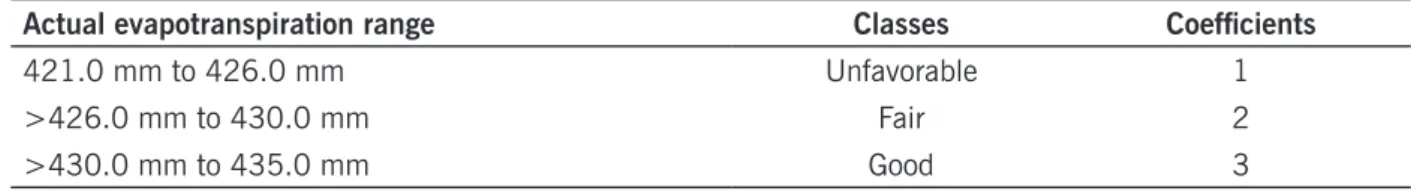
Table 6 – Ranges, classes for actual accumulated evapotranspiration and respective coefficients
Actual evapotranspiration range Classes Coeffi cients
421.0 mm to 426.0 mm Unfavorable 1
>426.0 mm to 430.0 mm Fair 2
>430.0 mm to 435.0 mm Good 3
450.0 mm: actual accumulated reference evapotranspiration during the development cycle of corn plants.
Source: adapted of Souza et al. (2012).
Using reclassified and rasterized maps of climatic elements and the raster calculator function of the Arc GIS 10.1 by the algebraic model: (accumulated precipitation x weight 40) + (average tem-perature x weight 30) + (actual evapotranspiration x weight 10) + (relative humidity x weight 10) + (minimum temp x weight 5) + (maximum temp x weight 5), a rasterized map was created, which was reclassified according to Table 7, generating the climate zoning map (FIGURE 2).
Table 7 – Classes and coefficients used in climate zoning
Range of climatic conditions Coeffi cients
Suitable 10
Suitable with some climate restriction 8
Restricted 5
Very restricted 3
Unsuitable 1
Source: Elaborated by the authors (2020).
Also, rasterized maps (FIGURE 2) of the numerical terrain model (MNT), soil classes and slope were obtained, which were reclassified according to classes and the coefficients described in Tables 8, 9 and 10.
Table 8 – Ranges, classes for altitude and respective coefficients
Altitude Range Class Coeffi cients
<700.0 m Fair 5
> 700.0 m Ideal 8
According to EMBRAPA (2018, a and b), higher corn grain yields are obtained at altitudes above 700.0 m.
Source: Elaborated by the authors (2020).
Table 9 – Ranges of soil classes, classes and respective coefficients
Soil class range Classes Coeffi cients
Outcrop Unsuitable 1
Neosols Unsuitable 2
Soil class range Classes Coeffi cients
Ferralsols Suitable 10
Chernozem Suitable 10
Source: Elaborated by the authors (2020).
Table 10 – Ranges, classes for slope and respective coefficients
Slope Class Coeffi cients
0.0% to 5.0% Extremely suitable 4
> 5.0% to 10.0% Very suitable 3
> 10.0% to 15.0% Suitable 2
> 15.0% to 20.0% Moderately suitable 1
Source: Höfig; Araujo –Junior (2015)
Figure 2 – Climatic zoning of non-irrigated off-season corn sown in the first ten days of February in Goiás, soil
Finally, the reclassified maps of soil classes, slope, MNT and climate zoning were interposed using the Arc GIS 10.1 raster calculator function, with the algebraic model: (soil class x weight 50) + (climatic zoning x weight 30) + (MNT x weight 10) + (slope x weight 10). Suitable, intermediate, and unsuitable classes were inserted in the rasterized map of the interposition.
Results and discussion
The South-Southwest region and parts of the Northwest region concentrate the largest portions of the most suitable areas of zoning, followed by the Southeastern Goiás (FIGURE 3). The Northeas-tern region concentrates less suitable or even unsuitable areas.
The South-Southwest and Northwest regions were possibly the most suitable (FIGURE 3) in the present agroclimatic zoning, due to the presence of the class of Latosol soils and favorable climatic conditions for the cultivation of corn, with average temperatures (25ºC) and accumulated precipita-tion in the period studied (600 mm) close to those ideal for the cultivaprecipita-tion of “safrinha” corn. This possibility is sustained since the soil classes and climatic zoning had “weights” of 50% and 30% respectively in the construction of the present agroclimatic zoning.
In the Northeast region, containing less suitable or unsuitable areas (FIGURE 3), classes of Plinthosol, Gleysol and Neosol soils are present, as well as accumulated precipitation values below the reference values (600 mm) and higher maximum temperatures, but not above the maximum for the 35ºC culture, than those observed in the South-Southwest and Northwest regions, which classi-fies it as “restricted” in the climate zoning map (FIGURE 2).
By comparing the Southwest and South with the Northwest and North, we observe that the temperature variation cited in the previous paragraph is influenced by altitude (FRITZSONS et al., 2016), which was reported by Nimer (1979), who attributed to the latitude the higher temperatures in the North (24°C) and the lower temperatures in the South (22°C), while the relief favours higher average temperatures close to 22°C in places of lower altitudes, decreasing to 20°C in higher areas. This spatial variability was also found by Marcuzzo and Faria (2012) who, when spatializing the average annual temperature of the state of Goiás and the Federal District, observed annual averages between 26°C and 27°C in the Northwest (lower latitude and altitude) compared to Southeast and East (highest latitude and altitude) with values between 20°C and 22°C.
In 2005, Ribeiro et al. (2005) already observed that Goiás, especially in the Southwestern re-gion, presents soil and climate conditions highly favorable to grain production, with a high percentage of soils with medium to clayey texture occurring in large plains and plateaus, and concentrated preci-pitation from September to May. Furthermore, the authors stated that like any agricultural production system, the off-season system would undergo transformations over the years.
Naturally, uninterrupted research programs on new systems for off-season corn cropping and genetic improvement make it possible to grow plants in locations previously considered unsuitable. Also, climate changes can alter the agroclimatic zoning in terms of the location and performance of plants in productive terms.
Minuzzi and Lopes (2015), studying future climatic scenarios for growing off-season corn in the Midwest of Brazil, identified that there will be a reduction in the cycle duration of the plant because it is based on the concept of accumulated degree days. Thus, as the projections suggested an increase in temperature, sooner the crop of off-season corn will reach its energy requirement to complete its cycle. The reductions in the cycle for off-season corn for the Midwest are two to eight days in the short term (2016-2035) and six to eleven days in the medium term (2046-2065). For the South of Goiás, represented in the study of the authors mentioned, in the municipality of Rio Verde, there will be, in the short term, reductions in the cycle and productivity in the order of 11 days and 0.802 t ha-1,
respectively. For the short-term scenario, the values are 16 days and 0.937 t ha-1.
Conclusion
The most suitable areas for the cultivation of the non-irrigated off-season (safrinha) corn sown in the first ten days of February in Goiás established by the agroclimatic zoning are concentrated in the South-Southwest and Northwest regions. The expressive presence of Latosol soil class and the
proximity of the values of the climatic elements accumulated precipitation, temperature, and altitude, which are proper for the development of the off-season corn, favour the suitability of the areas.
Zoneamento agroclimático do milho “safrinha” para a
primeira dezena de fevereiro em Goiás, Brasil
Resumo
O zoneamento agroclimático facilita o entendimento das orientações sobre as localidades mais aptas de cultivo das espécies vegetais por meio de mapas, minimizando riscos de perda de produtos em decorrência de adversidades climáticas. Objetivou-se com o presente estudo um zoneamento agroclimático para cultivo do milho “safrinha” não irrigado, no estado de Goiás, semeado na primei-ra dezena de fevereiro. As etapas metodológicas foprimei-ram: delimitação das faixas representativas das exigências climáticas da cultura; espacialização dos elementos climáticos da região; reclassificação espacial dos elementos climáticos com base nas exigências climáticas da cultura; elaboração do mapa de zoneamento agroclimático. Fez-se uso das temperaturas do ar média, mínima e máxima, da precipitação acumulada, da evapotranspiração real da cultura e da umidade relativa do ar, entre os meses de fevereiro e julho dos anos de 2013 a 2017. As áreas mais aptas ao cultivo do milho safri-nha não irrigado semeado na primeira dezena de fevereiro em Goiás estabelecidas pelo zoneamento agroclimático estão concentradas nas Regiões Sul-Sudoeste e Noroeste do estado. Tal favorecimento de aptidão é dado pela presença expressiva da classe de solo Latossolo, bem como pela proximidade dos valores dos elementos climáticos, precipitação acumulada, temperatura e altitude, adequados ao desenvolvimento do milho safrinha.
Palavras–chave: Chuvas. Agricultores. Mapas.
Referências
EMPRESA BRASILEIRA DE PESQUISA AGROPECUÁRIA – EMBRAPA. Ensaios Nacionais de
Cul-tivares de Milho Centro Precoce 2016/2017. Disponível em:
https://www.embrapa.br/docu-ments/1347058/27288493/ENCPN2016-17.pdf/f15b3eac-e264-c730-847a-705393648b1c. Acesso em: 15 maio 2018a.
EMPRESA BRASILEIRA DE PESQUISA AGROPECUÁRIA – EMBRAPA. Ensaios Nacionais de
Cul-tivares de Milho centro superprecoce 2016/2017. Disponível em:
https://www.embrapa.br/docu-ments/1347058/27288493/ENCSP2016-17.pdf/03b4ca53-38ae-b2e0-80e9-d63f9e812aca. Acesso em: 15 maio 2018b.
FANCELLI, A. L. Milho e feijão: elementos de manejo em agricultura irrigada. In: DOURADO NETO, D.; SAAD, A. M.; JONG VAN LIER, Q. Fertirrigação: algumas considerações. Piracicaba:ESALQ,
FANCELLI, A. L. Manejo baseado na fenologia aumenta eficiência de insumos e produtividade. Visão
Agrícola, v. 1, n. 13, p. 24 – 29, 2015.
FRITZSONS, E.; MANTOVANI, L. E.; WREGE, M. S. Relação entre altitude e temperatura: uma con-tribuição ao zoneamento climático no Estado de Santa Catarina, Brasil. Revista Brasileira de
Clima-tologia, v. 18, n. 1, p. 80 – 92, 2016.
HEINEMANN, A. B.; ANDRADE, C. L. T. de; GOMIDE, R. L.; AMORIM, A. O.; PAZ, R. L. da. Padrões de deficiência hídrica para a cultura de milho (safra normal e safrinha) no estado de Goiás e suas con-sequências para o melhoramento genético. Ciência Agrotecnológica, v. 33, n. 4, p. 1026-1033, 2009. HÖFIG, P.; ARAUJO-JUNIOR, C. F. Classes de declividade do terreno e potencial para mecanização no estado do Paraná. Coffee Science, v. 10, n. 2, p. 195 - 203, 2015.
LANDAU, E. C.; MOURA, L.; GUIMARÃES, D. P. Mapeamento das épocas aptas para o plantio de
milho consorciado com braquiária na segunda safra agrícola no Brasil. Sete Lagoas-MG: EMBRAPA
CNPMS, 2013. 15 p. (Circular Técnica no 187).
MARCUZZO, F.; FARIA, T. G.; PINTO FILHO, R. F. Chuvas no estado de Goiás: análise histórica e tendência futura. ACTA Geográfica, v. 6, n. 12, p. 125-137, 2012.
MARENCO, R. A.; LOPES, N. F. Fisiologia vegetal - fotossíntese respiração relações hídricas nutrição
mineral. 3 ed. Viçosa: UFV, 2013. 486 p.
MINUZZI, R. B.; LOPES, F. Z. Desempenho agronômico do milho em diferentes cenários climáticos no Centro-Oeste do Brasil. Revista Brasileira de Engenharia Agrícola, v. 19, n. 12, p. 734-740, 2015. NIMER, E. Climatologia do Brasil. Rio de Janeiro: IBGE, 1979. 422 p.
PEGORARE, A. B.; FEDATO, E.; PEREIRA, S. B.; SOUZA, P. L. C. F,; FIETZ, C. R. Irrigação suple-mentar no ciclo do milho “safrinha” sob plantio direto. Revista Brasileira de Engenharia Agrícola, v. 13, n. 3, p. 262-271, 2015.
RIBEIRO, P. H. E.; CRUZ, J. C.; GARCIA, J. C. Características do sistema de produção de milho sa-frinha no estado de Goiás. SEMINÁRIO NACIONAL DE MILHO SAFRINHA, 8, 2005, Assis. Anais... Campinas: Instituto Agronômico, 2005. p. 91–104.
SANTOS, A. R. dos; RIBEIRO, C. A. A. S.; SEDIYAMA, G. C.; PELUZIO, J. B. E.; PEZZOPANE, J. E.; BRAGANÇA, R. Zoneamento agroclimático no ArcGIA 10.3.1: passo a passo. Alegre-ES: CAUFES, 2015. 58p.
SOUZA, A. P. de; LIMA, M. E. de; CARVALHO, D. F. de. Evapotranspiração e coeficientes de cultura do milho em monocultivo e em consórcio com a mucunacinza, usando lisímetros de pesagem.
Revis-ta Brasileira de Ciências Agrárias, v. 7, n. 1, p. 142-149, 2012.