UNIVERSIDADE DA BEIRA INTERIOR
Ciências
Production and Purification of pre-miRNA-149
with potential application in diagnosis of prostate
cancer
Henrique Samuel Ramos Martins
Dissertação para a obtenção do Grau de Mestre em
Biotecnologia
(2º Ciclo de Estudos)
Orientadora: Prof.ª Doutora Carla Patrícia Alves Freire Madeira Cruz
Co-orientadora: Prof.ª Doutora Fani Pereira de Sousa
iii
Acknowledgements
First and foremost, I would like to express my sincere gratitude to my supervisor Professor Doctor Carla Cruz and my co-supervisor Professor Doctor Fani Sousa, for all the guidance, orientation, support, patience and time they gave me during this year. Without them this work would not have been possible.
I would also like to express my sincere gratitude to Tiago Santos and Patricia Pereira for their friendship, as well as their availability and knowledge to help me make this work, whenever I needed.
My special thanks to Rui Carrilho and Josué Carvalho for their friendship as well as all the good moments spent in the lab throughout this past year.
I also would like to thank to everyone in the Health Sciences Research Centre of the University of Beira Interior (CICS-UBI), for all their help and for the resources spent in making this work.
Finally, to my friends and family, because life is not only work, my undevoted gratitude for providing me with the moments to enjoy all of life’s beautiful little things.
v
Resumo
Há alguns anos, descobriu-se que o gene lin-4 não codificava uma proteína, mas um pequeno RNA, responsável por regular a expressão da proteína LIN-14 em Caenorhabditis elegans. Deste modo, uma nova classe de biomoléculas emerge, os RNAs não-codificantes (ncRNAs), que incluem os microRNAs (miRNAs). Entre eles, o miRNA-149 é particularmente relevante em diversos processos celulares, incluindo os reguladores oncogénicos.
Outra particularidade desta molécula é que o seu precursor (pre-miRNA-149) possui uma sequência rica em nucleótidos de guanina, que forma uma estrutura secundária denominada de G-quadruplex (G4), com topologia paralela que permite o seu reconhecimento pela proteína nucleolina. A estrutura de G4 tem sido associada à regulação de muitos processos celulares, como manutenção, replicação, transcrição e tradução de telómeros.
O presente trabalho descreve a produção e purificação de pre-miRNA-149 em E. coli DH5α. Para esse propósito, uma sequência de DNA pre-miRNA-149 foi clonada em um plasmídeo pBHSR1-RM e inserida nas células competentes por choque térmico. Após a fermentação, o RNA total foi purificado por cromatografia de afinidade, aproveitando o reconhecimento biológico do pre-miRNA-149. Utilizam-se três suportes cromatográficos de afinidade que foram naftaleno amina Sepharose, L-tirosina Sepharose e L-lisina Sepharose. Cada um deles já foi usado com sucesso para purificar biomoléculas similares. As frações eluídas foram avaliadas por PAGE desnaturante.
O isolamento completo do pre-miRNA-149 não foi alcançado em nenhum dos suportes; no entanto, foram obtidos alguns resultados promissores com o suporte de L-lisina, onde uma pequena porção de pre-miRNA-149 foi isolada num passo único, com gradiente decrescente de 2,05 M a 0,1 M de (NH4)2SO4 em Tris 10 mM (pH 6,0).
Como trabalho futuro pretende-se otimizar as condições cromatográficas experimentais que permitam separar o pre-miRNA-149 da mistura de RNA total, para ser utilizado em terapias baseadas em miRNA.
Palavras-chave
vii
Resumo Alargado
Com o advento das sociedades modernas, as doenças infectocontagiosas deixaram de ser o principal foco de preocupação (devido à vacinação e à melhoria das condições de higiene), sendo substituídas por outras, decorrentes quer do aumento da esperança média de vida, como cancro e as doenças neurodegenerativas, quer dos hábitos sedentários (doenças cardiovasculares, obesidade e diabetes, entre outras). Deste modo, estudos recentes têm-se focado em estudar e compreender os mecanismos que originam o aparecimento dessas doenças, como por exemplo o cancro, bem como formas de o tratar/prevenir, para dar resposta ao aumento da sua prevalência.
Previamente verificou-se que o gene lin-4 não codificava uma proteína, mas um pequeno RNA, responsável por regular a expressão da proteína LIN-14 em Caenorhabditis elegans, o modelo clássico proposto por Francis Crick em 1970 (Dogma Central da Biologia Molecular) foi posto em causa uma vez que levou ao aparecimento de uma nova classe de biomoléculas, os RNAs não-codificantes (ncRNAs), entre os quais se incluem os microRNAs (miRNAs). De entre o elevado número de microRNAs já caracterizados no ser humano, o miRNA-149 é particularmente relevante em diversos processos celulares, incluindo na regulação dos oncogenes.
Outra particularidade desta molécula é que o seu precursor (pre-miRNA-149) possui uma sequência rica em nucleótidos de guanina. Estes nucleótidos têm a capacidade de, através de ligações de hidrogénio, se organizar e formar estruturas denominadas quartetos. Vários G-quartetos, através de empilhamento π-π e por estabilização com catiões (K+ ou Na+) dão origem
a uma estrutura secundária designada por G-quadruplex (G4). Estas estruturas desempenham um papel fundamental em processos celulares essenciais tais como transcrição, recombinação e replicação. importância sua importância no ciclo de vida das células tem sido associada a inúmeras doenças, sendo o cancro uma das mais importantes.
Para poder intervir nesses casos em que há uma desregulação na atuação do G4 é necessário saber o número e tipo de nucleótidos envolvidos na formação do G4, a orientação das cadeias de RNA, entre outros. Por exemplo, o facto do pre-miRNA-149 G4 apresentar uma topologia paralela permite o seu reconhecimento pela nucleolina, uma importante proteína maioritariamente presente no nucléolo de células normais (bem como no citoplasma e membrana de células tumorais), que está envolvida na regulação da proliferação celular e da apoptose.
O presente trabalho descreve a produção e purificação de pre-miRNA-149 em E. coli DH5α. Para esse propósito, uma sequência de DNA pre-miRNA-149 foi clonada em um plasmídeo pBHSR1-RM e inserida nas células competentes por choque térmico. Após a fermentação e subsequente extração pelo método fenol/clorofórmio, o RNA total foi purificado por cromatografia de afinidade, aproveitando o reconhecimento biológico entre o suporte e o pre-miRNA-149.
viii
Para isso, utilizaram-se três suportes: naftaleno amina Sepharose, tirosina Sepharose e L-lisina Sepharose, uma vez que cada um deles já foi usado para purificar biomoléculas similares. As frações eluídas foram avaliadas por PAGE desnaturante.
A purificação do pre-miRNA-149 não foi conseguidacom nenhum destes suportes; no entanto, foram obtidos alguns resultados promissores com o suporte de L-lisina, onde uma pequena porção de pre-miRNA-149 foi isolada num único passo (baixa taxa de recuperação), com gradiente decrescente de 2,05 M a 0,1 M de (NH4)2SO4 em Tris 10 mM (pH 6,0).
Como trabalho futuro pretende-se otimizar as condições experimentais de purificação que permitam separar o pre-miRNA-149 da mistura de RNA total, para o utilizar em terapias baseadas em miRNA.
x
Abstract
A few years ago, was discovered that the lin-4 gene did not encode a protein, but a small RNA, responsible for regulating the expression of the LIN-14 protein in Caenorhabditis elegans. This promotes the study of a new class of biomolecules, the non-coding RNAs (ncRNAs), which include the microRNAs (miRNAs). Among them, the miRNA-149 is particularly relevant in the several cellular processes, including oncogenic regulators.
Another particularity of this molecule is that the precursor (pre-miRNA-149) have a G-rich sequence, which forms a special nucleic acid secondary structure called G-quadruplex (G4) with a parallel topology that allows its recognition by nucleolin (an important nucleolar protein). This structure has been associated to the regulation of many cellular processes, such as, telomere maintenance, replication, transcription and translation.
The present work describes the production and purification of pre-miRNA-149 in E. coli DH5α. For that purpose, a pre-miRNA-149 DNA sequence was cloned into a pBHSR1-RM plasmid and inserted within the previous competent cells by thermic shock. After fermentation, total RNA was and purified by affinity chromatography taking advantage of the biological recognition of pre-miRNA-149. Three affinity supports are used such as naphthalene amine Sepharose, L-tyrosine Sepharose and L-lysine Sepharose. Each of them has already been successfully used to purify similar biomolecules. The eluted fractions are evaluated by denaturing PAGE.
The complete isolation of pre-miRNA-149 was not achieved in the three supports tested; however, some promising results were obtained with the L-lysine support, where a small portion of pre-miRNA-149 was isolated into one single fraction (low recovery rate), with a decreasing stepwise gradient from 2.05 M to 0.1 M of (NH4)2SO4 in Tris 10 mM (pH 6.0).
Future affinity chromatography experiments are required to optimize the conditions to separate the pre-miRNA-149 from the total RNA mixture, to successfully use miRNA-based therapies.
Keywords
xii
Table of Contents
PageChapter I - Introduction
1 1.1 – miRNA 1.1.1 - Biogenesis1.1.2 – Regulation of mRNA expression 1.1.3 - miRNAs as therapeutic agents
1.1.3.1 - Role of miRNA-149 1.2 – G-quadruplex (G4)
1.2.1 – Structures of G4 1.2.2 – pre-miRNA-149 G4
1.3 - Recombinant Production of pre-miRNA-149 1.4 – Downstream Processing of pre-miRNA-149
1.4.1 – RNA Extraction
1.4.2 – pre-miRNA-149 Purification
1.4.2.1 – Reverse Phase Chromatography 1.4.2.2 – Anion Exchange Chromatography 1.4.2.3 – Size Exclusion Chromatography 1.4.2.4 – Affinity Chromatography 2 2 3 6 6 7 7 8 9 10 10 12 13 13 13 14
Chapter II – Materials and Methods
17 2.1 – Materials2.2 – Methods
2.2.1 - Construction of pBHSR1-RM-pre-miR-149 plasmid 2.2.1.1 – pre-miRNA-149 PCR
2.2.1.2 - pBHSR1-RM digestion 2.2.1.3 - T4 DNA ligase reaction 2.2.2 – Bacterial Transformation 2.2.3 – PCR-colony
2.2.4 – Miniprep RNA Extraction 2.2.5 – Master cell Banks 2.2.6 – Fermentation 2.2.7 – Total RNA Extraction 2.2.8 – Affinity Chromatography 2.2.9 – Denaturing PAGE 17 17 17 17 18 18 18 18 19 19 20 20 21 21
Chapter III – Results and Discussion
23xiii 3.2 – E. coli Transformation
3.3 – pre-miRNA-149 Production 3.4 – Total RNA Extraction 3.5 – pre-miRNA-149 purification
3.5.1 - Affinity chromatography with naphthalene amine support 3.5.2 - Affinity chromatography with L-tyrosine support
3.5.3 - Affinity chromatography with L-lysine support
25 29 30 31 32 34 36
Chapter IV – Conclusions and Future Perspectives
39xv
List of Figures
Page
Chapter I – Introduction
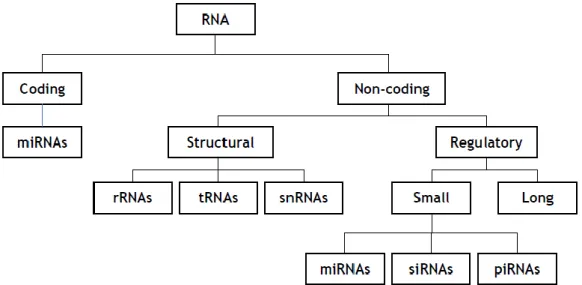
Figure 1 - Organogram highlighting the different classes and subclasses of the known
RNAs, according to their function within eukaryotic cells... 1
Figure 2 - miRNA biogenesis pathways, posttranscriptional regulation mechanisms and possible therapeutic approaches... 3
Figure 3 - The different effects of SNPs in the several stages of miRNAs life cycle (from biogenesis to gene regulation... 5
Figure 4 – G-quartet and G4 Structure... 7
Figure 5 - Biophysical characterization of pre-miRNA 149... 9
Figure 6 - Schematic of the upstream process... 10
Chapter III – Results and Discussion
Figure 7 - Agarose gel electrophoresis of pBHSR1-RM restriction digests with StuI and XBAI... 24Figure 8 - Agarose gel electrophoresis after a PCR of the pre-miRNA-149 DNA sequence.... 24
Figure 9 - E. coli cells incubated overnight at 37 ºC and 250 rpm, after transformation with pBHSR1-RM-149... 25
Figure 10 - E. coli growth after incubation of the 20 colonies chosen from figure 9... 26
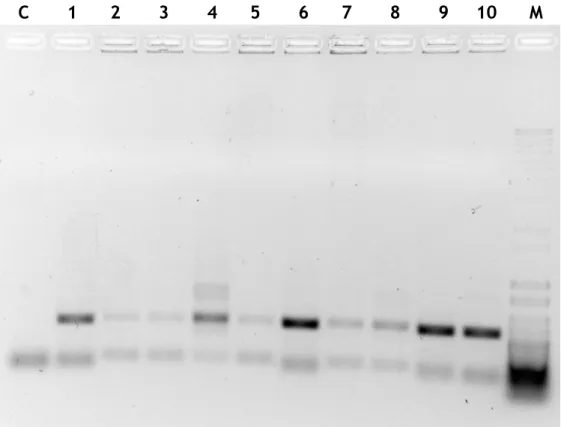
Figure 11 - PCR-colony products in an agarose gel electrophoresis (1,5%) of colonies 1 to 10... 27
Figure 12 - PCR-colony products in an agarose gel electrophoresis (1,5%) of colonies 11 to 20...27
Figure 13 - Agarose gel electrophoresis (1%) of the sample obtained after using the NZYMiniprep kit... 28
Figure 14 - Sequencing results of the pBHSR1-RM-149 plasmid... 29
Figure 15 - Growth profile of transformed E. coli DH5α... 29
Figure 16 - Agarose gel electrophoresis (1%) after RNA extraction... 30
Figure 17 - Representation of the chemical structure of the naphthalene amine support.... 32
Figure 18 - Chromatographic profile of pre-miRNA-149 purification screening with naphthalene amine support (pH 8.0) at 1 mL/min, with the respective denaturing PAGE... 33
Figure 19 - Chromatographic profile for the optimization of pre-miRNA-149 purification with naphthalene amine support (pH 8.0) at 1 mL/min, with the respective denaturing PAGE... 34
xvi
Figure 20 - Representation of the chemical structure of the L-tyrosine support... 35 Figure 21 - Chromatographic profile of pre-miRNA-149 purification screening
with L-tyrosine support (pH 8.0) at 1 mL/min, with the respective
denaturing PAGE... 35
Figure 22 - Chromatographic profile for the optimization of pre-miRNA-149
purification with L-tyrosine support (pH 8.0) at 1 mL/min, with
the respective denaturing PAGE... 36
Figure 23 - Representation of the chemical structure of the L-lysine support... 37 Figure 24 - Chromatographic profile of pre-miRNA-149 purification screening
with L-lysine support (pH 8.0) at 1 mL/min, with the respective
denaturing PAGE... 37
Figure 25 - Chromatographic profile for the optimization of pre-miRNA-149
purification with L-lysine support (pH 8.0) at 1 mL/min, with
the respective denaturing PAGE... 38
xviii
List of Tables
Page
Chapter I – Introduction
Table 1 - Summarized information regarding the most used extraction techniques
for RNA... 12
Table 2 - Advantages and disadvantages for each type of chromatographic
xx
List of Acronyms
A Adenine
AC Affinity Chromatography
AEC Anion Exchange Chromatography
Ago Argonaute
AP Ammonium Persulfate
C Cytosine
CD Circular Dichroism
DEPC Diethyl Pyrocarbonate
DNA Deoxyribonucleic acid
E. coli Escherichia coli
EDTA Ethylene diamine tetra-acetic acid
EMA European Medicines Agency
FDA Food and Drug Administration FOXM1 Forkhead box transcription factor
G Guanine
g gram
gDNA Genomic DNA
G4 G-quadruplex
HAA hexylammonium acetate
hnRNPs heterogeneous nuclear ribonucleoproteins IMAC Immobilized Metal Affinity Chromatography
LB Luria Bertani
M Molar
mg milligrams
mL milliliters
mM millimolar
mRNA messenger RNA
miRNA micro RNA
miRNA* micro RNA complementar strand miRISC microRNA-Induced Silencing Complex
NaCl Sodium Chloride
NaOH Sodium Hydroxide
NAI 2-methylnicotinic acid imidazole
ncRNA non-coding RNA
nm Nanometers
OD600 Optical Density at 600 nm
PAGE Polyacrylamide Gel Electrophoresis
PCR Polymerase Chain Reaction
pDNA Plasmid DNA
piRNA piwi-interacting RNA pre-miRNA precursor miRNA pri-miRNA primary microRNA
RISC RNA-Induced Silencing Complexes
xxi
RBPs RNA-binding proteins
RP Reverse Phase
rpm rotations per minute
SDS Sodium Dodecyl Sulfate
SEC Size Exclusion Chromatography
SELEX Systematic Evolution of Ligands by EXponential enrichment
SHALiPE Selective 2’-Hydroxil acylation Analyzed by Lithium Primer Extension siRNA short interfering RNA
SNPs Single Nucleotide Polymorphisms
T Thymine
TB Terrific Broth
TBAA Tributylammonium acetate
TBAB Tetrabutylammonium bromide
TEAA Triethylammonium acetate
TEMED Tetramethylethylenediamide Tris Tris(hydroximethyl)methylamine
tRNA transcription RNA
UTR Untranslated region
UV Ultraviolet
V volts
v/v Volume/volume
ºC Celsius
1
Chapter I
Introduction
Up until a couple decades ago, the scientists believed that most of the human genome (estimates varied from 75 to 98%) thought to be ‘junk’ DNA with no functional purpose [1], because it wasn’t involved in the synthesis of proteins, as explained by the Central Dogma of Molecular Biology [2].
In 1993, Victor Ambros and co-workers described the product of the lin-4 gene of
Caenorhabditis elegans. This gene was not translated into a protein but, instead, it was
transcripted into an ≈ 22 nucleotide long RNA responsible for negatively regulating the level of Lin-14 protein [3].
From that moment on, the field of RNA research has rapidly expanded, resulting in the discovery of an ever-growing number of small ncRNA genes identified in that junk DNA [1]. Many of those ncRNAs have already been shown to be essential for a variety of vital functions, such as controlling cellular proliferation and death, modulation of hematopoietic lineages in mammals [4] and neuronal patterning in nematodes [5]. They have a regulatory role at different levels of the genome function in eukaryotic cells, such as, the structure of chromatin, chromosome segregation, transcription, RNA processing, RNA stability and translation. The general name used to refer to these regulatory mechanisms is RNA silencing and encompasses all the previously mention phenomenon [6].
In the subclass of small regulatory non-coding RNAs three general categories were created: short interfering RNAs (siRNAs); microRNAs (miRNAs) and piwi-interacting RNAs (piRNAs).
Figure 1 - Organogram highlighting the different classes and subclasses of the known RNAs, according to their function within eukaryotic cells.
2
However, two of them have emerged as preferential (in the eukaryotic cells point-of-view) to gene regulation, which are: the miRNAs, who oversee the regulation of endogenous gene expression, and the siRNAs, that keep the integrity of the genome from foreign or invasive nucleic acids, whether it’s from viruses, transposons or transgenes [6]. Both have their function (post-transcriptional regulation) by association with RNA-induced silencing complexes, or RISC [7]. Both small non-coding RNA subclasses rely on the Dicer enzymes, which excises them from their precursors, and Ago clade to aid on their function as a silencing effector [8]. However, despite size similarities and sequence-specific inhibitory functions, some differences could be pointed out such as, the complementary of their precursors. miRNAs are processed from stem-loop precursors with incomplete double-stranded character, while siRNAs are excised from fully complementary double stranded RNAs [9].
1.1 – miRNA
1.1.1 – Biogenesis
Recent numbers of the miRbase Sequence Database released in March 2018 shows that, there are 38589 entries representing hairpin precursor miRNAs, expressing 48885 mature miRNA products, in 271 species different miRNAs [10].
Their biological synthesis is a multi-stage process, most of them follow the canonical miRNA biosynthesis pathway, which is dependent of Drosha-DGCR8 complex, while a minority of them are synthesized by alternative pathways, one of which involves the short intronic hairpins, or mirtrons.
Their life cycle begins with the RNA polymerase II transcribing the gene into a 70 base-pair structures called primary microRNAs, or pri-miRNA [11] from three different loci: intronic, intergenic or polycistronic [12]. Afterwards, the Drosha-DGCR8 complex processes the pri-miRNA, converting it into a precursor miRNA (pre-miRNA), that leaves the nucleus into the cytoplasm, aided by Exportin-5 and Ran-GTP, where the stem-loop is excised by the Dicer enzymes, originating a mature miRNA-miRNA* duplex [13]. Finally, it associates with a member of the Ago clade and two other proteins (forming the micro RNA-induced silencing complexes, or simply miRISC), triggering the duplex miRNA to split in two, with the miRNA* (complementary chain of the miRNA) being degraded shortly thereafter. This leaves the RISC ready to recognize and regulate the levels of a specific mRNA, by mRNA cleavage or translational repression [14] (Figure 2).
3 Figure 2 - miRNA biogenesis pathways, posttranscriptional regulation mechanisms and possible therapeutic approaches. (Adapted from [12])
1.1.2 – Regulation of mRNA expression
As previously mentioned, there are two methods for the miRISC to regulate the expression of mRNA, and what dictates which one is chosen it’s the degree of complementary between the miRNA seed region and the target sites in both untranslated regions (3’-UTR and 5’-UTR) of mRNA [15]. If the pairing between them is perfect, the regulation occurs by cleavage of the mRNA, if not, it will be due to the repression of the translation [16] (Figure 2).
This process is extremely delicate, with estimates pointing to one third of the human gene expression being control by these ncRNAs [17]. This research has shown that they are essential components in gene regulation and are involved in many diseases, including cancers, cardiovascular and neurodegenerative diseases.
One of the factors that can be responsible for those diseases are the Single Nucleotide Polymorphisms (SNPs), which are mutations in the pri-, pre- and mature forms of miRNAs, that modify the gene regulation process. They are divided in two different subgroups, according to their effect: the ones in the pri- and pre-miRNAs have effect in the biogenesis of miRNA; and the others have influence in the miRNAs capacity to recognize their mRNA targets sequences
4
(Figure 3). However, determining the effect of SNPs isn’t an easy task because the binding of the miRNA to an mRNA is supported by six to eight specific nucleotides out of the 950 (average size) in the 3’-UTR. This means that one miRNA can bind with hundreds of different mRNAs [18].
5 Figure 3 - The different effects of SNPs in the several stages of miRNAs life cycle (from biogenesis to gene regulation). On the left is displayed the normal process for comparison, while in the middle is represented three possible ways in which SNPs in the miRNA intermediates can lead to abnormal miRNA expression levels. On the right of this image is showed an example of SNPs within the seed sequence of miRNA, causing changes in the mature miRNA recognition of its mRNA target or even causing it to acquire a new target. In both cases there is the potential to alter the mRNA and protein levels, leading to diseases. (Adapted from [14])
6
1.1.3 – miRNAs as therapeutic agents
Studies involving human miRNAs showed important roles in metabolism, proliferation, differentiation and apoptosis. Moreover, aberrant miRNA expression is associated with diseases, including the development of several types of tumors [19], some of which include gastric, liver, breast, colon, lung and prostatic cancer. In cancer, miRNAs function as regulatory molecules, by regulating the expression levels of target genes with relevant roles in cellular life cycle. Thus, miRNAs can act as tumor suppressors or oncogenes [20]. This means that they can be used as potential therapeutic agents and even as biomarkers for diseases, in which it’s commonly referred as miRNA-based therapeutics [12].
Among the several miRNAs already identified in humans to-date, the miRNA-149 takes a special interest, due to the multiple roles that plays in human biology, associated to the developments of various types of cancers.
1.1.3.1 – Role of miRNA-149
The processing of pre-miRNA149 by cellular machinery produces two small isoforms: miRNA-149-5p and miRNA-149-3p, both of which have been shown to function as oncogenic regulators in cancers. miRNA-149-5p is far more prevalent than miRNA-149-3p according to reads of deep sequencing. Furthermore, the two isoforms sequences are completely different, meaning that the role played in human biology of gene and pathway signatures also differ [21].
While miRNA-149-5p is involved mostly in pathways necessary for tumor growth (some of which include ERBB-pathway, chemokine signaling, insulin signaling and MAPK signaling), miRNA-149-3p plays a role in tumorigenesis and tumor progression (vascular smooth muscle contraction-pathway, lysosome-pathway, T and B cell receptor signaling pathway, toll-like receptor signaling pathway, and focal adhesion-pathway) [21].
Tomomi Fujii and co-workers demonstrated that decreased levels of miRNA-149-5p was related to syndecan-1, a heparin sulfate proteoglycan silenced in prostate cancer [22].
Cancer metastasis is a multistep process that accounts for almost all cancer-related deaths. The improved ability of tumor cells to undergo migration and invasion contributes to the first step of this process. The Forkhead box transcription factor (FOXM1) is a typical transcription factor that regulates both G1-S and G2-M phases of cell cycle and mitotic spindle integrity, and its overexpression leads to tumor angiogenesis and metastasis [23]. The miRNA-149-5p targets the FOXM1, suppressing cellular migration [24], enabling its use as a therapeutic agent.
Another troubling factor in cancer treatment is the increasing resistance to chemotherapy, molecularly targeted therapies, and other anti-cancer drugs, which limits treatment effectiveness [25]. Studies have shown that miRNA-149 participates in regulating drug sensitivity and cancer resistance, namely the suppression of resistance to 5-Fluorouracil in colorectal cancer cells by miRNA-149-5p mimics [26].
7 The possibilities for this molecule don’t end in therapeutic purpose as there have been made considerable efforts to used it as a diagnostic marker, or biomarker, due to its high stability and differential expression in patients with cancer [27].
1.2 – G-quadruplex
Like proteins, nucleic acids adopt structural conformations that are related with their biological activity. Besides the well-known helix double strands adopted by genomic DNA (gDNA), both DNA and RNA can adopt other structural conformations like triplexes, hairpins, pseudoknots [28] stem-loops and G-quadruplexes (G4).
1.2.1 – Structures of G-quadruplex
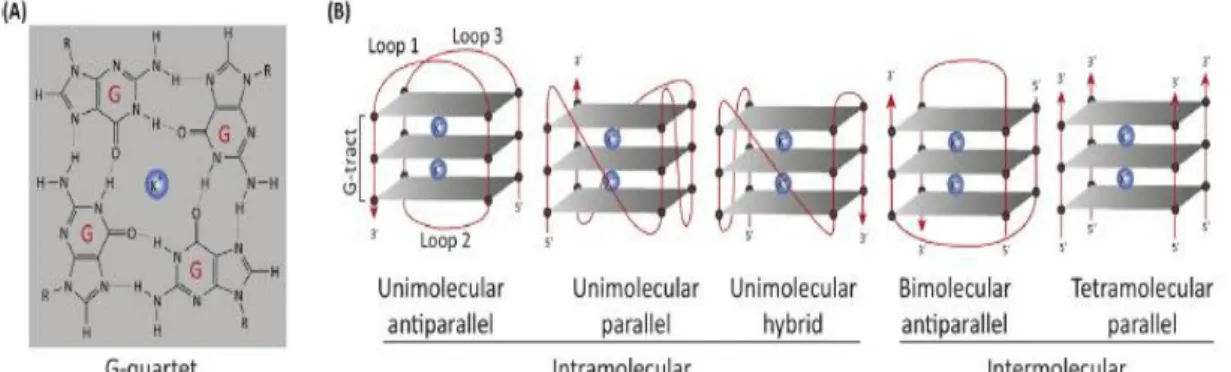
The quadruplexes are secondary structures of nucleic acids consisting of stacked G-quartets (four guanines associated by Hoogsteen hydrogen bonds) with connecting loops, and can be stabilized by cations, usually potassium or sodium (K+ and Na+) [15]. The structure can
adopt several conformations depending on some features, such as the orientation of the nucleic acid chains, loop topology, number of molecules involved and glycosidic bonds of the guanine nucleoside. Based on the number of molecules that form the G4 structure they can be unimolecular, bimolecular or tetramolecular [29]. G4 loops can be classified as lateral, diagonal or chain-reversed depending on the length, sequence or number of G-quartets [30]. According to the orientation of the strands that form the G4 structure there are three different conformations: parallel, anti-parallel or hybrid. [31] (Figure 5).
Figure 4 - G-quartet and G4 Structure. (A) One dimensional representation of a generic G-quartet stabilized with K+ cation. (B) Different topologies adopted by the G-quadruplex: Unimolecular parallel structure with three double chain reversal loops; Unimolecular hybrid structure with parallel and antiparallel strands; Bimolecular antiparallel structure; Tetramolecular parallel structure. (Adapted from [28])
8
1.2.2 – pre-miR-149 G-quadruplex
The presence of a high number of guanines in the sequence of the pre-miRNA-149 raises the possibility for the formation of a parallel G4 structure, which can be of great relevance, in terms of its applicability in therapeutic approaches, because it allows the recognition of the pre-miRNA-149 by a special protein named nucleolin. This protein is mostly present in the nucleolus of the eukaryotic cells but can be found in the cytoplasm and cell membrane. It belongs to the RNA-binding proteins (RBP) family of the heterogeneous nuclear ribonucleoproteins (hnRPNs) and it has been shown to be responsible for regulating the transcription, ribosome assembly, translation and, more recently, miRNA processing [32] as well as G4 recognition [33]. This is due to the nucleolin’s arginine/glycin-rich domain and four RNA-recognition motifs, capable to recognize its target RNAs (with AU-rich and/or G-rich sequences).
The ability to regulate such relevant cellular processes means that any deregulation of its levels leads to many diseases, particularly the protection against apoptosis and cellular proliferation [32].
In the work made by Kwok and coworkers, by using comparative sequence analysis, they have identified a conserved G4 sequence that partially overlaps with miRNA 149* (Figure 3A) and confirmed it with CD and UV-melting spectroscopic analyses (Figure 3B). Their experiment revealed that under 150 mM K+, the CD spectrum of the wildtype sequence shows a distinct
profile, when compared to the mutated sequence, consistent with a parallel G4 topology [34], as it can be seen in figure 3B. Furthermore, the melting temperature for the G4 sequence was above 90 ºC, which means that the G4 structure formed is highly thermostable under physiological K+ conditions. Additionally, they also predicted the secondary structure of the
pre-miRNA-149 with TurboFold [35], a useful tool which helps to determine the conformations with the lowest free energy possible, as well as calculating the probabilities of base paring (Figure 3A). As mentioned above, the sequence responsible for the G4 structure that overlaps with the hairpin structure of the pre-miRNA-149, possibly affecting the final conformation adopted.
To better understand the influence of the G4 structure in the folding of the hairpin structure of the pre-miRNA-149, a technique called SHALiPE, that couples the selective 2’-hydroxyl acylation with lithium ion-based primer extension and 2-methylnicotinic acid imidazole (NAI), to map the formation of G4 structures in the pre-miRNA-149.
9 Figure 5 - Biophysical characterization of pre-miRNA 149. A) The secondary structure model for the human pre-miRNA 149 was obtained using TurboFold. Also depicted in this image are the mature miRNA-149 sequence (miR149), its complementary strand (miR149*) as well as the region responsible for the G4 structure (rG4). B) Circular Dichroism spectrum, under K+ conditions, for a wildtype and mutant
pre-miRNa-149 sequence. The wildtype shows a higher molar ellipticity per nucleotide (Δε) around 260 nm, indicating the formation of a parallel topology G4 structure, while the mutant type does not. (Adapted from [34])
1.3 – Recombinant Production of pre-miRNA-149
Recently, the emergence interest in RNA G-quadruplexes, namely on pre-miRNAs, indicate the potential of RNA G4s to regulate post-transcriptional gene expression to control miRNA biogenesis.
The most widely used methods to produce pre-miRNAs consists on enzymatic (in vitro transcription) or chemical methods (via phophoramidite solid-phase chemical synthesis). However, these methods are expensive and the interest on novel recombinant methods using prokaryotic hosts, gained attention by researchers. Until now, only few strategies to biosynthesize pre-miRNAs using recombinant bacteria have been developed.
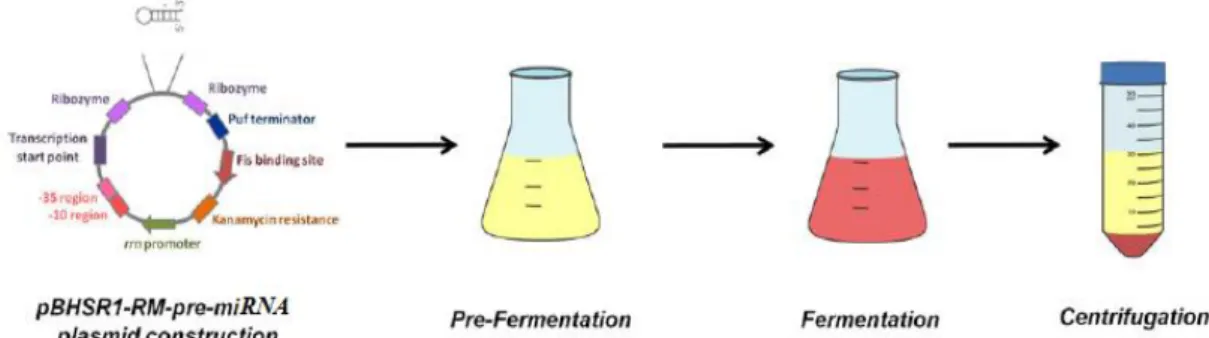
The first stage of the process consists on cloning the plasmid with the DNA sequence that encodes for the pre-miRNA of interest. E. coli DH5α and the pBHRSM-R1 expression vector have already been used for producing other similar biomolecules and has already been established avoiding time consuming steps (such as fermentation media components and concentrations, temperature, number of rotations per minute) to optimize the production step. Finally, a fermentation is carried under optimal conditions for E. coli growth to maximize the production of the pre-miRNA of interest (Figure 6).
A)
10
Figure 6 - Schematic of the upstream process, starting with the construction of the vector (plasmid with the DNA sequence for pre-miRNA-149) and the E. coli DH5α transformation. After that, the fermentation step to maximize cellular growth and pre-miRNA-149 production (stopping it in the log phase) and finally a centrifugation to recover the pellet from the media. (Adapted from [36])
1.4 – Downstream Processing of pre-miRNA-149
For therapeutic applications, the purity and quality of the RNA must be as high as possible. The downstream processing involves the design of a purification strategy to ensure that most of the contaminants are removed without losing or degrading the target molecule. Otherwise, the costs for its production increase substantially, compromising the viability of the entire process. While this may seem easy to do in theory, in most cases it’s not a very straightforward process, requiring researchers to have a deep understanding of all the variables that affect the productivity of the process.
Most of the recombinant biomolecules produced by the E. coli aren’t naturally excreted into the extracellular medium, so it becomes necessary to start with the recovery of the pre-miRNA-149 by performing cell lysis, which exposes all its intracellular content, meaning more contaminants that must be accounted for, as well as harsher condition to purify the RNA from the resulting solution. The next step is the purification of pre-miRNA-149 by affinity chromatography to obtain a sample with the recovery rate and degree of purity necessary for its use in therapeutics. In some biotechnological processes there is the need for a polishing step to ensure the maximum removal of impurities/contaminants to meet the strict requirements of the regulatory agencies.
1.4.1 – RNA Extraction
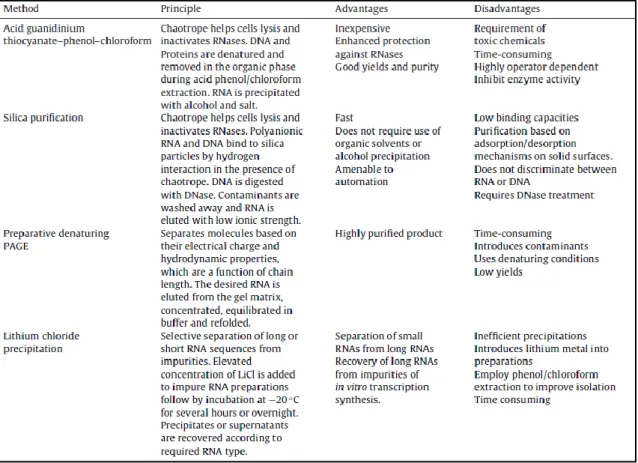
The complex mixture obtained after cell lysis can’t be immediately used in the purification step, because many contaminants are present at higher concentrations compared to the target pre-miRNA. Therefore, an intermediate step that removes some of the unwanted contaminants, as well as cellular debris is required. Currently, there have been employed several different methods, each one with its strengths and weaknesses. The most used is the acid guanidinium thiocyanate-phenol-chloroform extraction, developed by Chomczynsky and Sacchi in 1986 [37], due to the high purity and recovery yields obtained [38]. The reason for its success is the acidic
11 pH used, which is critical for separating RNA from DNA and proteins [38, 39]. However, it has drawbacks such as, the extremely hazardous and toxic reagents used for humans and the environment, if not handled properly. Furthermore, the RNA samples purified by this method tend to contain traces of some of the organic solvents used, which is leads to some doubts when they are meant for therapeutic use.
Another method being used to isolate RNA is the solid-phase extraction with silica membranes, which combined with guanidine-phenol extraction reduces the time spent to prepare samples. The binding of the nucleic acid to the silica matrix is achieved in the presence of high concentrations of guanidinium salts (4M or 6M) [40, 41] by removing the hydration layer around them. This step allows the cations to interact with both the nuclei acids and the silica matrix surface (negatively charged). With that ionic interaction established, the sample can be washed to remove the contaminants [42]. Because silica matrices can’t differentiate RNA from DNA, the complete isolation of the RNA is made with another step, either degrading the DNA (through DNases) or with a more specific column. For all of that, and because it still involves many evaporation steps and sample transfers, this method becomes a very lengthy process, in addiction of low recovery yields, usually due to the low binding capacity of the silica column (as they get overloaded) [43, 44].
A third approach to that problem is the use of preparative denaturing polyacrylamide gel electrophoresis, which is one of the most employed methods to resolve RNA samples, especially of synthetic RNA [45]. Because the tighter mesh of the gel, when compared to an agarose gel, it can effectively separate RNAs based of their size. Unfortunately, recovering the target RNA from the gel requires additional steps, such as the elution from the matrix, concentration, equilibration in a buffer and refolding it, making this whole process very exhaustive. Furthermore, the precipitation steps can cause an irreversible RNA aggregate (lowering the recovery yield) [46, 47], and the refolding step may not lead to the original secondary structure of the RNA, which can affect its biological activity and hamper its use in therapeutics. Plus, the remnants of unpolymerized acrylamide are a contaminant difficult to remove.
Other common method is the lithium chloride precipitation, mainly used to separate small RNAs (for example, miRNAs and siRNAs) from long RNAs. This is preferred over precipitation with an alcohol and a monovalent cation because it doesn’t precipitate the most troublesome RNA contaminants, such as DNA and proteins [48]. Plus, lithium chloride is soluble in ethanol, which means it doesn’t precipitate alongside the RNA, unlike ammonium or sodium acetate [45].
Recently, a new alternative method has been proposed by Nwokeoji et al., called RNASwift which is described as “an inexpensive, versatile method for the rapid extraction of RNA, free from phenol and chloroform”. This method lysis the cells and isolates RNA with SDS and sodium dodecyl, combined with an isopropanol precipitation or solid-phase extraction to rapidly obtain purified RNA. Results from spectrophotometry and ion pair reverse phase chromatography reveal that the RNA extracted by this method presents higher degrees of purity and recovery
12
yield when compared to two commercial kits, the RibopureTM bacterial RNA (Ambion) and
TRIzol® Max Bacterial RNA (Invitrogen) [49].
Table 1 - Summarized information regarding the most used extraction techniques for RNA (the RNASwift technique not included). (Adapted from [45])
1.4.2 – pre-miR-149 purification
This step requires a process with the ability to differentiate the molecule of interest (in this case, the pre-miRNA-149) from a wide range of other molecules that make up the intracellular content. Hence, and because of its ability to explore different types of interactions with an unlimited combination of stationary and mobile phases, the preferred method for this task is the chromatography. As if it wasn’t one of most versatile techniques ever developed, the new advances in the types of supports, namely the monoliths, and in the ligands that are immobilized onto them, have allowed the creation of more specific types of chromatography, such as affinity chromatography (AC), ion-paring reverse chromatography and immobilized metal affinity chromatography (IMAC).
In this section there will be explained the types which are most commonly used to purify RNAs in more detail, focusing on principles that allow RNA purification, as well as the advantages and disadvantages of each.
13
1.4.2.1 – Reverse Phase Chromatography
This chromatographic method relies on a stepwise decreasing of the hydrophobicity of the medium to separate the different molecules present in the sample. Recently, an improved method of reverse phase (RP) was described by H. Cramer et al., in which a long-chained alkyl amine (the ion-paring reagent) is added to the mobile phase at low concentrations, improving the resolution of the chromatography. The exact nature of its effect it’s not consensual, but the prevalent theory is that the charged ammonium cation acts as an ion exchanger on the surface of the stationary phase, separating charged species with hydrophobic groups. Since this technique relies on the ion-paring reagent, the selection of the appropriate one is critical. The most common one is triethylammonium (TEAA), but recently other molecules are being employed, such as tributylammonium acetate (TBAA), tetrabutylammonium bromide (TBAB), ethylenediamine acetate, hexylammonium acetate (HAA) and many others [50].
Despite that, very few attempts were made for scaling-up the process, partly due to the high costs of the two-phase components (toxic solvents are still necessary) and the relatively small loading capacity [51]. Also, the reagents used can be difficult to separate from the purified RNAs, which requires additional treatment before its safe for therapeutic approaches [45].
1.4.2.2 – Anion Exchange Chromatography
This technique takes advantage of the fact that each nucleotide possesses a negatively charged phosphate group, relying on reversible electrostatic interactions to separate the different RNAs according to their length (lengthier nucleotide sequences have more negative charges, thus more affinity for the immobilized ligand). Plus, the matrices used also present a degree of hydrophobicity, enabling the separation of double-stranded RNAs, due to the distinct hydrophobicity behaviors of the G-C and A-U base pairs [52], enhancing its resolution. When compared to RP chromatography, anion exchange chromatography (AEC) presents a much simpler alternative, when compared to RP, because it is performed in aqueous media (without expensive or toxic eluents) at lower pressures [53]. Regardless of its advantages, it usually requires the use of denaturation conditions to achieve a complete resolution of the sample. This means that is best suited for single-stranded RNAs, rather than double-stranded RNAs (like miRNAs and siRNAs). Recent advances in this area made this possible, with the development of two resins with the same functional group (quaternary amine): poly-(methyl-methacrylate) and polystyrene/divinyl-benzene beads, thus reducing the number of chromatographic steps [54].
1.4.2.3 – Size Exclusion Chromatography
This chromatographic method is best used as a final polishing step to removing salts (which may be cytotoxic for cells) carried over from previous purifications steps. Puglisi and coworkers
14
have successfully coupled SEC based methods with fast performance liquid chromatography systems allowing an improved removal of impurities from samples of RNA from in vitro transcription, such as pDNA, unreacted nucleotides and enzymes from the RNA product [55].
Another option tested was to couple it with the ion-paring RP chromatography, which increases the resolution obtained for ncRNA [56]. Furthermore, other issues regarding the ncRNA preparations, such as the analysis speed, sensitivity and sample contamination by the solvents were improved [45].
Because the components are separated by their size, the runs can be performed in non-denaturing conditions, avoiding the degradation and aggregation of the RNA molecules [55]. However, this technique needs more time-consuming steps, one of which is the extraction with phenol/chloroform [57].
1.4.2.4 – Affinity Chromatography
By mimicking the properties that allow the biological recognition of RNA, the affinity chromatography became a useful method to purify RNAs for therapeutic uses [58]. This is due to the capacity of establishing multiple interactions between the ligand of the stationary phase and the biomolecule of interest (from hydrogen bonding, to van der Waals forces and hydrophobic interactions), giving this technique a high resolution and selectivity, enabling the separation of the target biomolecule from a complex sample with high purity and recovery [59]. The matrix chosen is dependent on the thermodynamic and physicochemical properties of the molecular interactions. The elution can be made via two ways; either using a competitive ligand (specifically) or changing the pH, ionic strength or polarity (non-specifically) [45].
One of the most common ways to perform this type of chromatography is RNA tags, which consist on aptamers of RNA (selected according to the ligand) treated by the SELEX method (Systematic Evolution of Ligands by Exponential enrichment), binding them to immobilized streptavidin. This strategy relies on competitive elution with dextran or biotin to recover the target RNA [60]. The limitation of this method lies in the cost and availability or the proper resins [45]. Also, several other requirements are needed for the successful separation of the target RNA, such as keeping the tag on the RNA, steric blockage and folding. This means that very often denaturing conditions or more than one purification step must be used [61, 62].
Another option is using immobilized ligands, such as, amino acids because they can establish specific interactions as part of recognition mechanism [63, 64]. Among the amino acids that can be used are L-histidine, L-arginine and L-lysine [45], due to their positive charge. Their ability to achieve the purified RNAs, both in their native conformation and with high levels of integrity and purity has already been demonstrated in synthesized RNAs and with better results when compared to synthetic oligoribonucleotides.
15 Table 2 - Advantages and disadvantages for each type of chromatographic techniques for RNA purification (Adapted from [45])
And so, this work proposes to create a method (the recombinant production of pre-miRNA-149 in E. coli DH5α) as an alternative to chemical and in vitro synthesis of, as well as achieving the purification of pre-miRNA-149 with high recovery rates and degree of purity, capable of achieving the standards defined by the main regulatory agencies (FDA and EMA) for its use as a therapeutic agent in prostatic cancer.
For that purpose, the selected E. coli strand will be transformed with the pBHSR1-RM (containing the DNA sequence for the pre-miRNA-149) which, after the steps of fermentation and extraction, will be purified by an affinity chromatography using the three different supports (L-lysine, L-arginine and naphthalene). To evaluate the purification of pre-miRNA-149 (the
16
critical step in this process), a denaturing PAGE will be performed to assess the efficiency of each of the strategies used with the three chromatographic supports.
17
Chapter II
Materials e Methods
2.1 – Materials
All solutions were freshly prepared using 0.05% diethyl pyrocarbonate (DEPC) treated water. DEPC was purchased from Sigma-Aldrich (St. Louis, MO, USA). Lysine-Sepharose 4B was obtained from GE Healthcare Biosciences (Uppsala, Sweden). (NH4)2SO4 and K2HPO4 were obtained from
Panreac (Barcelona, Spain). PCR reagents, NaCl, and isopropanol were purchased from Thermo-Fisher Scientific (Fair Lawn, NJ, USA). KH2PO4 was obtained from Chem-Lab NV (Zedelgem,
Belgium). GreenSafe Premium, Tris(hydroximethyl)methylamine (Tris) and NZY Miniprep kit were acquired from NZYTech (Lisbon, Portugal). Guanidinium salt and all the chemicals used in the lysis buffer were obtained from Sigma-Aldrich (St. Louis, MO, USA). Acrylamide/bis-acrylamide 37.5:1 was purchased from Grisp (OPorto, Portugal). The solutions used in the chromatography were filtered through 0.22 μm pore size membrane (Whatman, Dassel, Germany) and degassed before use, and all salts were of analytical grade.
2.2 – Methods
2.2.1 – Construction of pBHSR1-RM-pre-miR-149 plasmid
2.2.1.1 - pre-miRNA-149 PCR
Using the plasmid pBHSR1-RM as template (Suzuki et al., 2011), a DNA fragment containing the pre-miRNA-149 DNA sequence was amplified by a PCR reaction. Firstly, in an initial denaturation step the reaction was heated to 95 ºC for 5 minutes to denature the pBHSR1-RM template. Thereafter, the denaturation step of each cycle heated the reaction at 95 ºC for 30 seconds. The reaction was then cooled to 60 ºC to enable annealing of the primers to the pre-miRNA-149 sequence of the pBHSR1-RM template. In the subsequent elongation step at 72 ºC for 30 seconds, the polymerization of nucleotides from the 3’ end of the primer was catalyzed by Taq Polymerase. The cycle is then repeated 34 times. Lastly, a final elongation step was performed at 72 ºC for 5 minutes.
Then, a gel agarose electrophoresis was performed to separate DNA fragments and evaluate the efficiency of the amplification. A Hyper Ladder I marker was used to check the molecular weight of each DNA fragment. After gel agarose electrophoresis, the pre-miRNA-149 band was excised and purified with GeneJET PCR Purification Kit (Thermo Scientific). Briefly, the excised gel mixture was dissolved in appropriate volume of binding buffer and heated at 58 ºC for 10
18
minutes. Thereafter, the solution was loaded on GeneJET purification columns and impurities were removed by the addition of the wash buffer containing ethanol. The purified pre-miRNA-149 fragment was then recovered with elution buffer. Finally, pre-miRNA-pre-miRNA-149 fragment was digested with StuI and XbaI at 37 ºC for 2 hours and purified, as previously mentioned, by GeneJET PCR Purification Kit (Thermo Scientific).
2.2.1.2 - pBHSR1-RM digestion
The plasmid (1 µL) was digested with the same pair of restriction enzymes, StuI and XBAI (1 µL each), for 2 hours at 37 ºC. After that the sample were runned on a 1% agarose gel electrophoresis in TAE buffer 1X (40 mM Tris, 20 mM Acetic acid and 1 mM EDTA, pH 8.0) and 0.6 µL of GreenSafe Premium (NZYTech, Lisbon, Portugal) were added to help visualize the results under UV irradiation.
2.2.1.3 – T4 DNA ligase reaction
For this step three reactions were carried out overnight at 4 ºC with different ratios of pre-miRNA-149 fragment/pBHSR1-RM plasmid (1:1; 1:3 and 3:1) and final volume of 20 mL each. After the incubation was done the next step was inserting the cloned plasmid inside the E. coli DH5α.
2.2.2 – Bacterial Transformation
Before starting the transformation process, the E. coli competent cells were defrosted on ice for 45 minutes. After that 10 µL of each of the three bonding reactions were added to 100 µL of the cells. The Eppendorf with the solution was gently shaken and incubated on ice for half an hour. Then, the samples were heat shocked at 42 ºC for 1 minute and placed on ice for 2 minutes. LB media (500 µL) was added and the samples were incubated in a rotary shaker for 2 hours at 37 ºC and 250 rpm. The cells were plated onto agar plates containing 30 µL/mL of kanamycin and grown overnight at 37 ºC. Finally, the three plates were stored at 4 ºC.
From those plates 20 colonies were selected and transferred into two new petri dishes with agar-agar and a PCR-colony was performed.
2.2.3 – PCR-colony
Before beginning this step, dilutions (1:20) of both primers (forward and reverse) stock solutions were made, as well as preparing 10 mL of NaOH 20 mM. Then 20 Eppendorf’s and 22 PCR tubes (20 samples + 2 controls) were numbered. Each of the 20 colonies chosen in the previous procedure were picked up with a micropipette tip and added to tubes with 10 μL of
19 NaOH, and then incubated at 95 ºC for 5 minutes. After that, and the PCR master-mix was prepared, and distributed into each PCR tube (each one had a final volume of 13 μL). Whereas the 20 samples consisted of 12 μL of the master mix plus 1 μL from the bacterial cells after the lysis with the 10 μL NaOH (from each colony) were added and 13 μL of master mix for the two controls. The amplification protocol performed used the same temperatures as in the pre-miRNA-149 PCR. After the PCR an agarose gel electrophoresis (1.5%) was made to assess the efficiency of the bacterial transformation as well as the amplification of the plasmid.
2.2.4 – Miniprep RNA Extraction
After the agar plates incubation, four colonies were randomly selected, and the success of the transformation step was evaluated with a NZYMiniprep kit (NZYTech, Lisbon, Portugal). According to the manufacturer, this procedure is based on a modified alkaline lysis, and then pre-purified in NZYTech spin columns charged with a silica gel-based anion-exchange resin washing away impurities, such as nucleotides, salts, proteins and small oligonucleotides.
The first step was the resuspension of 4 mL of harvested cells in A1 buffer (250 μL) and vortexed to homogenize it. The solutions were transferred to 1.5 mL Eppendorf’s and A2 buffer (250 μL) was added, after which the Eppendorf’s were carefully inverted 5-6 times to homogenize the solution. Then, the samples were incubated at room temperature for 4 min. The A3 buffer (300 μL) was added to neutralize lysis, and the tubes were inverted “up-and-down”. The lysate obtained was clarified by centrifugation at room temperature, 11000 RCF during 10 min. The supernatant was transferred to spin columns with a 2 mL tube collector and new centrifugation during 1 min in same conditions was performed to pass the solution through the column and bind pDNA to column. After that, AY buffer (500 μL) and A4 buffer (600 μL) were added to column to wash all impurities. The elution of pDNA was obtained with A7 buffer which contains a high salt concentration. Finally, the samples were stored at -20°C, for later use.
2.2.5 – Master Cell Banks
In a sterilized 50 mL Erlenmeyer, 10 μL of kanamycin (30 mg/mL) were added to 10 mL of LB-broth medium. Then the medium was inoculated with one of the colonies obtained in the PCR-colony step and it was incubated at 37 ºC and 250 rpm until a OD600 of 0,7 was obtained.
Afterwards, approximately 4 μL of glycerol were added, to achieve a ratio of 3:7 (glycerol/sample). Aliquots of 1 μL were transferred into cryogenic tubes and stored at -80 ºC.
20
2.2.6 – Fermentation
The fermentation was initiated with the inoculation of E. coli DH5α from master bank cell in LB-agar plates (35 g/L), which growth overnight at 37°C. Then, 125 mL of TB medium supplemented with 30 µg/mL of kanamycin was inoculated with one colony. The growth was carried out approximately during 4 h at 37°C. When OD600 reached 2.6, pre-fermentation was
stopped, and the fermentation was initiated with an appropriate volume calculated through following equation:
𝑂𝐷𝑝𝑟𝑒−𝑖𝑛𝑜𝑐𝑢𝑙𝑢𝑚× 𝑉𝑤𝑖𝑡ℎ𝑑𝑟𝑎𝑤 𝑓𝑟𝑜𝑚 𝑝𝑟𝑒−𝑖𝑛𝑜𝑐𝑢𝑙𝑢𝑚= (𝑉𝑤𝑖𝑡ℎ𝑑𝑟𝑎𝑤 𝑓𝑟𝑜𝑚 𝑝𝑟𝑒−𝑖𝑛𝑜𝑐𝑢𝑙𝑢𝑚× 𝑉𝑓𝑒𝑟𝑚𝑒𝑛𝑡𝑎𝑡𝑖𝑜𝑛) × 𝑂𝐷
Where:
OD = 0.2
The bacterial growth was performed in 1 L shake flasks with one quarter of its volume filled with Terrific Broth (TB) media (0.017 M KH2PO4, 0.072 M K2HPO4, 12 g/L tryptone and 24 g/L
yeast extract) at 250 rpm and 37 ºC, in a rotary shaker. After approximately 7 hours (late log phase), the growth was stopped, and the cells were recovered by centrifugation and stored at -20 ºC for further use.
2.2.7 – Total RNA extraction
Firstly, approximately 50 mL of pellet were resuspended in 20mL of NaCl 0.8%, transferred to a polypropylene tube and the RNAs were extracted using the method proposed by Chomczynski and Sacchi (1987) of acid guanidinium thiocyanate-phenol-chloroform with some minor modifications. After centrifugation at 6000G for 10 minutes at 4 ºC, 5 mL of solution D (4M guanidinium thiocyanate, 0.5% (m/V) sarcosil, 25 mM sodium citrate at pH=4.0 and 0.1 M β-mercaptoethanol) were added to the pellet, which was homogenized by pipetting “up-and-down” several times. Next the sample was incubated on ice for 10 minutes and then 0.5 mL of sodium acetate (pH=4.0) were added, followed by 5 mL of water-saturated phenol and 1 mL of chloroform/isoamyl alcohol (49:1). The mixture was homogenized by inversion after addition of reagents. After another incubation on ice for 15 minutes, the mixture was centrifuged at 10000G for 20 minutes at 4 ºC. This step led to the separation of RNA from cellular debris, genomic DNA and proteins were precipitated into the lower (organic phase) and interface, respectively. Then, 3 mL of the aqueous upper phase (rich in RNA) were transferred to a clean poly-propylene tube and 5 mL of isopropanol, at -20 ºC were added. Another centrifugation at 10000G for 20 minutes at 4 ºC was performed and the precipitate formed was recovered and resuspended in 1.5 mL of solution D. Thereafter, 1.5 mL of isopropanol was added, and the mixture was centrifuged at 10000G for 10 minutes at 4 ºC. The pellet obtained was dissolved in
21 2.5 mL of ethanol (75% v/v) and incubated for 12 minutes at room temperature to dissolve remaining residues of guanidinium. After that the samples were centrifuged at 10000G for 5 minutes at 4 ºC. The supernatant was discarded, and the pellet left to dry for 8 minutes at room temperature. Finally, the pellet was dissolved in 1 mL of water treated with DEPC 0,05% (v/v). To check the integrity of samples, 1% agarose gel electrophoresis (110 V for 35 minutes) was performed. The samples were quantified using a Nanodrop system.
2.2.8 – Affinity Chromatography
Affinity chromatography experiments were performed in an ÄKTA Avant system with UNICORN 6.1 software (GE Healthcare). Three affinity chromatography supports, Naphthalene, L-tyrosine and L-lysine were packed individually using 2.5 mL of each support.
All experiments were performed at room temperature and flow rate of 1 mL/min. The absorbance was continuously measured at 260 nm. Unless otherwise stated, the adsorption buffer used was 3 M (NH4)2SO4 and the elution solution was 10 mM Tris-HCl. The
chromatographic system was prepared with 3 M (NH4)2SO4 in pump A (mobile phase A), and 10
mM Tris-HCl (pH 8.0) in pump B (mobile phase B).Unless otherwise stated, a stepwise decreasing gradient from 2.2 M to 0 M (NH4)2SO4 in 10 mM Tris-HCl (pH 8.0) was used to purify the
pre-miRNA-149. Different pH values were tested for each affinity chromatography support (pH 6, 7 and 8). After purification, the fractions were pooled, according to the obtained chromatograms, concentrated and desalted with Vivaspin concentrators and analysed by polyacrylamide electrophoresis.
2.2.9 – Denaturation PAGE
Pooled fractions were analysed by vertical electrophoresis using BioRad system with 7.5% polyacrylamide gel and were then stained with Green Safe (1 μg/mL). Briefly, Urea (7.2 g) was dissolved in 5 mL of TBE buffer 10x (0.84 M Tris base, 0.89 M boric acid and 0.01 M EDTA, pH 8.3). Thereafter, 2.5 mL of acrylamide were added, and the polymerization reaction was initiated by adding 100 μL of AP and 12.5 μL of TEMED. Electrophoresis was carried out at 120 V for 90 min with TBE buffer 1x (0.09 M Tris, 0.09 M Boric acid and 2 mM EDTA, pH 8.3). The pooled fractions were previously denatured at 55ºC for 5 minutes with 97.5% formamide and the denatured conditions were kept in the gel due to the presence of 8 M urea. The pre-miRNA-149 in the gel was visualized using a Vilber Lourmt system (ILC Lda).
23
Chapter III
Results and Discussion
In recent years, the interest in the RNA interference technology (particularly with miRNAs) had a drastic increase, ever since its mechanism were fully understood by researchers. They played a very important role in the regulation of gene expression, and the slightest deregulation in their life cycle can have serious impacts in health, namely in a vast array of cancer types. One of the therapeutic approaches replace them with the ones produced recombinantly, by designing a full biotechnological process to obtain large amounts of highly purified miRNAs.
The main objective of the workplan is the development of a process capable of producing and purifying pre-miRNA-149 with high yields as well as high degrees of purity for therapeutic uses. For that propose, competent E. coli DH5α cells were transformed with pBHSR1-RM-149 plasmid. After the fermentation of the transformed bacterial cells, the RNA isolation was performed, based on acid guanidinium thiocyanate-phenol-chloroform extraction method developed by Chomczynsky and Sacchi. Finally, for the purification process three different supports (naphthalene amine; L-tyrosine and L-lysine) are used in the affinity chromatography to purify the pre-miRNA-149 from the total RNA mixture obtained from the extraction (evaluating them for their selectivity towards the pre-miRNA-149).
3.1 – Plasmid cloning
Before combining the plasmid pBHSR1-RM with the pre-miRNA-149 DNA sequence (or insert) it is necessary to perform a PCR of the pre-miRNA-149 DNA sequence as well as the digestion of both (plasmid and insert) with the same couple of restriction enzymes (StuI and XBAI).
24
1
Figure 7 - Agarose gel electrophoresis (1,5%) of pBHSR1-RM restriction digests with StuI and XBAI.
The restriction enzymes used cut the plasmid in two different sites, cleaving it into two inserts. In lane 1 of the electrophoresis (Figure 7) is visible that the two inserts migrate differently, due to the difference in sizes (the bigger insert migrates less, whereas the shorter one migrates further in the gel).
Figure 8 - Agarose gel electrophoresis (1.5%) after a PCR of the pre-miRNA-149 DNA sequence. M – Molecular Marker; C – Control; Lanes 1 and 2 – pre-miRNA-149 DNA sequenceamplified.
pre-miRNA-149
M C 1 2
25 In Figure 8 it is possible to conclude that the amplification of the pre-miRNA-149 DNA sequence in both lanes was successful, because the control lane (PCR reaction without the pre-miRNA-149 DNA sequence) does not have any bands, meaning that no unspecific amplifications of other DNA sequences occurred. However, in both samples it is possible to see two faint bands above the pre-miRNA-149 band, which may be the result of unspecific amplifications within the samples, therefore another PCR was performed to make sure that the pre-miRNA-149 DNA sequence was the only fragment amplified, to ensure that only that sequence is cloned into the plasmid.
Then, after digesting the insert with the same couple of restriction enzymes (StuI and XBAI), all is set for cloning the sequence on the pBHSR1-RM plasmid.
To evaluate the influence of the proportion of insert/vector of the T4 DNA ligase reaction step in the productivity of the bacterial cells (after transformation) three different ratios will be used (1:1; 3:1; 1:3).
3.2 – E. coli Transformation
The pBHSR1-RM-149 vector constructed was inserted into competent E. coli DH5α bacterial cells, which use their internal machinery to produce multiple copies of the plasmid as well as amplify the pre-miRNA-149 sequence. E. coli DH5α have some important mutations in several genes (relA, recA, endA and GyrA) that allow to improve plasmid production, while its integrity is not affected. By inoculating transformed E. coli DH5α cells in LB-agar medium supplemented with kanamycin (30 mg/mL) it is possible to select between the cells that were transformed (incorporated the plasmid) and the ones that did not.
Figure 9 - E. coli cells incubated overnight at 37 ºC and 250 rpm, after transformation with pBHSR1-RM-149. On the image to the left, the E. coli DH5α competent cells were transformed with the plasmid obtained by the T4 DNA ligase reactions proportion of 1:1, in the middle petri dish it was 3:1 and in the last one 1:3 (vector:insert).
26
After the incubation, several colonies formed in the three petri dishes. As it is visible in figure 9, the high number of colonies in each of the petri dishes limits their growth (limited nutrients in the medium). Additionally, that small number of cells per colony is insufficient for steps that follow. Therefore, 20 colonies were randomly chosen from the three bonding reactions and inoculated into two new petri dishes with LB-agar medium and incubated overnight at 37 ºC and 250 rpm, as can be seen in figure 10.
Figure 10 - E. coli growth after incubation of the 20 colonies chosen from figure 9.
Although the colonies that have grown in figures 9 and 10 have the gene responsible for antibiotic resistant (thus have incorporated the plasmid) it is not possible to assume that those colonies have the pre-miRNA-149 DNA sequence (the bonding reaction efficiency is not 100%). Therefore, it is necessary to confirm that the cells not only contain a plasmid, but they contain a plasmid with the pre-miRNA-149 DNA sequence within them. For that purpose, a PCR-colony was performed, allowing a quick screening of the 20 colonies. With the resulting amplification products an agarose gel electrophoresis was made, and the results are displayed in figures 11 and 12.
27 Figure 11 - PCR-colony products in an agarose gel electrophoresis (1,5%) of colonies 1 to 10. M – Molecular Weight Marker; C – Control; Lanes 1 to 10 – PCR-colony products for the respective colonies.
Figure 12 - PCR-colony products in an agarose gel electrophoresis (1,5%) of colonies 11 to 20. M – Molecular Weight Marker; C – Control; Lanes 11 to 20 – PCR-colony products for the respective colonies.
C 1 2 3 4 5 6 7 8 9 10 M
28
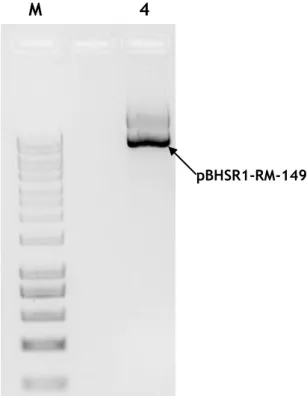
Although the expected result was to have one band in each sample (the one above in the gel, corresponding to the pre-miRNA-149 fragment) in all the colonies there are two bans present. Since the lower band is also present in both controls, it may be due to the formation of primer dimers. From the three ratios of insert/vector tested most prominent results (in terms of vector copies) were obtained for 1:1 ratio with 3 colonies (1, 4 and 6) showing intense bands. From the 3:1 ratio there were 2 colonies (9 and 10) with pre-miRNA-149 DNA sequence bands that highlight themselves and from the 1:3 ratio the colonies 17 and 20 stand-out from the rest. However, a high number of plasmid copies may not correspond to higher yields in the production of pre-miRNA-149. For example, in the ratio 1:3 (insert/vector), due to the excess amount of plasmid, despite the expected reaction between vector and insert, dimer formation from monomer plasmids can occur, creating colonies with high number of plasmid copies, but low yields of pre-miRNA-149. The method used to confirm the correct association between vector and insert and ensure that those colonies are the ones that may generate higher yields of pre-miRNA-149 is to perform a quick plasmid purification with a commercial kit. Afterwards, the purified plasmid should be sequenced to confirm the success of the cloning procedure. The results showed the purified plasmid of colony 4 (figure 13).
Figure 13 - Agarose gel electrophoresis (1%) of the sample obtained after using the NZYMiniprep kit. M – Molecular Weight Marker; Lane 4 – Purified pBHSR1-RM-149 from colony 4.
M 4
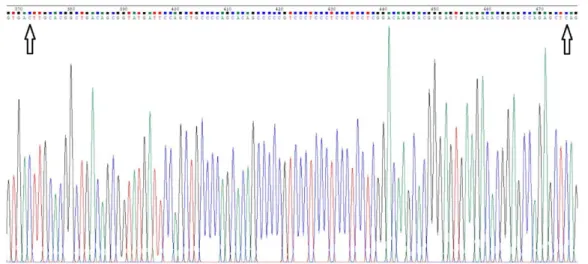
29 Figure 14 - Sequencing results of the pBHSR1-RM-149 plasmid. The black arrows indicate where the pre-miRNA-149 sequence begins (nucleotide 372) and where it ends (nucleotide 476).
3.3 – pre-miRNA-149 Production
E. coli DH5α is probably the most used strain for recombinant production of biomolecules
for therapeutic and diagnostic purposes. The medium used for cell growth and pre-miRNA-149 production was Terrific-Broth (TB) because it is enriched with high quantities of tryptone and yeast extract to enhance E. coli growth rate and achieve the desired high yields of pre-miRNA-149 production by extending the exponential phase of E. coli. This medium also contain potassium phosphates to maintain optimal pH values, as well as glycerol as an additional carbon source. The culture strategy used in all of experiments was batch fermentation because all of nutrients required to cell growth and pre-miRNA-149 production are present at the time of inoculation, simplifying the process. The bacterial cell growth profile was measured by optical density at 600 nm.