Cristiana Soares Lopes
Accuracy and adequacy of growth charts to assess the nutritional status of the
Portuguese child population
Has the use of the CDC 2000 growth curves and the WHO child growth
standards any predictive implication?
2010/2011Cristiana Soares Lopes
Accuracy and adequacy of growth charts to assess the nutritional status of the
Portuguese child population
Has the use of the CDC 2000 growth curves and the WHO child growth standards
any predictive implication?
Mestrado Integrado em Medicina
Área: Pediatria
Trabalho efectuado sob a Orientação de:
Prof.ª Dr.ª Carla Maria Barreto da Silva de Sousa Rêgo
Trabalho efectuado segundo as normas de:
Obesity Reviews
« We are guilty of many errors and many faults, but our worst crime is abandoning the
children, neglecting the foundation of life. Many of the things we need can wait. The child
cannot. Right now is the time, his bones are being formed, his blood is being made and his
senses are being developed. To him we cannot answer “tomorrow”. His name is “today”. »
Gabriela Mistral – Nobel Prize in Literature (1945)
1
ACCURACY AND ADEQUACY OF GROWTH CHARTS TO ASSESS THE
NUTRITIONAL STATUS OF THE PORTUGUESE CHILD POPULATION. HAS
THE USE OF THE CDC 2000 GROWTH CURVES AND THE WHO CHILD
GROWTH STANDARDS ANY PREDICTIVE IMPLICATION?
Abstract
Objectives: The aim of this study is to compare the CDC 2000 Growth Charts to the new recommended WHO Child Growth Standards and by doing so, to determine the accuracy and adequacy of the referred growth charts in assessing the nutritional status of the Portuguese child population.
Methods: On June 2010, a total of 487 children and adolescents aged 6-16 years from a private school in Oporto were examined; eating habits, daily physical activity, physical performances and a standardized physical examination with measurement of standing height and weight were performed. All data available on October 2010 were analysed and after exclusion of 33 children and adolescents with missing data, 454 children and adolescents remained for the final analysis.
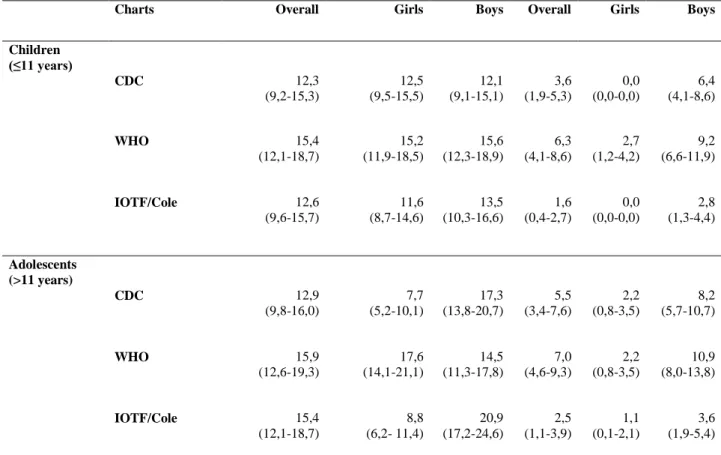
Results: The difference in the prevalence of overweight children is 3.1 percentage points higher with the WHO charts as compared to the CDC charts. This difference remains almost the same (3.0 percentage points) for adolescents. The prevalence of obesity in children is persistently higher with the WHO charts and the difference in the prevalence of obesity remains quite the same regardless of gender (2.7 percentage points for girls vs. 2.8 percentage points for boys). When considering the adolescent population, the overall prevalence of obesity remains higher on the basis of the WHO charts.
Conclusions: The comparative analysis of Oporto’s population sample demonstrates that the prevalence of overweight/obesity varies considerably depending on which growth charts in combination with which cut-off values are applied. The CDC 2000 growth charts, as well as the IOTF/Cole references tend to underestimate the prevalence of childhood and adolescence overweight and obesity when compared to the WHO growth standards, regardless of age and/or gender.
Key words: Overweight, obesity, WHO, CDC, growth charts.
Acknowledgments
The work described in this paper would not have been possible without the generosity and interest of Professor André Seabra (FADEUP) who kindly handed up the data base collected for the purpose of the intervention program to promote healthy lifestyle habits among the Portuguese school-aged population, as well as without the patience and dedication of Professor Carla Rêgo who over and over again review this manuscript and generously gave unrestricted help, support and motivation.
2 Introduction
Growth and development are innate characteristics of childhood. Growth is the increase in size of a child while development is the progressive acquisition of physical, cognitive, linguistic, social and emotional attributes. Progress in growth and development is age-related, and several factors, acting independently or in combination, influence the rate and pattern of growth and development. These factors include biological, pathological, psychological and social factors, such as genetic inheritance, sex, race, hormonal maturation, and intrauterine exposure to certain stimuli, chronic or acute diseases, feeding practices, child rearing environment as well as the family’s socio-economic status.
Assessment of health is particularly challenging in childhood and adolescence. The concepts underlying health status for children and adolescents are different from those for adults, precisely because they are involved in dynamic processes called growth and development. In fact, growth is the single most important indicator of health and monitoring growth is fundamental for health evaluation in childhood and adolescence as well as a predictive indicator of health status in adulthood.
Growth charts were developed to provide an objective evaluation of the child growth and health status in clinical assessment and epidemiology. They are used as references or standards to screen inadequate growth, such as stunting, underweight and wasting or overweight and obesity in children and adolescents. So, growth assessment defines the health status as well as the nutritional status, because disturbances in health and nutrition, regardless of their aetiology, invariably affect child and adolescent growth.1
One can take two types of approaches to develop growth charts: a) a “descriptive approach”, which describes how representative samples of children in the entire population grow; and b) a “prescriptive approach”, which describes how well-nourished, healthy children who adhere to established feeding and health care recommendations should grow.2Descriptive growth charts, for example the CDC 2000 Growth Charts, provide references and define the growth status of children in an actual population, in a particular place and time. Prescriptive growth charts, for example the WHO Child Growth Standards, provide standards and define bounds of normal, healthy growth and consequently health problems.
The health, growth and/or nutritional status are usually assessed by anthropometric measurements. Anthropometry is a universally applicable, inexpensive, and non-invasive method to assess the proportions, size and composition of the human body.3 It is the best general proxy measurement of human well-being, reflecting dietary inadequacies, infectious diseases and other environmental health threats. As a matter of fact, it reflects both health and nutrition, at individual and collective levels, and predicts subsequent ill health, functional impairment and/or mortality.
At least four variables need to be collected: a) age; b) weight; c) height or length; and d) gender. When two of these variables are used together they are called an index. Four indexes are commonly used: a) weight-for-age; b) height/length-for-age; c) weight-for-height/length; and d) BMI-for-age.
3 When anthropometric measures have been correctly recorded, clinicians and researchers can assess the child’s growth or nutritional status by using standardized age- and sex-specific growth references to calculate height/length-for-age, weight-for-age, weight-for-height/length and BMI-for-age Z-scores or percentiles. The Z-score system expresses anthropometric values as several standard deviations (SDs) below or above the reference mean or median value.4 Z-scores and percentiles are equivalent units of measurement, because any percentile can be converted to a Z-score and any Z-score can be converted into a percentile.
Malnutrition describes deficiencies, excesses or imbalances in energy, protein or other nutrients’ intake.5 It is regarded as one of the most serious and challenging problems in public health worldwide. The prevalence of under-nutrition remains pervasive, particularly among infants and young children in several developing countries. On the other hand, there is a rapid increase in childhood overweight and obesity in both developed and developing countries, although in different speeds and in different patterns.6 Societies enter different stages of what is called the nutrition transition, predominantly caused by rapid urbanization and globalization of the human diet. Globally, malnutrition continues to affect many populations, with adverse effects on health, mortality, and productivity as well as in terms of health status later in adult life. We assist to a pattern of disease shift away from infectious and nutrient deficiency diseases toward higher rates of non-insulin-dependent diabetes, coronary heart disease and some types of cancer. Thus, preventing malnutrition is of the outmost importance. The decision as to whether to intervene requires an accurate identification of children at high risk and this is what the growth charts are for.
Portugal followed developed/western countries’ trend because of the shifting of lifestyles towards more sedentary and urban living, and demonstrated a dramatic rise in childhood overweight and obesity over the last two decades. In 2008-2009, a study was undertaken by the Portuguese Society for the Study of Obesity (SPEO) to determine the prevalence of overweight and obesity among the Portuguese child and adolescent population. In the total sample and using the CDC growth charts and cut-offs, 16.5% of overweight (85th percentile≤ BMI <95th percentile) and 12.5% of obese (BMI ≥95th percentile) children aged 2-5 years as well as 16.9% of overweight and 11.3% of obese adolescents 11-15 years old were reported. Simultaneously, the WHO – European Childhood Obesity Surveillance Initiative (COSI – Portugal) equally using the CDC criteria, estimated the prevalence of overweight children aged 6-10 years to be 18.1%. In the same sample of children, the prevalence of obesity was 13.9%. In fact, the overall prevalence of excess weight in young children 6-10 years old was reported to be 32% in Portugal.7 Considering the increasing prevalence and importance of overweight and obesity among the Portuguese child population, this study will exclusively focus on the accurate identification of overweight and obese children and adolescents.
Which definitions should be used to distinguish obese children, and which definitions are appropriate for clinical practice and epidemiology?
4 Obesity is, by definition, an abnormal or excessive body fat accumulation that presents a risk to health.8 Its assessment should ideally be based on measurement of body fat, such as body fat percentage or body fat mass. Measurement of adiposity in children and adolescents can use a range of methods, both direct and indirect. Direct techniques for body composition assessment include hidrodensitometry, magnetic resonance imaging (MRI), computerized tomography (CT) and dual-energy X-ray absorptiometry (DEXA). Bioelectrical impedance analysis (BIA) and air-displacement plethysmography are both indirect methods based on the relation between body volume, height and electrical impedance and between body volume, mass and densities, respectively. Nevertheless, measurements of body fatness are rarely possible in clinical practice and frequently unsuitable for epidemiological work. Therefore, simpler and reproducible measurements of body fatness are preferred. Anthropometric measures of relative adiposity, such as waist, hip and other girth measurements, skinfold thickness and indexes derived from measured height and weight, such as the body mass index [BMI = weight (kg)/height² (m²)] are commonly used.9 BMI is a simple and convenient proxy measure of adiposity which is now widely recommended for paediatric use.10 It has a high specificity (95-100%), and so will identify few non-obese children as obese. On the other hand, it has a low sensitivity (36-66%), which is a problem in terms of epidemiological work, as it will considerably underestimate the prevalence of obesity. A further limitation of BMI is its inadequacy to discern trends in obesity. When BMI increases in populations over time changes in lean body mass cannot be readily distinguished from changes in body fatness.11, 12
Obesity definitions in childhood which use BMI rely on cut-off values relative to age- and sex-specific growth references. The limitations of BMI can be minimized in children by choosing the most adequate growth references and cut-off values. The question is: which growth references and cut-off points are the most adequate and reliable for clinical practice and epidemiology?
The CDC 2000 Growth Charts have their origin in the charts published by the National Centre for Health Statistics (NCHS) in 1977. These original charts were based on data from the Fels Longitudinal Growth Study as well as from nationally representative surveys. However, they showed some flaws that motivated their revision in 1978 and in 2000 by the Centres for Disease Control and Prevention (CDC). The main concern centred on the Fels Research Institute data used to develop the children charts. The data were not representative of the entire country; there was a lack of racial diversity; the infants included were primarily formula fed; and there was a large disjunction in length and height measurements between the infant and older child growth curves between 24 and 36 months of age.13 The CDC charts for the United States were based on cross-sectional data from various sources: National Vital Statistics (birth weights); Missouri and Wisconsin Vital Statistics (birth lengths); Paediatric Nutrition Surveillance System (lengths); NHANES I (1971-1974); NHANES II (1976-1980); and NHANES III (1988-1994).14 The curves for children aged 2-59 months were primarily based on data from NHANES (i.e. a continuous cross-sectional survey of the health and nutritional status of US civilian, non-institutionalized population). However, no NHANES data were available for
5 infants aged <2 months, so emerged the need to add younger-aged infants data from other sources, namely from the CDC Paediatric Nutrition Surveillance System (PedNSS). The CDC growth charts excluded very low birth weight infants (<1500g) but had no inclusion or exclusion criteria related to feeding or environmental variables. No overweight measurements were excluded.
As a matter of fact, during the last thirty years (1978-2006), the World Health Organization (WHO) adopted the NCHS/CDC charts as an international reference and recommended their use to assess growth and health status among children and adolescents worldwide.
In 1997, the World Health Organization launched the Multicentre Growth Reference Study (MGRS) to collect data on the growth of children worldwide based on strict inclusion and exclusion criteria. Data collection was completed in 2003 and the charts were released in 2006.
The 2006 WHO Growth Curves for children under 5 years of age are based on the data collected in six sites: Pelotas, Brazil; Accra, Ghana; Delhi, India; Oslo, Norway; Muscat, Oman; and Davis-California, USA. The study has two components: a) a longitudinal component of children aged 0-24 months; and b) a cross-sectional component of children aged 18-71 months. The criteria for inclusion in the MGRS were: a) socioeconomic status that does not constrain growth of the child; b) low enough population mobility to allow for 2-years follow-up; c) at least 20% of mothers in the community willing to follow international feeding recommendations, namely d) exclusive breastfeeding for at least 4 months; e) introduction of complementary foods by at least 6 months but not before 4 months; and f) continued breastfeeding for at least 12 months. The exclusion criteria were: a) maternal smoking during pregnancy or lactation; b) birth at <37 weeks or >42 weeks; c) multiple birth; and d) substantial morbidity. Weight-for-height >3 SDs from the overall study median were considered to be outliers and excluded from the final sample.14
The WHO growth standards are based on the confirmed hypothesis (i.e. the mean length measurement of children aged <24 months in the six country sites were virtually identical) that all children have the potential to grow similarly, regardless of their ethnic group or place of birth, if they are in a healthy environment and receive adequate nutrition and health care.
Experts rapidly agreed that an appropriate single growth reference for the screening, monitoring and surveillance of school-aged children and adolescents was needed. They also agreed that a multicentre study, identical to the one developed for the 2006 WHO Child Growth Standards, would not be possible for older children, because it would not be possible to control the dynamics of their environment. As an alternative, a growth reference was developed. The WHO reconstructed the 1977 NCHS/WHO growth reference using the original sample, supplemented with data from the 2006 WHO Child Growth Standards, and applying the state-of-the-art statistical methods used to develop the standards for preschool children. In 2007, the WHO Growth Reference for school-aged children and adolescents 5 to 19 years old was published based on three data sets: a) Health Examination Survey (HES) Cycle II (6-11 years); b) HES Cycle III (12-17 years); and c) Health and Nutrition Examination Survey (HANES) Cycle I (1-24 years). The 2007 WHO Growth References are almost
6 perfectly aligned with the 2006 WHO Child Growth Standards at 5 years and at 19 years of age, the 2007 BMI values for both sexes at +1 and +2 SD values (25.4 kg/m² for boys; 25.0 kg/m² for girls and 29.7 kg/m² for both sexes, respectively) are equivalent to the overweight and obesity cut-offs used for adults (≥25.0 kg/m² and ≥30.0 kg/m², respectively).15
Reference sets of charts, such as the 2000 CDC Growth Charts and the WHO Growth Standards are intended for clinical use in monitoring children’s growth. They are not specifically intended to define overweight and obesity. There are a number of sets of BMI reference data, such as the IOTF/Cole references that are specifically conceived to define childhood overweight and obesity and these include specific cut-off values.16
Wang Y. and Wang J. Q.17 in 2002 compared the three major international reference sets of BMI values used to assess child and adolescent overweight and obesity: a) The Must, Dallal and Dietz (MDD) references, based on data from the US NHANES I collected in 1971-1974, which recommend the sex-specific smoothed 85th and 95th percentiles to classify child/adolescent overweight and obesity, respectively. These cut-off values are still used in many countries, inclusive in Portugal through the CDC 2000 Growth Charts. b) The IOTF/Cole references, with sex-age-specific BMI cut-off points developed from sex-specific BMI-age curves based on six nationally representative data sets from Brazil, UK, Hong Kong, the Netherlands, Singapore and the USA, that pass through a BMI of 25.0 kg/m² for overweight and 30.0 kg/m² for obesity at age 18 years. The latter are adult BMI cut-offs, which are good indicators of risk of adverse health outcomes. c) The WHO references, which use the weight-for-height Z-score +2 SD (which corresponds to the 97.7th percentile) to classify children under 10 years of age as overweight. They do not provide a reference for obesity for children of the same age group. The sex-age-specific BMI 85th percentile developed by Must et al. and both the same BMI 85th percentile and triceps skinfold thickness 90th percentile are used to classify adolescents (10-19 years) as overweight and obese, respectively. Wang et al. showed that the IOTF, MDD and WHO references produce similar estimates for the overall combined prevalence of overweight and obesity. However, the WHO references produce slightly higher estimates for children and lower estimates for adolescents than the IOTF references.
Nowadays, the WHO suggests in its training course on assessment of child growth the Z-scores +1, +2 and +3 SDs as cut-off points for defining children as at risk of overweight, overweight and obese, respectively.18
Each reference has its own limitations; one should be aware of those limitations and should be cautious when comparing results based on different references. Considering the simplicity of use and the relationship with BMI cut-off values used for adults (which avoids some arbitrariness of choosing reference cut-offs), the IOTF/Cole references seem to be slightly superior.12, 19, 20 Nevertheless, the IOTF/Cole cut-off values have not been endorsed at national level for clinical use in monitoring children’s growth, but they are largely recommended for international comparisons of prevalence of overweight and obesity.19
7 Material and methods
In 2010, FADEUP (Faculdade de Desporto da Universidade do Porto) initiated an intervention program to promote healthy lifestyle habits among the Portuguese school-aged population. In a first approach, all children and adolescents aged 6-16 years from a private school in Oporto were included in this program. The FADEUP team examined, on June 2010, a total of 487 children and adolescents as they attended their sports classes and were lightly dressed; the FADEUP team undertook a person by person interview to assess eating habits and daily physical activity followed by an overall evaluation of their physical performances and a standardized physical examination with measurement of standing height and weight as well as a bioelectrical impedance analysis.
For the purpose of this study, all data available on October 2010 were analysed and after exclusion of 33 children and adolescents with missing data namely birth date, gender specification or height and/or weight measurements, 454 children and adolescents remained for the final analysis.
Three sets of cut-off values were used to define overweight and obesity. Overweight was defined as BMI-for-age ≥85th percentile and <95th percentile (CDC) or ≥85th percentile and <97th percentile (WHO) or ≥25.0 kg/m² and <30.0 kg/m² at age 18 (IOTF/Cole). Obesity was defined as BMI-for-age ≥95th
percentile (CDC) or ≥97th percentile (WHO) or ≥30.0 kg/m² at age 18 (IOTF/Cole). The WHO recommendations (Z-score +2SD≤ BMI <+3SD to define overweight and Z-score BMI ≥+3SD to define obesity) were expressed as the corresponding percentile definitions to put the 3 sets of cut-off values on a common basis.
All data were analysed with Nut Stat (Epi Info version 3.5.3) software of the CDC and Anthro Plus version 1.0.4 of the WHO to calculate percentiles and Z-scores for the sex-specific CDC 2000 and the WHO 2006/2007 references, respectively. To establish an IOTF/Cole references-based analysis of the data collected, international cut-off points for BMI for overweight and obesity by sex between 2 and 18 years published by Cole et al.19 were used. The data obtained were further statistically treated with Microsoft© Excel 2010 software. All prevalence estimates and 95% confidence intervals (95% CI) were summarized in 2 age groups, ≤11 years (n=253) and >11 years (n=201), as children and adolescents, respectively.
Results
Shown in Figures 1-4 and Table 1 are comparisons of the overall prevalence of overweight and obesity for Oporto’s population sample of children and adolescents aged 6-16 years (Fig. 1 and 3), as well as the prevalence of overweight and obesity for the same population stratified by sex (Fig. 2 and 4) on the basis of the CDC 2000, the WHO 2006/2007 and the IOTF/Cole growth charts. All comparisons are made according to the biologic age, i.e. according to age groups ≤11years and >11 years.
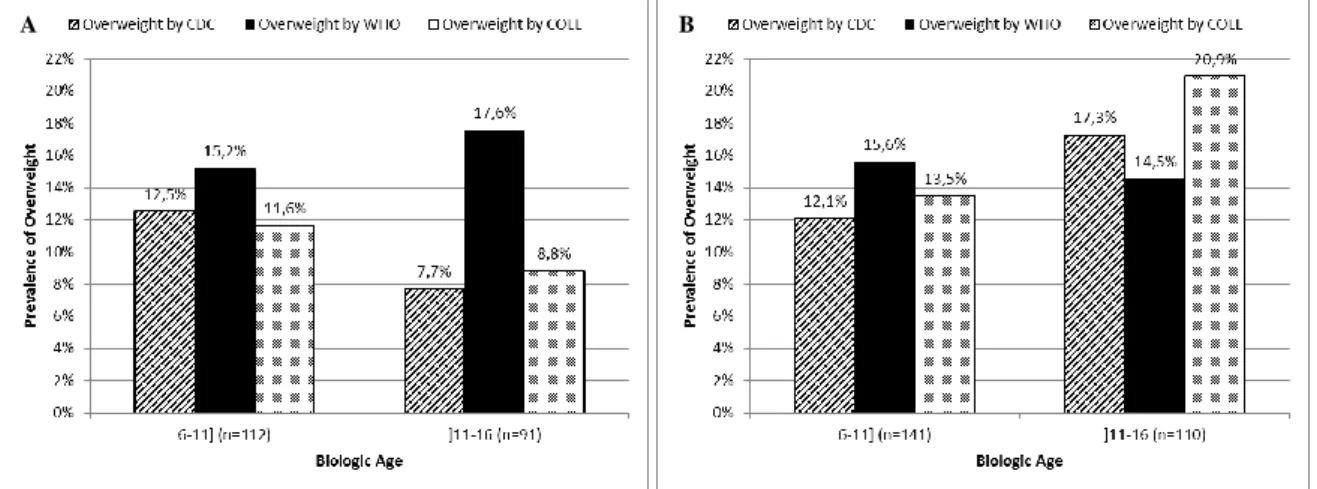
When we compare the prevalence of overweight in children (≤11 years), the difference in the prevalence of overweight is 3.1 percentage points higher with the WHO charts as compared to the
8 CDC charts. This difference remains almost the same (3.0 percentage points) for adolescents (>11 years) (Fig. 1). The prevalence of overweight stratified by sex among children remains higher on the basis of the WHO charts and the difference in the prevalence of overweight is higher among boys (2.7 percentage points for girls vs. 3.5 percentage points for boys) (Fig. 2). However, when considering the sex-specific prevalence of overweight among adolescents, this varies considerably. In fact, the prevalence of overweight in boys >11 years old is higher on the basis of the CDC charts than on the basis of the WHO charts (Fig. 2B).
Figure 1 Comparison of the prevalence of overweight (BMI-for-age) based on the CDC 2000 and the WHO 2006/2007
growth charts and on the IOTF/Cole references for Oporto’s population sample of children (≤11 years) and adolescents (>11 years), respectively.
Figure 2 Comparison of the prevalence of overweight (BMI-for-age) based on the CDC 2000 and the WHO 2006/2007
growth charts and on the IOTF/Cole references for Oporto’s population sample of girls (Panel A) and boys (Panel B) ≤11 years and >11 years, respectively.
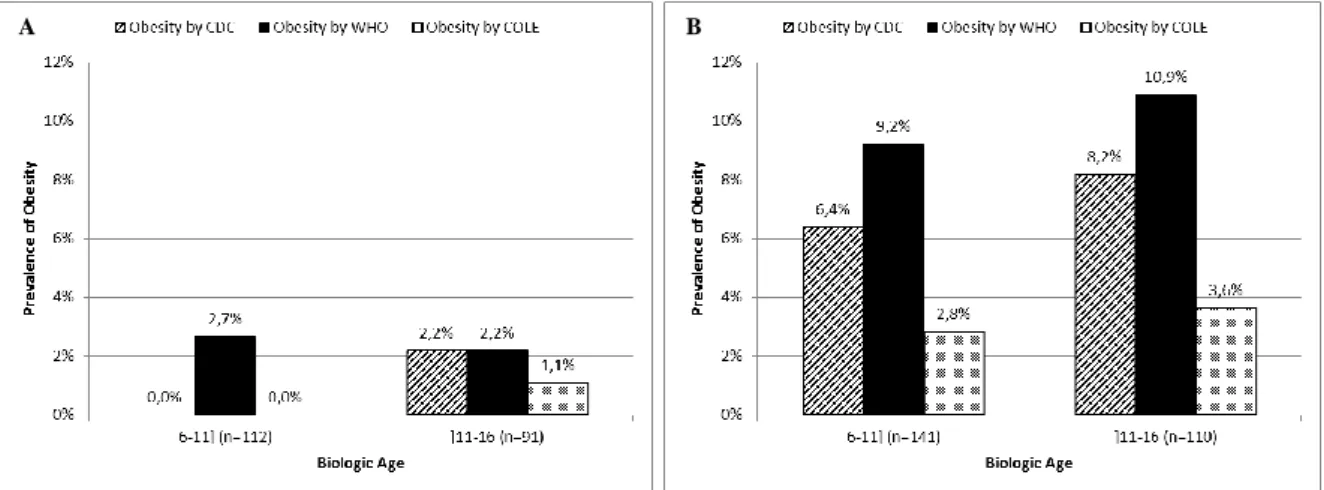
9 The prevalence of obesity in children is persistently higher with the WHO charts and the difference in the prevalence of obesity remains quite the same regardless of gender (2.7 percentage points for girls vs. 2.8 percentage points for boys) (Fig. 4). When considering the adolescent population, the overall prevalence of obesity remains higher on the basis of the WHO charts (Fig. 3). However, there is no difference in the prevalence of obesity among girls (Fig. 4A) and the difference in the prevalence of obesity among boys is 2.7 percentage points higher with the WHO charts (Fig. 4B).
Figure 3 Comparison of the prevalence of obesity (BMI-for-age) based on the CDC 2000 and the WHO 2006/2007 growth
charts and on the IOTF/Cole references for Oporto’s population sample of children (≤11 years) and adolescents (>11 years), respectively.
Figure 4 Comparison of the prevalence of obesity (BMI-for-age) based on the CDC 2000 and the WHO 2006/2007 growth
charts and on the IOTF/Cole references for Oporto’s population sample of girls (Panel A) and boys (Panel B) ≤11 years and >11 years, respectively.
10 The same phenomenon is observed when the WHO 2006/2007 growth charts are compared to the IOTF/Cole references. The overall prevalence of overweight and obesity is persistently higher on the basis of the WHO charts, regardless of age and gender (Fig. 1-4). There is, however, one exception. The prevalence of overweight in boys aged >11 years is higher on the basis of the IOTF/Cole references than on the basis of the WHO charts, the difference in the prevalence of overweight being 6.4 percentage points higher with the IOTF/Cole references (Fig. 2B).
PREVALENCE OF CHILDHOOD AND ADOLESCENCE OVERWEIGHT AND OBESITY FOR OPORTO’S POPULATION SAMPLE
OVERWEIGHT PREVALENCE (%) [BMI-for-age] (95% CI)
OBESITY PREVALENCE (%) [BMI-for-age] (95% CI)
Charts Overall Girls Boys Overall Girls Boys
Children (≤11 years) CDC 12,3 (9,2-15,3) 12,5 (9,5-15,5) 12,1 (9,1-15,1) 3,6 (1,9-5,3) 0,0 (0,0-0,0) 6,4 (4,1-8,6) WHO 15,4 (12,1-18,7) 15,2 (11,9-18,5) 15,6 (12,3-18,9) 6,3 (4,1-8,6) 2,7 (1,2-4,2) 9,2 (6,6-11,9) IOTF/Cole 12,6 (9,6-15,7) 11,6 (8,7-14,6) 13,5 (10,3-16,6) 1,6 (0,4-2,7) 0,0 (0,0-0,0) 2,8 (1,3-4,4) Adolescents (>11 years) CDC 12,9 (9,8-16,0) 7,7 (5,2-10,1) 17,3 (13,8-20,7) 5,5 (3,4-7,6) 2,2 (0,8-3,5) 8,2 (5,7-10,7) WHO 15,9 (12,6-19,3) 17,6 (14,1-21,1) 14,5 (11,3-17,8) 7,0 (4,6-9,3) 2,2 (0,8-3,5) 10,9 (8,0-13,8) IOTF/Cole 15,4 (12,1-18,7) 8,8 (6,2- 11,4) 20,9 (17,2-24,6) 2,5 (1,1-3,9) 1,1 (0,1-2,1) 3,6 (1,9-5,4)
Table 1 Comparison of the estimated overall and by sex prevalence of overweight and obesity in Oporto’s population sample
of children and adolescents aged 6-16 years, using the CDC 2000 and the WHO 2006/2007 growth charts, as well as the IOTF/Cole references. 95% confidence intervals are in parenthesis.
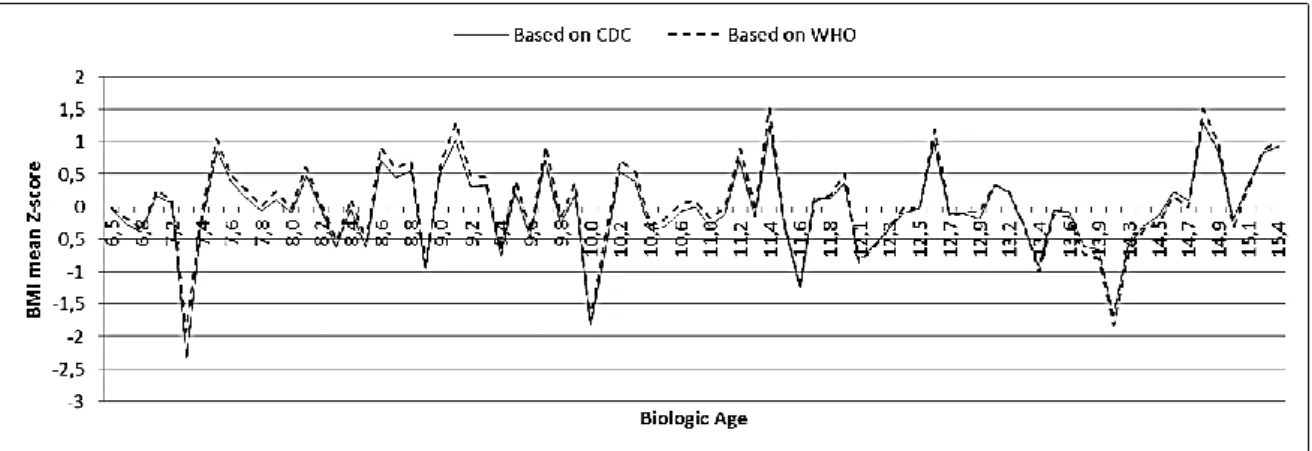
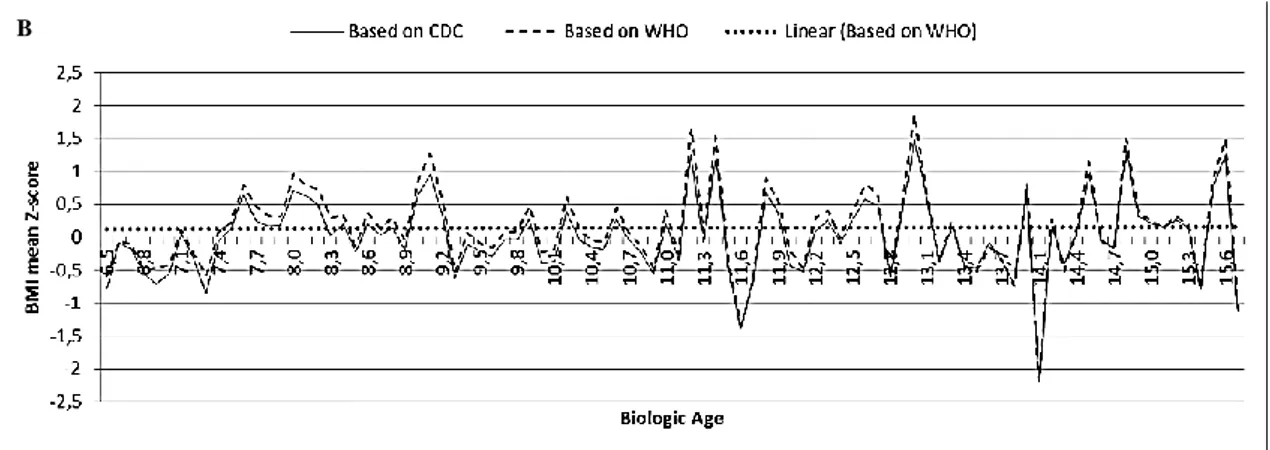
Figures 5 and 6 show the growth patterns in childhood and adolescence for the Portuguese school-aged population under study. Mean BMI-for-age Z-scores of Oporto’s population sample of children and adolescents aged 6-16 years are drawn relative to the CDC and the WHO growth references according to gender.
11
Figure 5 Mean BMI-for-age Z-score of Oporto’s population sample of girls aged 6-16 years relative to the CDC and to the
WHO growth references.
Figure 6 Mean BMI-for-age Z-score of Oporto’s population sample of boys aged 6-16 years relative to the CDC and to the
WHO growth references.
The simple linear regression model finds the best-fit line that goes near data points. More precisely, the linear regression model finds the line that minimizes the sum of the squares of the vertical distances of the data points from the line. Figure 7 shows the application of this model to Oporto’s overall population of children and adolescents aged 6-16 years and consequently the best-fit regression lines for the mean BMI-for-age Z-scores were obtained.
12
Figure 7 Linear regression of the mean BMI-for-age Z-score for Oporto's overall population sample of children and
adolescents aged 6-16 years based on the CDC (Panel A) and WHO growth references (Panel B), respectively.
Nonlinear regression, in contrast to linear regression, enables to fit curves by adjusting data points in small steps to improve the goodness of fit. The polynomial regression is special because it is not a strictly nonlinear regression and thus overcomes some of the flaws of nonlinear regression. As shown in Figures 8 and 9, the polynomial regression (third-order) was applied to the mean BMI-for-age Z-score of Oporto’s population sample of children and adolescents aged 6-16 years according to their gender and based on the CDC and WHO growth references.
Figure 8 Polynomial regression of the third-order of BMI-for-age Z-score for Oporto's population sample of girls aged 6-16
years based on the CDC (Panel A) and WHO growth references (Panel B), respectively.
B
A
13
Figure 9 Polynomial regression of the third-order of the mean BMI-for-age Z-score for Oporto's population sample of boys
aged 6-16 years based on the CDC (Panel A) and WHO growth references (Panel B), respectively.
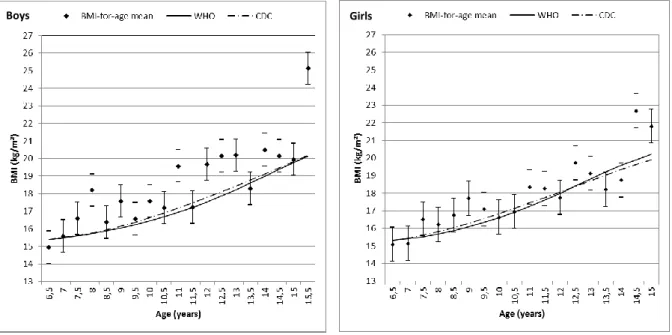
Figure 10 Mean BMI-for-age of Oporto's population sample of children and adolescents aged 6-16 years separated by gender
and traced relative to the 50th percentiles of the CDC 2000 and WHO 2006/2007 growth charts.
Girls Boys
A
14 Discussion
The comparative analysis of Oporto’s population sample of children and adolescents aged 6-16 years demonstrates that the prevalence of overweight and obesity varies considerably depending on which growth charts in combination with which cut-off values are applied. The CDC 2000 growth charts, as well as the IOTF/Cole references tend to underestimate the prevalence of childhood and adolescence overweight and obesity when compared to the WHO 2006/2007 growth standards, regardless of age and/or gender.
When considering infants and pre-school children (0-5 years old), this is not surprising. In fact, the WHO and the CDC growth charts are based on different methodological approaches for data collection and data analysis. The CDC 2000 growth charts took a descriptive approach to generate a reference that describes how children grew between the 1960s and the early 1990s in the United States. On the other hand, the WHO 2006 growth standards took a prescriptive approach with the goal of generating a standard to describe how children all over the world should grow. In the descriptive approach of the CDC, and in contrast to the prescriptive approach of the WHO, no selection of children was made to ensure that they were healthy, receiving adequate health care, or being fed appropriately (breast-fed), and thus children with unhealthy growth, predominantly overweight and obese children, were included in the CDC reference. As a matter of fact, the CDC growth charts have proven to be inadequate for assessing and monitoring the growth of breast-fed infants.21
What about school-aged children and adolescents? Are the CDC growth charts, compared to the WHO charts, equally inadequate in assessing and monitoring their growth and nutritional status?
Currently, most populations in developed as well as developing countries tend to demonstrate a secular trend towards overweight and obesity. It is widely recognized that using descriptive samples of those populations to construct growth references results inevitably in an inaccurate upward skewness leading to an underestimation of overweight and obesity and an overestimation of under-nutrition. In consequence, the WHO developed a growth reference (not a growth standard) for children and adolescents aged 5 to 19 years by reconstructing the 1977 NCHS/WHO growth reference using the original sample - a non-obese sample with expected heights, supplemented with data from the 2006 WHO Child Growth Standards to facilitate a smooth transition at 5 years. They addressed the limitations of the 1977 NCHS curves, applying updated statistical methods (the Box-Cox power exponential method) and appropriate diagnostic tools for the selection of the best models.15
The WHO standards and references demonstrate that healthy children and adolescents, regardless of their ancestries or ethnicities, who are raised in healthy environments, receive adequate health care and follow recommended feeding practices, have similar patterns of growth. This indicates that the same potential for growth in any country should be expected. It also implies that deviation from this pattern must be assumed to reflect adverse conditions, such as lack of breastfeeding, nutrient-poor or energy-excessive foods, deficient health care services and/or poverty that requires correction. So, it seems that
15 the WHO 2006/2007 growth charts are a more adequate instrument to assess and monitor growth and nutritional status among Portuguese school-aged children and adolescents, as among other child and adolescent populations all over the world.
Regardless of the charts, the cut-off values selected are arbitrary statistical cut-off values; they are not based on clinical research or health outcome risk. The 85th and 95th percentiles when applied to the CDC charts, are relative to an entire national population not selected for any health or growth characteristics; the 97th and 99th percentiles when applied to the WHO charts, are relative to a highly selected international population of children expected to be healthy. The IOTF/Cole cut-off points are based on international data and linked to the widely accepted cut-off points for adult overweight and obesity. Cole’s approach avoids some of the usual arbitrariness of choosing reference data and cut-off values and seems to be more acceptable for international use; however, some important questions remain unanswered. Are the health consequences for children above those cut-off points equal to those for adults? How accurately do they identify children and adolescents at increased risk of morbidity related to overweight and obesity?
In the late 1980s, in the attempt to determine early life risk factors for adult ill-health, emerged a new research area known as the “developmental origins of adult health and disease”. In 1992, Hales and Barker22 published an article linking fetal malnutrition and consequently low birth weight with reduced pancreatic beta cell mass and islet function. These characteristics reflect human developmental plasticity, which increase the immediate survival capacity of the neonate after poor nutritional experience in utero. These traits track on into adulthood and induce an increased risk of developing type 2 diabetes mellitus, especially if BMI increases. Other organs may equally alter in response to fetal malnutrition. These early physiological/adaptive alterations determine susceptibility to insulin resistance or other pathophysiological processes, and additional factors such as obesity, aging or physical activity play a role in deciding the time of onset and severity of diabetes as well as of other degenerative diseases. As a matter of fact, the “thrifty phenotype hypothesis” proposed by Hales and Barker states that the risk of degenerative diseases such as hypertension, stroke, cardiovascular disease and type 2 diabetes mellitus is associated with growth patterns during early life.
The “thrifty phenotype” reflects a continuum of variability and developmental plasticity relates to the entire population and not only to those considered as outliers. In fact, even within the range of normal birth weight, fetal as well as post-natal weight gain has a dose-response association with later disease risk. Two fundamental components of phenotype must be considered: the “metabolic capacity” and the “metabolic load”. Metabolic capacity refers to a variety of aspects related to organ structure and function that emerge during fetal life and infancy, when the growth process is dominated by hyperplasia (e.g. number of pancreatic beta cell mass, capacity to secrete insulin, lung airway function, nephron number or liver volume). Metabolic load refers to the burden imposed on the homeostatic metabolic capacity of the organism by the tissue masses that emerge during the hypertrophic period of growth (e.g. obesity, dietary glycaemic load and sedentary behaviours increase metabolic load).
16 Decreasing metabolic capacity and increasing metabolic load each contribute to elevated metabolic risk. Interactive effects of birth weight and weight gain during infancy, childhood and adolescence have proven to influence the risk of developing hypertension, insulin resistance, glucose intolerance/diabetes, dyslipidaemia (hypercholesterolemia and/or hypertriglyceridemia), chronic inflammation (chronic high levels of C-reactive protein) and cardiovascular disease later in adult life.23 As a matter of fact, it is largely recognized that human growth is sensitive to a wide range of environmental factors in early life. In a first instance, this wide range of factors exerts their effects mediated by maternal phenotype. The fetus relies completely on the maternal metabolism, even to experience (indirectly) the ecological environment. So, it adapts to the maternal metabolism and phenotype, and thus, alters its investment strategy according to its early experience, during a critical window of plasticity mostly restricted to pregnancy and lactation. The consequences of those alterations in investment strategy track on into adulthood and correspond to the wide range of variability in offspring metabolic capacity. Afterwards, the offspring is confronted directly to the environment and consequently is subjected to new external stimuli that may increase its metabolic load and the risk of developing a metabolic disease later in life.
Growth patterns in childhood and adolescence for the Portuguese population under study don’t differ substantially between the WHO and the CDC growth references. As seen in Figures 5 and 6, the two drafts are quite parallel and the average BMI-for-age Z-scores of Oporto’s population sample included in the WHO references are persistently above the CDC median. This difference between WHO and CDC growth charts remains quite the same throughout childhood being, however, less pronounced at older ages. In fact, there is a tendency of overlapping of the drafts as the population under study gets older. This pattern of growth is the same when girls and boys are assessed separately. Moreover, this study also shows that the CDC growth references tend to classify Oporto’s population sample of children and adolescents aged 6-16 years as having a normal, expected BMI-for-age (in Fig. 7A, the regression line based on the CDC growth references follows almost perfectly the mean BMI-for-age Z-score 0SD). On the other hand, the same population sample based on the WHO growth references appears to be heavy (in Fig. 7B, the regression line based on the WHO growth references traces parallel and persistently above the mean BMI-for-age Z-score 0SD). Therefore, it seems that the probability of missing the identification of overweight and obese children and adolescents is higher with the CDC than with the WHO references.
In fact, the WHO charts, considering the methodological approach used for their conception, represent an ideal, healthy population of children and adolescents with an ideal, healthy pattern of growth, i.e. without decreasing metabolic capacity and/or increasing metabolic load and consequently without increased risk of a metabolic disease. The WHO took particular care in selecting strict inclusion and exclusion criteria, choosing households with socioeconomic status that did not constrain the growth of the child and non-smoking, healthy mothers willing to follow international feeding recommendations. Once again, any deviation from this pattern most probably reflects inadequate growth and implies
17 adverse health conditions that need correction and in this way the WHO 2006/2007 growth charts compared to the CDC 2000 growth curves and to the IOTF/Cole references, seem to be more accurate in identifying overweight and obese children/adolescents at increased risk of morbidity and mortality later in adult life as well as during childhood and adolescence.
By taking into account the deductions referred previously, is it possible to state that the use of growth charts has predictive implications later in adult life?
A large body of scientific evidence on the health impact of childhood obesity has been collected over the last few years. Obesity in childhood is related to adverse outcomes: hypertension, dyslipidaemia, glucose intolerance/type 2 diabetes mellitus constitute a clustering of cardiovascular risk factors, known as “the metabolic syndrome”. This syndrome has been identified in children as young as 5 years old. It is now well established that childhood obesity has adverse effects on the cardiovascular system of young obese children which are similar to those well known in adults.
The persistence or relative stability of overweight/obesity and their related risk factors and health conditions over the lifespan is now generally accepted. The risk of overweight children to become overweight adults is twice as high compared with normal-weight children. For the obese youth the risk is even higher.24 33% of obese children less than 6 years old, approximately 50% of obese children between 6 and 11 years old and 80% of obese adolescents remain obese later in life.25 This concept of persistence of obesity is referred to as “tracking of childhood obesity into adulthood” and enables the acceptance of the predictability of future values by early measurements. The persistence of weight status and the importance of the child’s weight status increase with age, becoming the most important predictor after the age of 9. The persistence of childhood obesity into adulthood is intimately related to the age of the child/adolescent, to the severity of the childhood obesity and to the presence of parental obesity. This induces the idea of a genetic predisposition to obesity as well as a gene-environment interaction.26
Looking at the developmental aspects of growth and body weight increases our understanding of how a child accumulates excess weight. Adipose tissue may be found in the fetus after the 14th week of gestation. By birth adipose tissue amounts to about 13% of the new-born’s body mass, doubling to around 28% by the end of the first year for a normal-weight infant.27 This period is referred to by Stratz as the “first filling period”. It is followed by a fall in the fat proportion of body mass over the next 4-6 years. A “second filling period” frequently associated with the “adiposity rebound” occurs just before puberty. During the later adolescence or puberty happens the “final filling period”. These are 3 critical periods characterized by fat accumulation where children or adolescents, when exposed to noxious stimuli, may be more prone to develop overweight and obesity.25
Some notions, such as “filling periods” and “early adiposity rebound” are fundamental to our understanding of childhood obesity and its associated co-morbidities. The minimum value of BMI, just before the second filling period of fat accumulation, is known as the “adiposity rebound” (Rolland-Cachera). It reflects an accelerated weight gain due to body fat deposition rather than a
18 slower height acquisition. “Early adiposity rebound” is typically noted before age 5 years, “late adiposity rebound” occurs after age 7. Several studies demonstrated a strong relationship between timing of adiposity rebound and higher levels of BMI, impaired glucose tolerance/diabetes and elevated blood pressure in later childhood and adulthood.28 However, adiposity rebound isn’t a useful clinical tool to assess risk of future fatness given the time frame required for measurement (assessing adiposity rebound requires a minimum of 3 successive BMI measurements and it can only really be detected once that point has passed). In Figures 8 and 9, three phenomenons are observed. There is a first upward slope in mean BMI-for-age Z-score that initiates at age 7, regardless of gender and of growth references. A second upward slope in mean BMI-for-age Z-score initiates a few years later. This slope, however, is more precocious as well as more pronounced for girls (Fig. 8) than for boys (Fig. 9), independently of the growth references considered. Finally, the deviation from the mean BMI-for-age Z-score 0SD, regardless of gender, is more marked based on the WHO (Fig. 8B and 9B) than based on the CDC growth references (Fig. 8A and 9A). It seems that using the polynomial regression model to analyse Oporto’s population sample shows the last 2 of the 3 critical periods of fat accumulation.
Several recent studies have demonstrated that elevated BMI in childhood and adolescence has an intimate relationship with degenerative diseases later in adulthood. Baker et al.29 found that higher childhood BMI values elevated the risk of having a coronary heart disease (CHD) event in young adulthood. Each 1-unit increase in BMI Z-score, at every age from 7-13 years in boys and from 10-13 years in girls, significantly increased the risk of an event. This association proved to be stronger with increasing age during this period of childhood. Tirosh et al.30, on the other hand, found that elevated BMI in adolescence (from 17 years of age onwards) had distinctive relationships with type 2 diabetes mellitus and CHD in young adulthood. Diabetes was influenced mainly by recent BMI and weight gain, whereas for CHD both elevated BMI in adolescence and recent BMI were independent risk factors. Tirosh concluded that these distinctive associations with diabetes and CHD in young adulthood were most probably due to the fact that diabetes represents a more functional patho-mechanism than CHD, which relies more on anatomical changes (i.e. atherosclerosis).
These conclusions were deduced with BMI values well within the “normal/healthy” range established by the CDC as well as by the WHO. Currently, children and adolescents are typically classified as being at risk of degenerative diseases only if their BMI values are above cut-offs points such as the 85th percentile on growth charts. The results of recent studies do not support this approach. Baker identified a linearity of association between childhood BMI and adult risk of CHD. Even small amounts of weight gain increased the risk of a CHD event. Tirosh equally found that the distinctive relationships with type 2 diabetes mellitus and CHD in young adulthood already exist within the “normal/healthy” range of BMI values.
Childhood and adolescence BMI are independent predictors of CHS in young adulthood (even BMI values within the normal, healthy range defined by the CDC and the WHO), suggesting that body
19 mass has long-term consequences. Although, child and adolescent BMI are also predictors of the risk of developing type 2 diabetes mellitus, the risk seems to be dependent of that predicted by BMI values in adulthood.
These conclusions highlight the clinical importance of considering BMI history and consequently of monitoring BMI evolution during childhood and adolescence when assessing the risk of CHD and diabetes in young adults, mostly young overweight and obese adults. They also highlight the importance of the role of increasing BMI at different ages in the pathogenesis of different diseases. As a matter of fact, early pubertal and early adiposity rebound in childhood must probably are implicated in the development of obesity and its related comorbidities. Finally, these conclusions highlight the urgent need to accurately define what really constitutes a “normal” or “healthy” BMI value in childhood and adolescence.
Conclusion
Despite the limitations of the current study, it seems quite clear that the WHO growth standards and references represent a more adequate and accurate tool to assess and monitor childhood and adolescence health and nutritional status compared to the CDC growth curves. The WHO charts are more effective in correctly diagnosing individuals at increased risk of degenerative diseases such as coronary heart disease or type 2 diabetes mellitus later in life. The early identification of those individuals enables health care providers to initiate early interventions to prevent overweight and obesity as well as future health complications related to overweight/obesity.
Despite the fact that the IOTF/Cole references, compared to other cut-off values, seem more appropriate to define overweight and obesity in childhood and adolescence and more acceptable for international comparisons, they are not conceived for health and growth monitoring of individual children and adolescents. Therefore, new definitions are needed to address accurate physical evaluations of children and adolescents. Moreover, increasing scientific evidence suggests that the range of normal, healthy BMI values isn’t the same regardless of the population studied as well as the health consequences of overweight and obesity aren’t the same regardless of ethnicity. So, more clinical-based research is needed to establish which childhood and adolescence definitions of overweight and obesity actually relate to adverse health outcomes later in adulthood.
20 References
(1) de Onis M, Monteiro C, Akré J, Glugston G. The worldwide magnitude of protein-energy malnutrition: an overview from the World Health Organization global database on child growth. Bull World Health Organ 1993; 71 (6): 703-712
(2) Grummer-Strawn LM, Garza C, Johnson CL. Childhood growth charts. Pediatrics 2002; 109: 141-142 (3) World Health Organization. Physical status: the use and interpretation of anthropometry. WHO
technical report series. WHO: Geneva, 1995
(4) Mei Z, Grummer-Strawn LM. Standard deviation of anthropometric Z-scores as a data quality assessment tool using the 2006 WHO growth standards: a cross country analysis. Bull World Health Organ 2007; 85 (6): 441-448
(5) Coll-Black S, Bhushan A, Fritsch K. Integrating poverty and gender into health programmes: a sourcebook for health professionals. Nurs Health Sci 2007; 9 (4): 246-253
(6) Wang Y, Lobstein T. Worldwide trends in childhood overweight and obesity. Int J Pediatr Obes 2006; 1 (1): 11-25
(7) WHO European Childhood Obesity Surveillance Initiative – Portugal. Estudo COSI. Resumo. COSI: Portugal, 2008/2009
(8) World Health Organization. Obesity and overweight. WHO: Geneva, 2006
(9) Lobstein T, Baur L, Uauy R. Obesity in children and young people: a crisis in public health. Obes Rev 2004; 5 (suppl. 1): 4-85
(10) Cole TJ, Faith MS, Pietrobelli A, Heo M. What is the best measure of adiposity change in growing children: BMI, BMI%, BMI z-score or BMI centile? Eur J Clin Nutr 2005; 59 (3): 419-425
(11) Reilly JJ, Dorosty AR, Emmett PM., the ALSPAC study team. Identification of the obese child: adequacy of the body mass index for clinical practice and epidemiology. Int J Obes Relat Metab Disord 2000; 24 (12): 1623-1627
(12) Neovius M, Linné Y, Barkeling B, Rossner S. Discrepancies between classification systems of childhood obesity. Obes Rev 2004; 5: 105-114
(13) Ogden CL, Kuczmarski RJ, Flegal KM, Mei Z, Guo S, Wei R, Grummer-Strawn LM, Curtin LR, Roche AF, Johnson CL. Centers for Disease Control and Prevention 2000 growth charts for the United States: improvements to the 1977 National Center for Health Statistics version. Pediatrics 2002; 109: 45-60 (14) Centers for Disease Control and Prevention. Department of Health and Human Services. Use of World
Health Organization and CDC growth charts for children aged 0-59 months in the United States. MMWR September 10, 2010; vol. 59: no. RR-9
(15) de Onis M, Onyango AW, Borghi E, Siyam A, Nishida C, Siekmann J. Development of a WHO growth reference for school-aged children and adolescents. Bull World Health Organ 2007 Sep; 85 (9): 660-667 (16) Flegal KM, Tabak CJ, Ogden CL. Overweight in children: definitions and interpretation. Health Educ
Res 2006 Dec; 21 (6): 755-760
(17) Wang Y, Wang JQ. A comparison of international references for the assessment of child and adolescent overweight and obesity in different populations. Eur J Clin Nutr 2002; 56: 973-982
(18) World Health Organization. Child growth standards: training course on child growth assessment. WHO: Geneva, 2006
21
(19) Cole TJ, Bellizzi MC, Flegal KM, Dietz WH. Establishing a standard definition for child overweight and obesity worldwide: international survey. BMJ 2000; 320 (7244): 1240-1243
(20) Monasta L, Lobstein T, Cole TJ, Vignerová J, Cattaneo A. Defining overweight and obesity in pre-school children: IOTF reference or WHO standard? Obes Rev 2010 May 11. doi: 10.1111/j. 1467-789X.2010.00748.x
(21) de Onis M, Garza C, Onuango AW, Borghi E. Comparison of the WHO Child Growth Standards and the CDC 2000 Growth Charts. J Nutr 2007 Jan; 137 (1): 144-148
(22) Hales CN, Barker DJP. Type 2 (non-insulin-dependent) diabetes mellitus: the thrifty phenotype hypothesis. Diabetologia 1992 Jul; 35 (7): 595-601
(23) Wells JCK. The thrifty phenotype: an adaptation in growth or metabolism? Am J Hum Biol 2011 Jan-Feb; 23 (1): 65-75
(24) Singh A. S., Mulder C., Twisk J. W. R., van Mechelen W., Chinapaw M. J. M. Tracking of childhood overweight into adulthood: a systematic review of the literature. Obes Rev 2008; 9: 474-488
(25) Rêgo C. Obesidade em idade pediátrica: marcadores clínicos e bioquímicos associados a comorbilidade. Dissertação de Candidatura ao grau de Doutor apresentada à Faculdade de Medicina da Universidade do Porto. Porto, 2008
(26) Whitaker R. C., Wright J. A., Pepe M. S., Seidel K. D., Dietz W. H. Predicting obesity in young adulthood from childhood and parental obesity. N Engl J Med 1997; 337 (13): 869-873
(27) Lobstein T., Baur L., Uauy R. Obesity in children and young people: a crisis in public health. Obes Rev 2004; 5 (suppl. 1): 4-85
(28) Taylor R. W., Grant A. M., Goulding A., Williams S. M. Early adiposity rebound: review of papers linking this to subsequent obesity in children and adults. Curr Opin Clin Nutr Metab Care 2005; 8 (6): 607-612
(29) Baker JL, Olsen LW, Sorensen TIA. Childhood body-mass index and the risk of coronary heart disease in adulthood. N Engl J Med 2007 Dec 6; 357 (23): 2329-2337
(30) Tirosh A, Shai I, Afek A, Dubnov-RRaz G, Ayalon N, Gordon B, Derazne E, Tzur D, Shamis A, Vinker S, Rudich A. Adolescent BMI trajectory and risk of diabetes versus coronary disease. N Engl J Med 2011 Apr 7; 364 (14): 1315-1325
Obesity Reviews
An Official Journal of the International Association for the Study of Obesity Edited by: David York Print ISSN: 1467-7881 Online ISSN: 1467-789X Frequency: Monthly Current Volume: 12 / 2011
ISI Journal Citation Reports® Ranking: 2009: Endocrinology & Metabolism: 18 / 105 Impact Factor: 5.086
TopAuthor Guidelines
Obesity Reviews publishes state of the art reviews, written by experts in the field of obesity research. The
journal is published monthly; each issue is devoted to a highly important and timely topic in this area. Every issue will contain 5-8 authoritative, well referenced and illustrated reviews on all aspects of the specific theme of the issue.
All contributions should meet the following criteria:
All reviews must be submitted exclusively to the Journal and are accepted on the understanding that they have not been and will not be published elsewhere. All authors must give consent to publication in a cover letter and disclose potential conflicts of interest by filling in the new disclosure form that has been adopted by all journals that are members of the International Committee of Medical Journal Editors (ICMJE). The form can be
downloaded from the Journal's website or here, and no paper can be published before the information has been received from all authors of a submitted paper. Please see http://www.icmje.org
The corresponding author should provide a fax number and e-mail address to speed communication with the Editors.
The Editors retain the usual right to modify the style and length of a contribution (major changes being agreed with the corresponding author) and to decide the time of publication.
Manuscripts
All reviews (in English) should be submitted online at http://mc.manuscriptcentral.com/obr.
Authors will need their entire manuscript in electronic format. Full instructions, a user ID and password are available at the site.
Technical support for submission can be obtained by e-mailing: [email protected] or by telephoning +1 434 817 2040 ext 167.
Authors with Journal policy or style questions regarding submission should contact the Editorial Office at:
Obesity Reviews Editorial Office
(IASO)
Charles Darwin House, 12 Roger Street, London WC1N 2JU, UK Tel: + 44 (0) 20 7685 2580 Fax: + 44 (0) 20 7685 2581 Email: [email protected]
Reviews must be written in English and are subjected to editorial and peer review. Published articles are 8-10 pages in extent. (For guidance purposes, 10 typeset pages equates to approximately 8,300 words; text should be reduced if figures/tables are included to stay within the 10 page limit). Thus, during the revision process, authors may need to reduce the length of their articles. Alternatively, authors unable to do this will pay a page charge of £80.00 for each additional printed page beyond 10 pages (including tables and figures). Authors should note that this page charge per additional printed page also applies when a review is fast tracked and the page charge forms a separate, additional charge from the fast track fee.
Full details and guidance on the preparation of all material (text, tables and figures) can be found here. Possible comments and suggestions of the editor may be sent to the author(s), who authorise(s) the publication of the article in the revised form. Proof reading will be reduced to a minimum.
General advice about the presentation of manuscripts:
All pages should be numbered.
The name and address and telephone and fax numbers of the author to whom correspondence and proofs should be sent should be included on the title page and the covering letter.
Do not use abbreviations.
All scientific units should be expressed in SI units.
A copy of the manuscript should be kept by the authors for reference. An acknowledgement of receipt of the manuscript will be sent by the Journal. Manuscripts rejected for publication will not be returned.
Once a paper is accepted the authors are asked to sign a form licensing copyright to International Association for the Study of Obesity. Authors will be required to license copyright in their paper to the International Association for the Study of Obesity. Copyright licensing is a condition of publication and papers will not be passed to the Publisher unless copyright has been licensed. Therefore, an Exclusive License Form must be supplied to the editorial office before an article can published and will be requested upon acceptance of the article if it has not previously been supplied. The form can be uploaded as part of the submission process. Alternatively, please scan and email the form to [email protected], or send by post to Obesity Reviews Editorial Office.
Title Page
The title page should contain: (1) the title of the article, (2) the name of each author (first name and surname preferred), (3) the name of the department(s) and institution(s) to which the authors belong, (4) three to four key words, (5) a running title, (6) acknowledgements, (7) address of corresponding author and e-mail address, (8) potential conflicts of interest.
Text
Review articles should be divided into: (1) abstract (about 200 words), (2) introduction, (3) text subdivided in paragraphs, (4) conclusion or discussion. Authors are particularly encouraged to use tables, diagrams and figures. Personal conclusions and practical applications are welcome.
Tables
Type each table on a separate page; number tables consecutively and supply a brief title for each. Each table should have a caption. Cite each table in the text in consecutive order, using Arabic numbers.
Figures
Please submit vector graphics (e.g. line artwork) in Encapsulated Postscript Format (EPS), and bitmap files (e.g. half-tones) in Tagged Image File Format (TIFF). Detailed guidance on preparing digital illustrations is available via Wiley-Blackwell Author Services at http://authorservices.wiley.com/bauthor/illustration.asp. Letters, numbers and symbols should be clear and even throughout, and of sufficient size so that when reduced for publication the item will still be legible; titles and detailed explanations should be included in the legends for illustrations, not in the illustrations themselves. Cite each figure in the text in consecutive order.
If you wish to use a figure that has been previously published, you must acknowledge the original source and submit written permission from the copyright holder to reproduce the material. Please use our official form for requesting such permission, which can be found here. Legends for illustrations should be typed on a separate page of the main manuscript, with Arabic numbers corresponding to the illustrations. When symbols, arrows, numbers or letters are used to identify parts of the illustrations, explain each one in the legend. Explain the internal scale and identify the method of staining in photomicrographs.
References
References should be cited numerically in the order they appear in the text. Identify references in text, tables and legends by Arabic numerals in parentheses or as superscripts; authors of unpublished work which has not yet been accepted for publication must be included in the text only (e.g. J-P Després & MJ Stock - unpublished data). Please give names of all authors and editors. References should be listed and journal titles abbreviated according to the style used by Index Medicus; examples are given below.
We recommend the use of a tool such as EndNote or Reference Manager for reference management and formatting.
EndNote styles can be found here: http://www.endnote.com/support/enstyles.asp
Reference Manager styles can be found here: http://www.refman.com/support/rmstyles.asp
Abbreviations should be explained at the beginning of the manuscript and listed in the order in which they appear. Avoid abbreviations in the title and in the abstract.
Drug Names
Generic names should, in general, be used. If an author so desires, brand names may be inserted in parentheses.
Specific Instructions for Short Reviews and Case Reports The general advice about the presentation of manuscripts, as given in
Reviews' Instructions to Authors, with respect to submission procedures, licensing and colour artwork concerns,
article format, typographical conventions, journal style, citation and referencing, and so on, is applicable to short reviews and case reports; and, as with other article types, assignment of copyright is a condition of publication.
Short reviews on "National or Regional prevalence of obesity" Short review articles should also meet the following specific criteria:
Manuscript - should not exceed 1500 words and should be typed double-spaced. Title - The standard title format is:
'Prevalence of obesity in name of the country or region of the world' or
'Prevalence of obesity and metabolic syndrome in name of the country or region of the world'.
Abstract - should provide prevalence data in the different age and gender groups, and time trends, i.e. report on changes over time.
Tables - Up to two can be included. Figures - Up to two can be included.
References - Up to 10 can be cited numerically in the order they appear in the text.
NB: Specify whether height and weight data are self-reported or measured. It is preferable to demonstrate time trends in the prevalence of obesity so that it clearly shows how seriously the situation is developing.
Case reports
A case report should also meet the following specific criteria: Manuscript - should not exceed 700 words.
Tables and Figures - Up to two in total (figures and/or tables) can be included. References - Up to 10 can be cited numerically in the order they appear in the text