Universidade do Algarve
Departamento de Ciências Biomédicas e Medicina
Synthesis of polymer nanoparticles
sensitive to pH for DNA delivery in intracellular
environment
Eduardo Manuel da Fonseca Lopes
Mestrado em Ciências Biomédicas
Universidade do Algarve
Departamento de Ciências Biomédicas e Medicina
Synthesis of polymer nanoparticles
sensitive to pH for DNA delivery in intracellular
environment
Dissertation supervised by: Prof. Dra. Ana Costa Dissertion co-supervised by: Prof. Dra. Gabriela Silva
Eduardo Manuel da Fonseca Lopes
Mestrado em Ciências Biomédicas
Index
Acknowledgements ...i Abbreviations ... ii Abstract ... iv Resumo ... v I – Introduction ... 1II – Materials and methods ... 13
2.1 – Synthesis of PDMAEMA ... 13
2.2 – 1H NMR spectroscopy ... 13
2.3 – Gel permeation chromatography ... 14
2.4 – FTIR spectroscopy ... 14
2.5 – Potentiometric titration ... 14
2.6 – Cell culture ... 15
2.7 – Cell viability assay ... 15
2.8 – Dynamic light scattering and zeta potential measurements of PDMAEMA/pDNA polyplexes ... 16
2.8.1 – Polyplex preparation ... 16
2.8.2 – DLS and zeta potential measurements ... 17
2.9 – DNA gel shift assay ... 17
2.10 – DNase I protection assay... 18
2.11 – DNA release assay from PDMAEMA/pDNA polyplexes ... 19
2.12 – In vitro transfection assay ... 19
III – Results ... 21
3.1 – 1H NMR spectroscopy ... 21
3.2 – Gel permeation chromatography ... 22
3.3 – FTIR spectroscopy ... 23
3.4 – Potentiometric titration ... 24
3.5 – Cell viability assay ... 25
3.6 – Determination of PDMAEMA/pDNA polyplexes size and zeta potential ... 29
3.7 – DNA gel shift assay ... 30
3.9 – DNA release assay from PDMAEMA/pDNA polyplexes ... 32
3.10 – In vitro transfection assay ... 33
IV – Discussion... 40
V – Conclusion and future perspectives ... 44
i
Acknowledgements
I would like to thank the following people:
My supervisors Prof. Ana Costa, PhD and Prof. Gabriela Silva, PhD which granted me an opportunity to be working in this project. Without their endless support it would be impossible to travel the long road that was this work.
My co-workers Vanessa, Andreia, Susana, Sofia, Solé and Jorge for their fellowship and invaluable support in the laboratory.
My fiends, for being a ray of light when all hope seemed to be lost.
ii
Abbreviations
AIBN – 2,2'-azobisisobutyronitrile; CTA – chain transfer agent;
DMAEMA – 2-(N,N’-dimethylamino)ethyl methacrilate; DMEM – Dulbecco’s Modified Eagle Medium;
EDTA – ethylenediamine tetraacetic acid; FACS – fluorescence activated cell sorting; FBS – fetal bovine serum;
GFP – green fluorescent protein;
GPC – gel permeation chromatography; HEK293 – Human Embryonic Kidney 293;
Mn – number-average molecular weight;
MTT – 3-[4,5-dimethylthiazol-2-yl]2,5-diphenyltetrazolium bromide;
Mw – weight-average molecular weight; N/P – nitrogen/phosphorus;
NVP – N-vinyl-pyrrolidone; OD – optical density;
PAMAM – polyamidoamine; PBS – phosphate buffer saline; PDI – polydispersity index; pDNA – plasmid DNA;
iii
PEG – polyethylene glycol; PEI – polyethylenimine;
PDMAEMA – poly(2-(N,N’-dimethylamino)ethyl methacrilate); PLL – poly(L-lysine);
RAFT – reversible addition−fragmentation chain transfer polymerization; RPE – retinal pigment epithelium;
siRNA – small interfering RNA; TBE – Tris/Borate/EDTA; THF – tetrahydrofuran;
iv
Abstract
Gene therapy is a potentially great therapeutic approach for a wide range of diseases. Consequently, it is critical to develop adequate delivery vectors. In this study, we evaluated if poly(2-(N,N’-dimethylamino)ethyl methacrilate) (PDMAEMA), which proved to be an efficient delivery vector for OVCAR-3 cells, is also suitable to transport nucleic acids to the retina. In this regard, reversible addition-fragmentation chain transfer polymerization (RAFT) was used to synthesize PDMAEMA with a weight-average molecular weight (Mw) of 200 kDa. H1 NMR and Fourier transform infrared
(FTIR) spectroscopy confirmed the chemical structure of the polymer and potentiometric titration showed that PDMAEMA has a pKa value around 7. However,
gel permeation chromatography (GPC) analysis revealed that the polymer obtained had a Mw of 354 kDa. The cytotoxicity of PDMAEMA was evaluated in retinal pigment
epithelium (RPE) cell lines ARPE-19 and D407, as well as in Human Embryonic Kidney 293 (HEK293) cells and was found to be proportional to polymer concentration. However, for the concentration to be used in vivo, the cytotoxicity was negligible. Polyplexes of polymer/DNA with nitrogen/phosphorus (N/P) ratios of 5 and 10 were able to encapsulate and protect DNA from DNase action. Dynamic light scattering (DLS) and zeta potential measurements revealed nanosized particles with sizes around 213 nm with acceptable polydispersity indexes (PDI) and positive surface charges with magnitudes around 18mV. Fluorescence microscopy showed all three cell lines were efficiently transfected with these polyplexes, although to a lesser extent in RPE cells. However, preliminary evaluation of transfection efficiency by flow citometry, did not seem to reflect the effectiveness of the polymer in terms of cell transfection
Altogether these results suggest that PDMAEMA is a good candidate as a non-viral delivery vector for gene therapy of the retina.
v
Resumo
Nos últimos anos, a terapia génica tem sido estudada como uma potencial abordagem para o tratamento de doenças de base genética. Este tipo de abordagem envolve o uso de plasmídeos, oligonucleótidos, ribozimas, entre outros, como um meio de modular a expressão genética e, consequentemente, gerar um efeito terapêutico.
A célula apresenta várias barreiras à inserção de material genético no seu interior tais como a membrana celular, o sistema endossomal e a membrana nuclear. Posto isto, é crítico desenvolver métodos de entrega de DNA eficientes para que a terapia génica possa atingir todo o seu potencial.
Em terapia génica, inicialmente foram utilizados métodos mecânicos e eléctricos para inserção do DNA no interior das células, recorrendo-se a estratégias como microinjecção, bombardeamento de partículas, pressão e eletroporação. Não obstante a enorme eficiência de transfeção destas técnicas, são contudo invasivas, laboriosas e difíceis de aplicar num cenário clínico.
Face a estes constrangimentos, desenvolveram-se outras técnicas de entrega de material genético envolvendo o uso de vectores, dividindo-se estes em duas categorias: vectores de entrega virais e vectores de entrega não virais. Um vector de entrega deve possuir características tais como ser biodegradável, pouco tóxico e imunogénico, poder constituir uma formulação farmacêutica estável e ser altamente eficiente e específico no processo de transfecção.
Milhões de anos de evolução tornaram os vírus em agentes infecciosos bastante eficientes, deste modo, vectores de entrega virais compreendem a aplicação de vírus tais como retrovírus, adenovírus, lentivírus, entre outros. A grande vantagem de recorrer a vírus como vectores de entrega de material genético é a elevada eficiência de transfecção resultante. No entanto, o uso de vectores virais pode desencadear resposta imunitária e/ou levar à potencial integração aleatória dos genes terapêuticos no genoma do hospedeiro, com consequências bastante negativas. Deste modo, o foco de atenção tem incidido na aplicação de vectores de entrega não virais numa óptica de contornar as desvantagens apresentadas.
vi
Por sua vez, os vectores de entrega não virais podem ser categorizados em sistemas de entrega lipossomais ou poliméricos.
Os vectores de entrega lipossomais utilizados em terapia génica são numerosos, podendo ser catiónicos, aniónicos, sensíveis ao pH, camuflados ou imunolipossomas. No geral, a grande vantagem em se recorrer a este tipo de vectores é a baixa imunogenicidade dos lipossomas e a facilidade com que são manipuláveis a nível de formulação, sendo possível produzir lipossomas com características bastante definidas em termos de tamanho, carga de superfície, composição e morfologia. No entanto, apresentam desvantagens como citotoxicidade e pouca estabilidade.
Os vectores de entrega poliméricos geralmente envolvem o uso de polímeros catiónicos uma vez que estes são capazes de complexar o DNA carregado negativamente por intermédio de interacções electrostáticas entre as cargas positivas presentes no polímero e os grupos fosfato na presentes na estrutura das moléculas de DNA, formando-se assim complexos denominados de poliplexos. Esta abordagem engloba o uso de polímeros como dendrímeros, PEI, PDMAEMA e quitosano. As vantagens mais importantes apresentadas por esta abordagem são a versatilidade de propriedades físico-químicas e facilidade de manipulação características dos polímeros.
Dendrímeros tais como a PAMAM, apresentam vantagens a nível do controlo da sua síntese, sendo possível produzir polímeros bastante monodispersos, o que resulta numa elevada reprodutibilidade na entrega de material genético.
Um dos polímeros mais estudados em terapia génica é o PEI. Trata-se de um polímero caracterizado pelo seu enorme potencial catiónico, traduzindo-se em elevadas eficiências de transfecção. A enorme desvantagem deste polímero é a sua elevada toxicidade, sendo que se desenvolveram estratégias de modo a amenizar esta característica.
Uma alternativa bastante viável ao PEI é o PDMAEMA. Este polímero catiónico solúvel em água também é capaz de interagir eletrostaticamente com o DNA de modo a formar poliplexos. Vários estudos demonstraram que a eficiência de transfecção
vii
deste polímero é proporcional ao seu peso molecular. Este polímero apresentou uma elevada eficiência de transfecção in vitro (cerca de 10%) quando avaliado em células OVCAR-3.
Para além dos polímeros sintéticos apresentados, os polímeros naturais como o quitosano são bastante apelativos para aplicações em terapia génica devido às suas baixas toxicidades e biodegradabilidade. Por outro lado, normalmente apresentam eficiências de transfecção mais baixas que os polímeros sintéticos.
Tendo em conta o enorme potencial que reside na aplicação de polímeros para entrega de DNA no interior das células, a síntese de polímeros é por isso de uma fulcral importância. Um dos processos mais usados na síntese de polímeros é a polimerização radicalar, sendo que a polimerização via RAFT sobressai de entre as demais técnicas devido à sua versatilidade em termos de condições de reacção e controlo sobre os pesos moleculares dos polímeros sintetizados. Outra característica digna de relevo é a baixa polidispersidade de pesos moleculares de polímeros formados por intermédio de polimerização via RAFT.
O objectivo deste trabalho foi avaliar se o PDMAEMA é um bom candidato para ser usado em terapia génica na retina. Para tal, PDMAEMA foi sintetizado por RAFT, com uma previsão inicial de peso molecular de 200 kDa. Posteriormente, o polímero resultante foi avaliado em termos de propriedades físico-químicas e biológicas.
A estrutura do polímero foi confirmada por intermédio de espectroscopias de H1 NMR e FTIR, pelo que a síntese, a nível químico, foi um sucesso. De modo a se avaliar a massa molecular do polímero, procedeu-se a uma GPC. Por intermédio desta técnica, verificou-se que o polímero sintetizado apresentava uma massa molecular média de 354 kDa, valor este superior ao esperado. Subsequente caracterização do polímero envolveu a execução de uma titulação potenciométrica, sendo que se verificou que o PDMAEMA tem um pKa de cerca de 7, muito próximo do pH fisiológico.
O valor obtido revela que este polímero é potencialmente capaz de manter material genético encapsulado a valores de pH inferiores a 7 (como por exemplo no interior de um endossoma cujo pH ronda os 5) e, por outro lado, libertar o mesmo a um pH igual ou superior ao fisiológico.
viii
O PDMAEMA foi avaliado em termos de toxicidade por intermédio de um ensaio de contacto directo entre células e polímero. A toxicidade do material foi então avaliada nas linhas celulares HEK293, ARPE-19 e D407, sendo que as duas últimas são derivadas de células RPE, constituindo um modelo in vitro de células da retina. As viabilidades celulares foram avaliadas por intermédio do ensaio de MTT. Os resultados deste ensaio revelaram que a toxicidade do polímero é não só proporcional à sua concentração mas também ao tempo de duração do ensaio de incubação. Verificou-se também que a toxicidade do PDMAEMA é substancialmente mais acentuada nas linhas celulares RPE relativamente à HEK293. Não obstante este resultado, a concentração do material a usar num ensaio in vivo torna estes valores negligenciáveis.
Por intermédio de electroforese em gel de agarose, verificou-se que poliplexos de PDMAEMA/pDNA nas razões N/P de 5, 10 e 20 encapsularam e protegeram o DNA de degradação por parte de DNases. Um ensaio de libertação efectuado em poliplexos na razão N/P de 10 revelou que estes começam a libertar o material genético após 72 h, a pH fisiológico.
Poliplexos de PDMAEMA/pDNA a várias razões N/P (5, 10, 20), foram caracterizados em termos de tamanho e magnitude de carga de superfície por intermédio de medições de DLS e potencial zeta, respectivamente. Estas medições revelaram poliplexos com tamanho médio de 213 nm e índices de polidispersidade aceitáveis. O tamanho das partículas verificou-se ser inversamente proporcional à razão N/P. No que respeita aos potenciais zeta, a magnitude de carga média na superfície dos poliplexos foi de 18 mV. Os potenciais zeta obtidos foram não só positivos em todos os casos mas também directamente proporcionais à razão N/P, o que nos indica que poliplexos de PDMAEMA/pDNA interagem electrostaticamente com as cargas negativas à superfície das membranas biológicas, potencialmente facilitando a sua internalização.
A eficiência de transfecção de poliplexos nas razões N/P de 5, 10 e 20 foram avaliadas pela expressão do gene repórter GFP nas três linhas celulares previamente estudadas para avaliação de toxicidade. A avaliação do número de células GFP-positivas foi efectuada por intermédio de microscopia de fluorescência. Verificou-se
ix
que todas as linhas celulares foram eficientemente transfectadas pelos poliplexos, pese embora a eficiência de transfecção ter sido inferior nas linhas celulares RPE. Ensaios preliminares para a avaliação da eficiência de transfecção em células ARPE-19, por intermédio de citometria de fluxo, aparentemente não indicaram a real eficiência de transfecção deste polímero.
Tomando em linha de conta os resultados como um todo, é seguro afirmar que o PDMAEMA é um candidato viável para terapia génica na retina.
1
I – Introduction
In the past several years, gene therapy has gained remarkable attention due to its potential as therapeutics for a vast array of genetic disorders like severe combined immunodeficiency, cystic fibrosis, Parkinson’s disease and as an alternative to chemotherapy employed in cancer treatment [1, 2]. DNA-based therapeutics comprise the use of plasmids, oligonucleotides, ribozymes, DNAzymes and small interfering RNAs (siRNA) as means to modulate gene expression and thus generate a therapeutic effect [2]. Despite the enormous potential for DNA-based therapeutics, several barriers hinder genetic material delivery to its site of action resulting in a poor therapeutic effect [3].
Primarily, gene therapy focused on mechanical and electrical approaches to insert the DNA into the cells, resorting to strategies like microinjection [4], particle bombardment, pressure-based [5] and electroporation [6]. Microinjection is an extremely efficient technique because one cell at a time is submitted to DNA transfer but becomes impractical because of the time this technique takes to perform. Particle bombardment equipment such as the gene gun can be employed in the ballistic transfer of DNA-gold nanoparticles; however, this approach requires direct exposure of the target tissue, which restricts its use to the dermis, muscle or mucosal tissues unless a surgical intervention can expose another normally deep tissue. Electroporation is a technique based on high-voltage electric current to ease DNA transfer, resulting in high cell mortality rendering it useless for clinical use. The use of the aforementioned techniques results in significant transfection efficiencies but they are very difficult to standardize in a clinical scenario and are regarded as laborious, time consuming, impractical and invasive [5].
In gene therapy, it is critical to overcome the barriers presented by the cell, in order for its therapeutic potential to be achieved so vector assisted delivery of the genetic material is fundamental [1, 2]. Delivery of genetic material can generally be described as depicted in figure 1, and four events dictate its effectiveness: genetic material complexation by the delivery vector, cellular internalization, endosomal escape and nuclear translocation of the genetic material.
2 Figure 1 – Schematics of the delivery of a DNA-based therapeutic by a viral or nonviral DNA delivery
vector. (1) – complexation of genetic material by the delivery vector. (2) – DNA-based therapeutic-delivery vector complex interacts with cell membrane. (3) – internalization of the complex via receptor or nonreceptor endocytotic pathways. (4) – endosomal escape. (5) – release in the cell cytoplasm of the complex or nude genetic material. (6) – dissociation of the genetic material from the vector. (7) – nuclear translocation of the genetic material (Scheme adapted from [2]).
The first thing to consider in vector-assisted delivery is the complexation of the DNA with the vector [figure 1, (1)] to a size that enables internalization by the cells. When using polymer-based vectors, the charge density and ionicity of the polymer become of major relevance. The optimal size of a polymer/DNA complex (polyplex) is subject to debate although smaller sizes (bellow 150 nm) are favored. Moreover, minimizing aggregation of the polyplexes is an important concern to the whole DNA delivery because aggregates can impair internalization of the complexes in the cell [7].
In gene delivery, the first obstacle presented by the cell is the plasma membrane [figure 1, (2) and (3)]. It is well-established that native plasma membranes are characterized by an asymmetric distribution of charged (anionic) lipids across the membrane, resulting in an overall negative charge across membrane surface [8] which prevents by electrostatic repulsion the entry of naked DNA into the cell. Two routes are possible in the transfection of nonviral DNA complexes: nontargeting cationic complexes associate with the cell membrane through electrostatic interaction with
3
proteoglycans present in the plasma membrane surface [9]; vector systems with attached receptor ligands (ex.: folate, mannose or transferrin) that bind to the receptor on the cell surface, promoting the internalization of the DNA-vector complex by clathrin-dependent endocytosis [10].
After cell internalization, most polyplexes are sequestered in the endosomal compartment [figure 1, (4)] which eventually fuses with lysosomes. These endosomal compartments have a lower pH (around 5.0) than the cytosol or intracellular space (around 7.4) and potent enzymes that may either degrade or swell the cationic polymer resulting in the release and degradation of DNA [11, 12]. Therefore, polyplex or DNA escape to the cytoplasm [figure 1, (5) and (6)] is critical to the whole gene delivery process and an efficient destabilization of the endosomes by endosomolytic compounds (ex.: chloroquine, lipids and peptides) [13-15] as well as polymers that possess this endosomal disruptive property [16, 17] would yield better gene delivery efficiency. Alternatively, it has been hypothesized that polymers with excessive amine groups lower the pH of the endosomes leading to endosomal swelling and collapse [18]. This phenomenon known as the “proton sponge” effect was first postulated to explain the disruptive properties of polyethylenimine (PEI) towards endosomes. According to this hypothesis, polyplexes trapped into the endosomes absorb the protons that are pumped into the organelle and the protonation of the amines present in the polymer structure leads to its swelling. This build-up of a positive charge gradient is neutralized by an influx of Cl- ions resulting in an increase in osmotic pressure that destabilizes and ruptures the endosomes, leading to the release of the endosomal content in the cytoplasm [18, 19].
After reaching the cytoplasm, vector/DNA complexes can diffuse to the nuclear membrane [figure 1, (7)]. Molecular motors can transport the complexes to the nuclear membrane, although it remains unknown which properties should the delivery vector have to enhance this process. Furthermore, polyplex dissociation in the cytoplasm leads to DNA degradation which is problematic because translocation of unpacked DNA to the nucleus is probably through diffusion which is a slower process than its cytoplasmic degradation, resulting in an overall inefficient nuclear transport [20]. The pathway of the transport of vector/DNA complexes to the nucleus remains
4
unclear and only a few synthetic polymers, such as PEI, protect DNA against degradation in the cytoplasm [7].
Dividing cells present higher transfectability than non-mitotic cells, suggesting that the nuclear envelope disassembly during mitosis may ease the passage of exogenous DNA to the nucleus [21]. Also, in transfection studies of DNA complexed by a cationic vector these complexes yielded higher gene expression in comparison to free pDNA (plasmid DNA), indicating that vectors that are positively charged may exert a nuclear-localizating effect [22]. Nevertheless, intact polyplexes can be detected in the nucleus of even non-dividing cells and it would be of major importance to identify which property should these polyplexes have in order to increase translocation[4].
As previously stated, delivery systems play a major role in gene therapy, enabling this approach to fulfill its therapeutic potential. In this sense, the ideal properties of a delivery vector should include high transfection efficiency with high target cell specificity, biodegradability, low toxicity and immunogenicity, and constitute a stable pharmaceutical formulation. An ideal delivery system should also be simple to formulate and permit modifications for customized DNA delivery, release and expression.
Nowadays, there are two main DNA delivery systems, classified based on their origin: viral and nonviral delivery systems [2].
Millions of years of evolution made viruses powerful infective agents, capable of transferring genetic material into host cells with extreme ease. This property is very appealing to gene therapy applications. In general, a viral approach is characterized by inserting a transgene of therapeutic interest in the viral genome and use the virus innate mechanism of infection to introduce the expression cassette inside cells, allowing the gene to enter the nucleus and eventually by leading to its expression [23]. Several viruses can be used as delivery systems such as retrovirus [24], parvoviruses, adenoviruses, lentiviruses [25], adeno-associated viruses [26] and the herpex simplex virus [27]. The main advantage of using viruses as delivery vectors is their extremely high transfection efficiency: for instance, retroviral vectors can transfect between 45 and 95% of populations of primary endothelial and smooth muscle cells, which are usually rather difficult to transfect [28]. Due to their efficiency, viral systems have had a remarkable impact in the treatment of diseases like muscular dystrophy [29], AIDS
5
[30] and cancer [31]. However, there are several concerns over these viral systems to deliver therapeutic DNA in humans. The main issue is the potential for generating strong immune responses against the viral proteinaceus capsid. There are numerous reports of this phenomenon in studies with animal models [32, 33]. Another concern is based on the potential integration of the therapeutic genes into the host genome, taking place randomly, potentially generating insertional mutagenesis that may inhibit or activate the expression of normal cellular genes or oncogenes, respectively. The viral envelope has a finite loading capacity, restricting the size of the plasmid it can incorporate. For instance, first generation adeno-associated viruses displayed a very limited capacity (around 4,7 kb) severely limiting their applicability [34]. Additionally, adenoviruses have been shown to not be stable after storage [35] and are known to generate inflammatory responses in tissues [36]. Finally, retroviral vectors are difficult to produce on a large scale [24]. The viral approach in gene therapy has been severely hampered by these limitations and scientists have been increasingly driving their attention to the nonviral systems.
The nonviral delivery systems can circumvent some of the issues regarding viral vector namely in terms of immune response (low or inexistent in most cases), ease of formulation and assembly. Based on the nature of the material used, nonviral vectors can be grouped in two categories: liposomal and polymeric delivery systems [37].
Liposomes are a very attractive tool in gene therapy and can be used to deliver DNA-based therapeutics by entrapping them inside the aqueous core or complexing them to the phospholipid lamellae. Liposomal delivery systems are often nonimunogenic and since their composition can be manipulated, liposomes can be engineered in a way to display defined properties like size, surface charge, composition and morphology. Some liposomes with positive surface charge can interact electrostatically with the negatively charged DNA, complexing it in lipoplexes. These systems can also shield DNA against nucleases therefore improving its biological stability [38]. There are numerous liposomal delivery systems (figure 2) such as: cationic, anionic, pH-sensitive, immunoliposomes and stealth liposomes.
6 Figure 2 – Chemical structures of some commercially available liposome reagents used for gene delivery
(Image adapted from [1]).
Regarding cationic liposomes, the cationic lipids present in a liposomal formulation serve the purpose of complexation and condensation of DNA during formation of the lipoplex while zwitterionic lipids aid in membrane perturbation and fusion. This strategy has had an acceptable success in gene transfer [39] although cytotoxicity of cationic lipids has been reported not only in vitro [40] but also in vivo [41]. Moreover, transfection efficiencies of cationic liposomal vectors are very low in comparison to viral vectors, which are attributed to the heterogeneity and instability of these lipoplexes [42]. The potential of anionic liposomal delivery systems has been investigated as an alternative to cationic liposomes, with successful delivery of oligonucleotides to hippocampal neurons reported. On the other hand, several problems arise from the use of anionic liposomes such as inefficient entrapment of DNA resulting from electrostatic repulsion between the lipids and DNA [43] and poor data regarding toxicity of these materials [42]. Liposomal delivery systems which are pH-sensitive are potentially very useful in gene therapy due to the fact that these lipids are arranged in a bilayer structure at pH 7 but upon endosomal compartmentalization they become protonated and collapse, leading to disruption and destabilization of the endosome and rapid release of DNA into the cytoplasm [44]. Immunoliposomes are gene delivery systems that excel in cell targeting by functionalization of antibodies to
7
lipid bilayers to facilitate receptor-mediated endocytosis of lipoplexes [45]. In order to avoid immune responses, some liposomal formulation include polyethylene glycol (PEG)-conjugated lipids – stealth liposomes, resulting in a prolonged systemic circulation of these liposomes [46].
Polymeric delivery systems often compromise the use of cationic polymers because they can complex anionic DNA molecules generating polyplexes used to deliver DNA into cells [47]. The mechanism by which polyplexes are formed relies on the electrostatic interaction between the positively charged polymer and the anionic phosphate groups in the backbone of DNA molecules, therefore forming a complex [48]. This approach often includes the use of dendrimers [37], PEI [49], poly(L-lysine) (PLL) [50] and chitosan [51]. The most important advantages of polymeric delivery systems are the versatility of physicochemical properties and ease of manipulation intrinsic to the polymers; moreover, scale-up procedures are feasible with a low cost. Although polymers offer some very interesting advantages, they have issues such as low transfection efficiencies, problems in the control of molecular weight distribution and high dispersity of polyplexes [37].
Figure 3 – Chemical structure of PAMAM dendrimers (Image adapted from [4]).
Dendrimers such as polyamidoamine (PAMAM) (figure 3) possessing a 3-dimensional spherical structure, have an advantage at synthesis control level in terms of degree and generation of branching, leading to the formation of polymer particles with very low polydispersities and consequently to reproducible gene delivery and
8
clinically reliable formulation. Amino acid residues in the structure of PAMAM dendrimers can interact with DNA and promote endosomal release [37].
Figure 4 – Chemical structure of branched PEI (Image adapted from [4]).
A polymer worth of notice is PEI (figure 4), possessing a high cationic potential resulting in high transfection efficiencies but also extreme cytotoxicity owing to its capability of inducing apoptosis [52]. As aforementioned, the high transfection efficiency of PEI is attributable to its buffering capabilities or “proton sponge” effect, resulting in a rapid endosome escape [16]. The transfection efficiency and cytotoxicity of PEI is directly proportional to its molecular weight [53] so strategies have been developed to overcome this problem such as grafting copolymers like PEG to PEI [54].
Figure 5 – Chemical structure of PLL (Image adapted from [4]).
PLL (figure 5) is a biodegradable cationic polymer characterized by low transfection efficiencies owing to its weak buffering capabilities, resulting in a poor
9
endosomal escape [55]. Also, PLL/DNA polyplexes have a high degree of polydispersity [48]. Consequently, this polymer is nowadays used in gene therapy as an adjunct to graft copolymers and endosomolytic compounds to improve cellular uptake and targeting of other polymers [56].
Figure 6 – Chemical structure of PDMAEMA (Image adapted from [57]).
PDMAEMA (figure 6) is a water-soluble cationic polymer that is also capable of interacting electrostatically with DNA to generate stable polyelectrolyte complexes [58]. Previous studies demonstrated that PDMAEMA transfection efficiency is directly proportional to its molecular weight [59]. The introduction of hydrophobic monomer units by copolymerization of 2-(N,N’-dimethylamino)ethyl methacrilate (DMAEMA) with methyl methacrylate monomers (20 mol%) resulted in a polymer with low transfection efficiency and increased cytotoxicity; on the other hand, copolymerization of DMAEMA with hydrophilic N-vinyl-pyrrolidone (NVP) monomers (54 mol%) enhanced transfection efficiency and greatly reduced cytotoxicity, in comparison to PDMAEMA homopolymer, meaning that transfection efficiency and cytotoxicity should be balanced in order to achieve optimal transfection by manipulating the charge density and hydrophobicity of the cationic polymeric vector. Additionally, the tertiary amine groups of PDMAEMA are partially protonated at physiological pH since the average pKa of the amine groups is 7.5 [60], conferring buffering properties to the
polymer in the endosomal compartment. Structural analogs with a higher pKa value yielded much lower transfection efficiencies than PDMAEMA because the higher degree of protonation of the amines resulted in lower buffering capabilities and increased DNA affinity, ultimately leading to poor endosomal escape and DNA
10
dissociation from the polyplex and overall decrease in transfection efficiency [61]. The size and zeta potential of PDMAEMA/DNA polyplexes were shown not only to be dependent of the N/P ratio but also as important factors in determining transfection efficiency [62]. Highly charged (30 mV) polyplexes, around 200 nm in size, yielded the highest transfection efficiency in vitro, when evaluated in COS-7, OVCAR-3 and B16 cell lines [57]. PDMAEMA achieved a transfection efficiency around 10% in vitro and 1-2%
in vivo when intraperitoneally grown OVCAR-3 cells were transfected ex vivo [63].
Despite this discrepancy between in vitro and in vivo performance in terms of transfection efficiency and cytotoxicity issues, PDMAEMA still has enormous applicability as a gene therapy tool.
Figure 7 – Chemical structure of chitosan (Image adapted from [7]).
Besides synthetic polymers, natural polymers are also used in gene delivery and one of the most popular is undoubtedly chitosan (figure 7). This polymer is obtained by deacetylation of the chitin that composes the exoskeleton of arthropods. It is a biodegradable polysaccharide consisting of repeating D-glucosamine and N-acetil-D-glucosamine units, linked via (1-4) glycosidic bonds [64] and can be characterized by properties such as molecular weight, degree of deacetylation, viscosity and crystallinity [65]. Due to its low toxicity, chitosan is used in gene delivery as an alternative to PEI despite yielding substantially lower transfection efficiencies than the latter [66].
Previously, it was demonstrated that polymers as nonviral delivery vectors are extremely appealing to gene therapy, so polymer synthesis is fundamental in the development of new polymers to be applied in this approach. One of the most used processes for polymer synthesis is radical polymerization [67] and considerable effort has been done in the past years to develop synthesis techniques more effective than
11
the free-radical polymerization [68]. The living polymerization processes have many advantages over free-radical polymerization including the ability to control molecular weight, polydispersity and possibility of preparing block copolymers or polymers of complex structure. Taking this into account, it would be desirable to have polymerization techniques which combined the benefits of living polymerization with the versatility and convenience of free-radical polymerization. However, these techniques present some disadvantages such as being applicable only to a narrow range of monomers, require expensive reagents or high temperatures to perform. The RAFT polymerization emerges from other living free-radical polymerization techniques because it performs for a wider range of monomers and reaction conditions, yielding polymers with controlled molecular weight and narrow polydispersities [69].
Figure 8 – Proposed RAFT mechanism (Image adapted from [70]).
The RAFT mechanism involves polymerization of a substituted monomer in the presence of a chain transfer agent (CTA) and the latter [figure 8, (1)] normally has a thiocarbonylthio group (S=C-S) with substituents Z and R in its structure which severely impact the kinetics of the reaction as well as the degree of structural control. The reaction can be initiated by thermal, redox or γ-irradiation methods. The reaction
12
begins by addition of initiator-derived radicals to the monomer [figure 8, (a)], resulting in the formation of almost only CTA-derived chains (Pm•) [figure 8, (b) and (c)]
originated from the fragmentation product (R•) of the intermediate species (2). To favor this reaction path, in a RAFT polymerization the concentration of initiator is kept low comparatively to the CTA and the reactivity of the latter should be higher than that of the monomer. The reversible fragmentation of the intermediate species (2) and consumption of CTA (1) to generate the reinitiating fragment (R•) is referred as “pre-equilibrium” [figure 8, (c)]. The “main “pre-equilibrium” [figure 8, (d)] is achieved when active radical chain ends react with the monomer or reversibly to dormant chains (or macro-CTAs). The rapid establishment of the “pre-equilibrium”, efficient reinitiation by the fragmentation product (R•) and attainment of the “main equilibrium” in which the population of dormant chains and/or intermediate radicals (5) is remarkably higher than that of propagating chains (Pn• and Pm•), appears to be the cause of obtaining
narrow molecular weight distributions in a RAFT polymerization. The pseudo-first-order kinetics and the linear evolution of molecular weight over time, attest to a significant elimination of chain termination events [figure 8, (e)] [70].
The aim of this work was to evaluate if PDMAEMA would be suitable as a delivery vector for gene therapy in the retina. To this purpose, we synthesized PDMAEMA with a predicted Mw of 200 kDa and characterized its physicochemical
properties by H1 NMR and FTIR spectroscopies, GPC and potentiometric titration. The cytotoxicity of the resulting polymer was evaluated by MTT assays performed not only in HEK293 cells but also in RPE cell lines ARPE-19 and D407. PDMAEMA/pDNA polyplexes at various N/P ratios were studied in order to determine their capabilities to encapsulate and protect DNA from DNase degradation as well as to establish their release profiles in vitro. Additionally, these polyplexes were characterized in terms of size and magnitude of surface charge by DLS and zeta potential measurements, respectively. Finally, the transfection efficiency of these polyplexes was evaluated in
13
II – Materials and methods
2.1 – Synthesis of PDMAEMA
The polymer was synthesized by RAFT polymerization. Prior to the synthesis, DMAEMA was passed through a neutral alumina column to remove free radical inhibitor. DMAEMA (1 mL, 5,93x10⁻³ mol), O-ethyl phthalimidyl methyl xanthate (0,0011 g, 3,95x10⁻⁶ mol) and 2,2'-azobisisobutyronitrile (AIBN) (1 mol % monomer, 0,0097 g) were added to tetrahydrofuran (THF) (approximately 5 mL) in a Shleck flask. The reaction mixture was submitted to three freeze-pump-thaw cycles. The flask was then submerged in an oil bath preheated to 60 oC and the polymerization was allowed to proceed for 24 h under magnetic stirring. The resulting polymer was precipitated by pouring the mixture into hexane and centrifuged at 10 000 rpm for 10 min; afterwards the supernatant was discarded and the same process was repeated with the pellet two more times. The polymer was then dried under vacuum at 40 oC for 72 h. The neutral PDMAEMA product obtained was added to water and drops of 12 M HCl were added under stirring until the polymer completely dissolved, due to its conversion into the hydrochloride salt. The PDMAEMA•HCl polyelectrolyte was then precipitated in acetone, the mixture was cooled at -20 oC for 10 min and centrifuged at 10 000 rpm for 10 min. The white powder constituting the pellet was recovered and dried under vacuum at 60 oC overnight.
2.2 –
1H NMR spectroscopy
The 1H NMR analysis was performed in a Bruker ARX 400 (400 MHz). 1H NMR (D2O) 1,238-1,106 (d, CH3-C-C=O), 2,119 (s, CH2-C-C=O), 3,089 (s, (CH3)2-N-C-C-O),
14
2.3 – Gel permeation chromatography
Triple detection GPC (SEC3) analysis was performed in a modular system constituted by a degasser, HPLC pump (K-1001) and RI detector (K-2300) are from Knauer; viscometer and RALLS are from Viscotek (Trisec Dual Detector Model 270), using two PL aquagel-OH mixed 8 m 300 x 7.5 mm columns and using two PL aquagel-OH mixed columns. Eluent was 0,5 M NaNO3 in pH 2 phosphate buffer (containing
0.1% sodium azide) at 1mL/min. The sample was dissolved at 10 mg/mL in 10-2 M HCl solution.
2.4 – FTIR spectroscopy
The PDMAEMA FTIR spectrum was recorded in a KBr pellet within the range 4000-600 cm-1 in a Bruker, Tensor 27 spectrophotometer. IR (KBr): 1730 ( (C=O)) and 1148 ( (C-N)).
2.5 – Potentiometric titration
The polymer solution was prepared in 10 mL of distilled water at a fixed total titratable amine group concentration of 10 mM. A pH measurement electrode (Orion 9157BN) connected to an Orion pH meter (Thermo Orion 4 Star pH-ISE Benchtop) (calibrated using two standard pH buffers (pH 4.00 and 10.00)) was then immersed into the solution and the system was allowed to reach an equilibrium. The pH of the solution was preadjusted to approximately 2.00 by addition of 2 M HCl. Afterwards, the titrant (0.08 M NaOH) was added dropwise to the polymer solution by using a micropipette (with a drop size of 20-40 μL) under constant stirring and the stabilized pH value was recorded after each dropwise addition of the titrant.
15
2.6 – Cell culture
In this work three different cell lines were used for in vitro assays: HEK293, ARPE-19 and D407. HEK293 is a cell line originally derived from human embryonic kidney cells [71] which grow very fast and are easily transfected. Due to its properties, HEK293 cells were used as a control in transfection assays. On the other hand, ARPE-19 and D407 are human RPE cell lines that retained phagocytic capacity making them excellent in vitro models for RPE cells [72, 73]. ARPE-19 cells were originally derived from the healthy eye of a 19 year-old male and express RPE-specific markers [73]. D407 cells were originally derived from the eye of a 12 year-old male and present trisomy [72]. Despite expressing the same RPE-specific markers as ARPE-19 cells [72], D407 cells are unable to produce pigments as the former [73].
The cell cultures were incubated at 37 oC in a humid atmosphere of 5% CO2.
The HEK293 cells were cultured in Dulbecco’s Modified Eagle Medium (DMEM) with 5% fetal bovine serum (FBS), 1% L-glutamine and 1% penicillin/streptomycin; ARPE-19 cells were cultured in DMEM/Ham’s F-12 mix with 5% FBS, 1% L-glutamine and 1% penicillin/streptomycin; D407 were cultured in DMEM with 10% FBS, 1% L-glutamine and 1% penicillin/streptomycin.
2.7 – Cell viability assay
As previously stated, it is desirable for a delivery vector to display the least cytotoxicity possible. Bearing this in mind, a direct contact assay between cells and polymer was performed for the HEK293, ARPE-19 and D407 cell lines to determine cell viabilities after three time points (24, 48 and 72 h). Cell viability was determined using the 3-[4,5-dimethylthiazol-2-yl]2,5-diphenyltetrazolium bromide (MTT) assay. HEK293, ARPE-19 and D407 cells were plated at a concentration of approximately 5x10⁴ cells/well on 12-well plates 24 h prior to the experiment. Prior to each assay, the medium was renewed with 1,5 mL/well (with the exception of D407 cells in which 1
16
mL/well was used). PDMAEMA solution (1 mg/mL in 1x PBS) was added dropwise to the wells to obtain final masses of polymer as follows: 10, 15, 20 and 30 µg. A negative and a positive control of cell viability were performed where the cells were treated with medium containing a latex extract which is toxic for cells or fresh medium, respectively. All experiments were performed in duplicate. The plates were then incubated for 24, 48 or 72 h at 37 oC, 5% CO2. After each time point, 100 µL of MTT
solution (5 mg/mL) were added to each well. After 4 h of incubation at 37 oC, 5% CO2,
the medium was removed from each well and 500 µL of a 0,04 M HCl in isopropanol solution were used to dissolve the formazan product. For each well in the 12-well plate, 100 µL of the crystal solution were transferred to three different wells in a 96-well plate. Absorbances at 570 and 630 nm were measured using a TECAN Infinite M200 microplate reader.
2.8 – Dynamic light scattering and zeta potential measurements of
PDMAEMA/pDNA polyplexes
2.8.1 – Polyplex preparation
To prepare polyplexes for the DLS and zeta potential measurements, 0,5 µg of a plasmid encoding the green fluorescent protein (GFP) (pAAV.2.1.GFP) in Tris/Borate/EDTA (TBE) were added to 1 x phosphate buffer saline (PBS). Afterwards, a certain volume of a PDMAEMA solution (1 mg/mL in 1x PBS) was also added, the mixture was mildly vortexed for 10 s and allowed to incubate at room temperature for 30 min for the DNA/PDMAEMA complex to be established.
The appropriate volumes of the polymer solution to be added were in agreement to the various N/P ratios tested (5, 10 and 20) and were calculated according to equation 1.
17 Equation 1 –
Where N/P stands for the ratio of nitrogen atoms present in the polymer to phosphorus atoms in the DNA molecule, mp and mD are the mass of polymer and DNA
respectively, Mo,p and Mo,D are the repeat unit molecular weight of polymer and
average repeat unit molecular weight of DNA respectively. The equation assumes that there is only one ionizable amine group present in the polymer’s monomer unit.
The amount of PBS used in each ratio is that sufficient to obtain a final volume of 100 µL for each ratio.
2.8.2 – DLS and zeta potential measurements
To characterize PDMAEMA/pDNA polyplexes at various N/P ratios (5, 10 and 20) in terms of diameter and magnitude of surface electrical charge, DLS and zeta potential measurements were performed, respectively. For the DLS measurements, to a disposable plastic cuvette with 1 mL of milli-Q water, were added 20 µL of polyplex solution and thoroughly mixed prior to measurement. For the zeta potential measurements, 20 µL of polyplex solution were added to 1 mL of milli-Q water, thoroughly mixed and placed in a disposable capillary cell prior to measurement. The DLS and zeta potential measurements were performed on a Malvern Zeta Sizer Nano Series Nano-ZS instrument. All experiments were performed in triplicates at a temperature of 25 oC.
2.9 – DNA gel shift assay
To determine if PDMAEMA is able to completely bind and load DNA in polyplexes, a DNA gel shift assay was performed. In this technique, migration in the gel is retarded for polyplex samples in which the polymer is efficiently binding to the DNA,
18
in contrast to naked DNA which migrates on a gel when subjected to voltage. Polyplexes were prepared as described in section 2.8.1 with the scale up of the experiment where 2 µg of plasmid DNA were complexed with the polymer in a final volume of 50 µL for each N/P ratio (5, 10 and 20). Prior to loading the samples in an agarose gel, 7 µL of loading buffer were added to each sample. To prepare the gel, agarose (Invitrogen) was added to 1x TAE buffer, the mixture was heated in a microwave till the agarose completely dissolved and 1µL of ethidium bromide (10 mg/mL, Sigma) was added to produce 1 wt % agarose gel. The gel was subjected to a voltage of 60 V for about 1 h in 1x TAE buffer. The gel was imaged using a UV transilluminator (AlphaImager) equipped with a digital camera.
2.10 – DNase I protection assay
An import characteristic a gene delivery vector should present is the ability to protect DNA against degradation which promotes the delivery of the genetic material to the nucleus. PDMAEMA/pDNA polyplexes were incubated with DNase I to evaluate their capability to protect the genetic material from enzymatic degradation. Polyplexes were prepared as described in section 2.8.1 with 0,5 µg of plasmid DNA complexed with the polymer in a final volume of 20 µL for each N/P ratio (1; 2,5; 5 and 10). An amplification grade DNase I kit (Sigma) was used in this experiment to digest DNA in the polyplex samples. To digest DNA in the polyplex samples, 1 µL of 10x reaction buffer (200 mM Tris-HCl, pH 8.3, 20 mM MgCl2) and 1 µL of amplification
grade DNase I (1 unit/μl in 50% glycerol, 10 mM Tris-HCl, pH 7.5, 10 mM CaCl2, 10 mM
MgCl2) were mixed with the polyplexes. The mix was incubated at room temperature
for 30 min after which 1 µL of 50 mM ethylenediamine tetraacetic acid (EDTA) was added to stop the reaction. To completely inactivate DNase I, the samples were immersed in a water bath preheated to 70 oC for 15 min. Afterwards, the samples were cooled on ice and 5 µL of loading buffer were added. A positive control of DNA degradation was performed in which 0,5 µg of pDNA in 1x PBS (20 µL) were subjected
19
to the same procedure as the PDMAEMA/pDNA polyplexes. Finally, the samples were run in an agarose gel subjected to the same procedure as described in section 2.9.
2.11 – DNA release assay from PDMAEMA/pDNA polyplexes
To determine the time point at which the release of the genetic material occurs, PDMAEMA/pDNA polyplexes at N/P ratio of 10 were dialyzed against 1x PBS, followed by a DNA gel shift assay performed on samples collected during the dialysis procedure. Polyplexes were prepared as described in section 2.8.1 with the scale up of the experiment where 2,1 µg of plasmid DNA were complexed with the polymer in a final volume of 500 µL for an N/P ratio of 10. The polyplex solution was injected in a dialysis cassette (Slide-A-Lyzer Dialysis Cassette, 10K MWCO, 0,5 mL, Pierce) and dialyzed under magnetic stirring against 2 L of 1x PBS. Samples of 70 µL were taken from the cassette each 24 h and the 1x PBS was replaced with fresh one. To detect the release of plasmid DNA, a DNA gel shift assay was performed as described in section 2.9.
2.12 – In vitro transfection assay
In order to quantify the transfection efficiencies of PDMAEMA/pDNA polyplexes at various N/P ratios (5, 10 and 20), HEK293, ARPE-19 and D407 cells were transfected with these polyplexes and expression of GFP was analyzed after 24, 48 and 72 h of cell transfection. To detect GFP-positive cells, two techniques were performed: fluorescence microscopy (qualitative approach) and flow citometry (quantitative approach).
For the fluorescence optical microscopy analysis, polyplexes were prepared as described in section 2.8.1 with the scale up of the experiment where 1 µg of plasmid DNA was complexed with the polymer in a final volume of 200 µL for each N/P ratio (5, 10 and 20). A positive control of transfection was performed using FuGENE HD (Promega) according to the manufacturer’s instructions. Also, a negative control of
20
transfection was performed in which cells were subjected to the same procedures as the others present in other samples with the exception of the addition of transfection solution. HEK-293, ARPE-19 and D407 cells were plated at a concentration of approximately 5x10⁴ cells/well on 12-well plates 24 h prior to the experiment. Prior to each assay, the medium was aspirated from each well and the cells were supplied with fresh medium without FBS. To each treatment well, 100 µL of polyplex solution or FuGENE lipoplex solution were added dropwise. After 2h incubation with the particles, FBS was supplied to the cells according to the amount each cell line required. All treatments were performed in duplicate. After each time point, the plates were visualized by fluorescence microscopy consisting of a Leica DM IL inverted microscope equipped to a Leica epifluorescence system and Leica DC500 digital camera.
In regard to the flow citometry analysis, the same transfection procedure as previously described was adopted but in this assay only ARPE-19 cells were studied. Also, 6-well plates were used and approximately 1x10⁵ cells/well were plated in this assay. Moreover, the polyplex and lipoplex formulations comprised the complexation of 2 µg of plasmid DNA. After 72 h of transfection, the cells were collected and resuspended in 3 mL of 1x PBS. The cells were washed again, resuspended in 1 mL of 1x PBS and transferred to RIA tubes. Fluorescence activated cell sorting (FACS) analysis was performed using a BD FACSCalibur. Appropriate gating procedures were used to ensure only live cells were analyzed.
21
III – Results
3.1 –
1H NMR spectroscopy
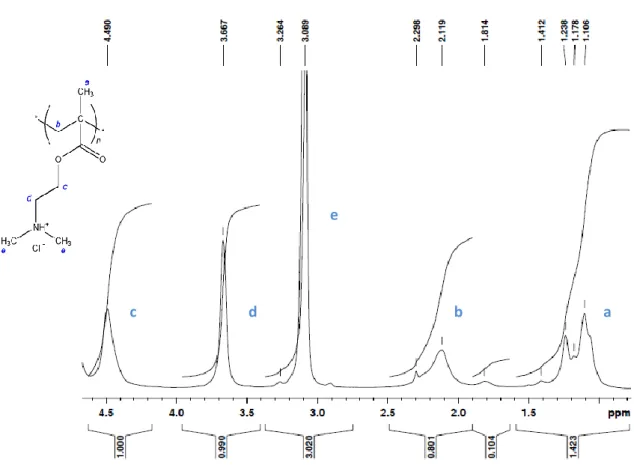
The spectrum bellow (figure 9) was obtained by 1H NMR spectroscopy (400 MHz, D2O) analysis of PDMAEMA.
Figure 9 – 1H NMR spectrum (400 MHz, D2O) of PDMAEMA.
Based on the 1H NMR spectrum (400 MHz, D2O) of the polymer (figure 9), the
peaks at 1,106 and 1,238 ppm correspond to the CH3-C protons [figure 19, (a)]
whereas the signal at 2,119 ppm refers to CH2-C protons [figure 19, (b)]. Chemical
shifts at 3,089 and 3,667 ppm correspond to protons in (CH3)2-N [figure 19, (e)] and
CH2-N [figure 19, (d)], respectively. Finally, the peak at 4,490 ppm accounts for CH2-O a b
e
d c
22
protons [figure 19, (c)]. The 1H NMR spectrum in figure 9 corresponds to that reported in [59].
3.2 – Gel permeation chromatography
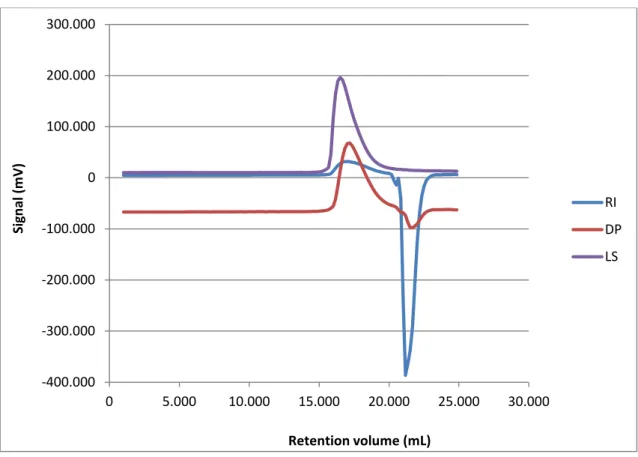
Figure 10 shows the three signals in the GPC chromatogram obtained for PDMAEMA.
Figure 10 – GPC (SEC3) triple detection (concentration (RI), viscosity (DP) and light scattering (LS)) signals (mV) as a function of the retention volume (mL).
-400.000 -300.000 -200.000 -100.000 0 100.000 200.000 300.000 0 5.000 10.000 15.000 20.000 25.000 30.000 Si gn al ( m V) Retention volume (mL) RI DP LS
23
GPC analysis revealed a monomodal molecular weight distribution, with number-average molecular weight (Mn) of 270 100 Da and Mw of 354 000 Da. Based on
these values, a PDI (Mw/Mn) of 1,31 was calculated for PDMAEMA.
3.3 – FTIR spectroscopy
The following image represents the FTIR spectrum obtained for PDMAEMA.
Figure 11 – FTIR spectrum of PDMAEMA recorded in a KBr pellet within the range 4000-600 cm-1.
In the FTIR spectrum (figure 11), we can visualize absorbing bands of 1730 and 1148 cm-1 corresponding to the stretching frequencies of C=O and C-N groups, respectively. These typical bands of interest corresponding to groups present in PDMAEMA chemical structure were also reported in [74].
24
3.4 – Potentiometric titration
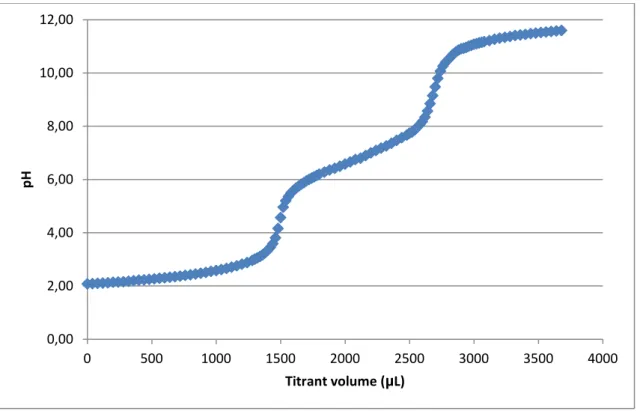
The titration curve for PDMAEMA is represented in figure 12.
Figure 12 – Potentiometric titration curve of PDMAEMA.
Two equivalence points are visible in the potentiometric titration curve previously represented. The first equivalence point is around pH 4.5 and corresponds to the HCl which was added to the analyte solution prior to the titration to lower the initial pH and to guarantee that all the titrable amines in the structure of the polymer were initially protonated. This first equivalence point is of no real direct consequence in the assay, whereas the equivalence point of interest (PDMAEMA) is around pH 9.5. By analysis of the titration curve, PDMAEMA’s pKa was determined to be around pH 7,
very close to physiological pH.
0,00 2,00 4,00 6,00 8,00 10,00 12,00 0 500 1000 1500 2000 2500 3000 3500 4000 pH Titrant volume (µL)
25
3.5 – Cell viability assay
For each well in the 96-well plate, the absorbance at 630 nm was discounted in the absorbance at 570 nm, as described in the following equation.
Equation 2 –
Therefore, all corresponding optical densities (OD) were averaged according to each condition and the cell viabilities were calculated as following:
Equation 3 –
In this calculation, it was assumed that the OD of the positive control of viability (C+) corresponded to 100% of cell viability. In the equation, ODcondition is the OD for
each condition tested (negative control of cell viability (C-), 10, 15, 20 and 30 µg of polymer).
The figure 13 summarizes the results of the MTT assays performed on HEK293 cells after 24, 48 and 72 h incubation with various amounts (10, 15, 20 and 30 µg) of PDMAEMA.
26 Figure 13 – MTT assay performed on HEK293 cells treated with various amounts of PDMAEMA (10, 15,
20 and 30 µg). Cell viability was determined after 24, 48 and 72 h of direct contact between cells and polymer. Two controls were performed: C+ and C-, untreated cells and cells incubated with a latex extract, respectively. Error bars represent the standard deviation between OD of the same treatment group.
Based on the figure 13, there is an inverse relationship between cell viability and amount of polymer used in the treatment. Moreover, increasing incubation time with the material also decreases cell viability although some cell viability was recovered after 72 h in the treatments with 10, 15 and 20 µg of polymer. Taking into account the polymer treatments at various amounts, cell viability ranged from around 80% (10 µg treatment) to around 40% (30 µg treatment).
The figure 14 summarizes the results of the MTT assays performed on ARPE-19 cells after 24, 48 and 72 h incubation with various amounts (10, 15, 20 and 30 µg) of PDMAEMA. 0 20 40 60 80 100 120 C+ C- 10 15 20 30 Vi ab ili ty (% ) Mass of polymer (µg) 24 h 48 h 72 h
27 Figure 14 – MTT assay performed on ARPE-19 cells treated with various amounts of PDMAEMA (10, 15,
20 and 30 µg). Cell viability was determined after 24, 48 and 72 h of direct contact between cells and polymer. Two controls were performed: C+ and C-, untreated cells and cells incubated with a latex extract, respectively. Error bars represent the standard deviation between OD of the same treatment group.
Based on these results, the same assumptions can be made as for the HEK293 cell line. Cytotoxicity was also directly related to polymer amount in treatments and incubation length. Different to HEK293 cells, no condition showed recovery of viability at 72 h or any other time point. In general, cell viability was markedly lower than in the previous assay, ranging from around 60% (10 µg treatment) to around 16% (30 µg treatment). The latter treatment displayed very high cytotoxicity to ARPE-19 cells.
The next graphic summarizes the results of the MTT assays performed on D407 cells after 24, 48 and 72 h incubation with various amounts (10, 15, 20 and 30 µg) of PDMAEMA. 0 20 40 60 80 100 120 C+ C- 10 15 20 30 Vi ab ili ty (% ) Mass of polymer (µg) 24 h 48 h 72 h
28 Figure 15 – MTT assay performed on D407 cells treated with various amounts of PDMAEMA (10, 15, 20
and 30 µg). Cell viability was determined after 24, 48 and 72 h of direct contact between cells and polymer. Two controls were performed: C+ and C-, untreated cells and cells incubated with a latex extract, respectively. Error bars represent the standard deviation between OD of the same treatment group.
Based on the figure 15, it is again clear a direct relationship between cytotoxicity and polymer amount in the treatment. As in the HEK293 assay, there was a recovery in cell viability along incubation time but in this assay the phenomenon was more noticeable, with additional recoveries after 48 h in treatments with 10 and 15 µg of polymer. Cell viabilities ranged from around 50% (10 µg treatment) to around 10% (30 µg treatment). D407 cells were treated differently in the assay where 1 mL/well of medium was used rather than the 1,5 mL/well in the other assays. Despite the masses of polymer being the same in comparison to the other assays, in this case the concentration of polymer was higher resulting in overall lower cell viabilities.
Comparing all the results, there is a threshold in cytotoxicity at the 20 µg of polymer mark, where the cell viability becomes abruptly sensitive to polymer quantity, especially in the RPE (ARPE-19 and D407) cell lines in which cell viabilities closely resemble the ones displayed in the negative control. These results as a whole reveal that PDMAEMA is more toxic to RPE cell lines than to HEK293 cells.
0 20 40 60 80 100 120 C+ C- 10 15 20 30 Vi ab ili ty (% ) Mass of polymer (µg) 24 h 48 h 72 h
29
3.6 – Determination of PDMAEMA/pDNA polyplexes size and zeta
potential
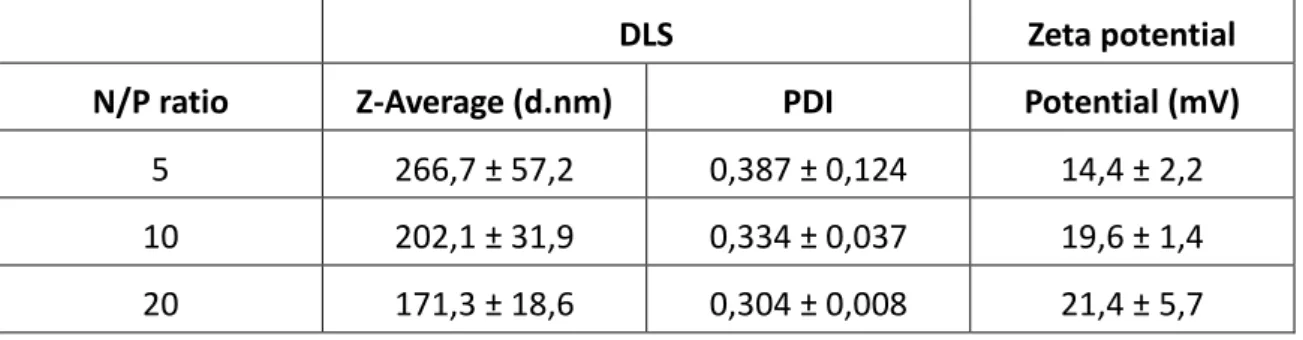
DLS and zeta potential measurements were used to determine the diameter and the magnitude of the surface electrical charge of the polyplexes, respectively. The following table summarizes the results for DLS and zeta potential measurements of PDMAEMA/pDNA polyplexes at various N/P ratios (5, 10 and 20).
Table I – Characterization of PDMAEMA/pDNA polyplexes at N/P = 5, 10 and 20 ratios. Values represent
mean ± SD (n = 3).
DLS Zeta potential
N/P ratio Z-Average (d.nm) PDI Potential (mV) 5 266,7 ± 57,2 0,387 ± 0,124 14,4 ± 2,2 10 202,1 ± 31,9 0,334 ± 0,037 19,6 ± 1,4 20 171,3 ± 18,6 0,304 ± 0,008 21,4 ± 5,7
The DLS measurements show an inverse relationship between the N/P ratio or amount of polymer used to complex pDNA and the mean diameter (nm) of the corresponding polyplexes. For all the N/P ratios studied, the polyplexes exhibited an acceptable (below 0,4) mean PDI and mean diameters ranging from 266,7 to 171,3 nm. On the other hand, zeta potential measurements indicate a direct relationship between N/P ratio and magnitude of the surface electrical charge of polyplexes. It is also worth mentioning that the zeta potentials measured were positive for all the ratios studied.
30 A B C D E
3.7 – DNA gel shift assay
A DNA gel shift assay (figure 16) was performed to determine the capabilities of PDMAEMA to bind and complex DNA at various N/P ratios (5, 10 and 20).
Figure 16 – Electrophoretic gel shift assay of PDMAEMA/pDNA polyplexes at various N/P ratios. Lane A -
1 kb DNA Ladder (marker); lane B - naked pDNA (0,3 µg in PBS); lane C - PDMAEMA/pDNA polyplexes at N/P ratio of 5; lane D - PDMAEMA/pDNA polyplexes at N/P ratio of 10; lane E - PDMAEMA/pDNA polyplexes at N/P ratio of 20.
No retardation occurred in the control were naked pDNA was loaded and electrophoresed normally. In all N/P ratios studied, PDMAEMA seemed to be able to fully bind and load pDNA. These assumptions can be made since pDNA migration was completely retarded and the particles stayed on the wells in the lanes corresponding to the polyplexes at various N/P ratios.
31 A B C D E F G
3.8 – DNase I protection assay
The following image represents the DNA gel shift assay performed to determine the protection from enzymatic degradation that PDMAEMA can confer to DNA when the two species interact electrostatically.
Figure 17 – Electrophoretic gel shift assay of PDMAEMA/pDNA polyplexes at various N/P ratios after 30
min incubation with DNase I. Lane A - 1 kb DNA Ladder (marker); lane B – naked pDNA (0,5 µg in PBS), non-digested; lane C – naked pDNA (0,5 µg in PBS), digested; lane D – PDMAEMA/pDNA polyplexes at N/P ratio of 1, digested; lane E – PDMAEMA/pDNA polyplexes at N/P ratio of 2,5, digested; lane F – PDMAEMA/pDNA polyplexes at N/P ratio of 5, digested; lane G – PDMAEMA/pDNA polyplexes at N/P ratio of 10, digested.
Based on the image above, the PDMAEMA/pDNA polyplexes at N/P ratios of 1 and 2,5 (lanes D and E, respectively) did not protect DNA from enzymatic degradation of DNase I because in the corresponding lanes there are visible DNA smears, resulting from DNA degradation. In contrast, PDMAEMA/pDNA polyplexes at N/P ratios of 5 and 10 (lanes F and G, respectively) showed enzymatic protection, shielding DNA against DNase I activity since no smears are visible throughout the corresponding lanes although the polyplexes were not visible on the wells. Interestingly, in the positive
32 A B C D E F
control for DNA degradation (lane C) smears resultant from DNA degradation are also not visible.
3.9 – DNA release assay from PDMAEMA/pDNA polyplexes
The following image represents the gel shift assay performed on PDMAEMA/pDNA polyplexes at N/P ratio of 10 submitted to dialysis against 1x PBS to determine the time point at which the release of the genetic material occurs. Due to time constrains, it was only possible to analyze polyplexes at N/P ratio of 10 in this assay.
Figure 18 – Electrophoretic gel shift assay of PDMAEMA/pDNA polyplexes at N/P ratio of 10 after
dialysis against 1x PBS. Lane A - 1 kb DNA Ladder (marker); lane B - naked pDNA (0,3 µg in PBS); lane C - PDMAEMA/pDNA polyplexes (N/P = 10) after 24 h dialysis; lane D - PDMAEMA/pDNA polyplexes (N/P = 10) after 48 h dialysis; lane E - PDMAEMA/pDNA polyplexes (N/P = 10) after 72 h dialysis; lane F - PDMAEMA/pDNA polyplexes (N/P = 10) after 96 h dialysis.
As shown in the previous figure, the PDMAEMA/pDNA polyplex samples collected after 72 and 96 h dialysis showed release of genetic material, since in the
33
corresponding lanes there are visible bands attributable to the plasmid by comparison to the control lane (B) where the naked plasmid ran normally. Although the polyplexes are not visible on the wells of lanes C and D, no plasmid bands attributable to uncomplexed plasmid are visible throughout the lane; therefore, no release of genetic material occurred at 24 or 48 h post-dialysis. Taking all these factors into account, PDMAEMA/pDNA polyplexes at N/P ratio of 10 start releasing genetic material after 72 h, at physiological pH.
3.10 – In vitro transfection assay
In the fluorescence microscopy analysis, each well on the plates was visualized and bright field as well as fluorescence filtered photos were taken at the same spot (fraction of the well that describes the best of the whole well). Afterwards, the photos were overlapped accordingly to enable visualization of total amount of cells present as well as GFP-positive cells in the same picture.
Figure 19 summarizes the results of the in vivo transfection assay on HEK293 cells. Photos were taken 24, 48 and 72 h pos-transfection for each treatment.
![Figure 3 – Chemical structure of PAMAM dendrimers (Image adapted from [4]).](https://thumb-eu.123doks.com/thumbv2/123dok_br/18921258.937476/20.892.301.595.673.916/figure-chemical-structure-pamam-dendrimers-image-adapted.webp)
![Figure 4 – Chemical structure of branched PEI (Image adapted from [4]).](https://thumb-eu.123doks.com/thumbv2/123dok_br/18921258.937476/21.892.335.554.252.399/figure-chemical-structure-branched-pei-image-adapted.webp)
![Figure 7 – Chemical structure of chitosan (Image adapted from [7]).](https://thumb-eu.123doks.com/thumbv2/123dok_br/18921258.937476/23.892.267.623.509.608/figure-chemical-structure-chitosan-image-adapted.webp)
![Figure 8 – Proposed RAFT mechanism (Image adapted from [70]).](https://thumb-eu.123doks.com/thumbv2/123dok_br/18921258.937476/24.892.167.721.529.888/figure-proposed-raft-mechanism-image-adapted.webp)