Vol.53, n. 6: pp.1519-1528, November-December 2010
ISSN 1516-8913 Printed in Brazil BRAZILIAN ARCHIVES OF
BIOLOGY AND TECHNOLOGY
A N I N T E R N A T I O N A L J O U R N A L
Respirometry Kinetics of Phenol Oxidation by Comamonas
testosteroni Pb50 under Various Conditions of Nutritional
Stress
Jan Paca
1*, Alena Kosteckova
1, Leona Pacova
2, Ales Prell
3, Martin Halecky
1, Jan Paca Jr.
2,
Marie Stiborova
2, Evguenii Kozliak
4and Carlos Ricardo Soccol
51Institute of Chemical Technology; 166 28; Prague - Czech Republic. 2Department of Biochemistry; Faculty of Science Charles University; Prague - Czech Republic. 3Institute of Microbiology; Academy of Sciences of the Czech Republic; 142 20; Prague. 4Department of Chemistry; University of North Dakota; Grand Forks -ND USA. Departamento de Engenharia Química; Divisão de Engenharia de Bioprocessos e Biotecnologia; Universidade Federal do Paraná; Curitiba - PR - Brasil
ABSTRACT
Kinetics of phenol biodegradation using suspended biomass of Comamonas testosteroni Pb50 (monoculture) was measured under conditions of nutrient abundance, limitation, and prolonged cell starvation in a fed-batch reactor, with phenol being the sole carbon and energy source. The pre-washed cells were applied for measurement of the phenol and oxygen uptake rates at varied starting phenol concentrations with the kinetic parameters calculated using the Haldane model. The results revealed that nutrient limitation significantly suppressed the maximum value of exogenous respiration rate while the endogenous respiration rate, affinity and tolerance to phenol increased. By contrast, cell starvation resulted in a drop of both the exogenous and endogenous respiration rates by an order of magnitude.
Key words: Respirometry, kinetics, phenol, nutrition stress
*Author for correspondence: [email protected]
INTRODUCTION
For biological treatment of water-soluble pollutants, whether this process is carried out by free suspended or immobilized cells, the knowledge of biokinetic parameters is essential for modeling, optimization, and assuring the required process efficiency (Lin and Cheng, 2007; Bhunia and Ghangrekar, 2008; Edalatmanesh et al., 2008; El Naas et al., 2009; Kuscu and Sponza, 2009; Saravana et al., 2009; Nicolella et al., 2009; Cokgor et al., 2009). This task is particularly
studies (Haldane, 1930; Agarry et al., 2008):
)
1
(
)
/
/(
2(max) S i
S
S
q
S
K
S
S
K
q
=
⋅
+
+
) 2 ( )
( S i 1/2
CR K K
S = ⋅
where S (mg/L) is the actual phenol concentration, Ks (mg/L) is the half-saturation constant for the growth substrate (e.g., phenol), and Ki (mg/L) is the inhibition constant. The maximal value of qs can be determined by differentiating Eq. (1) with respect to s; when dqs/ds = 0, qs is the maximum specific phenol degradation rate that can be achieved and SCR is the critical phenol concentration described by Eq. (2) separating the regimes of phenol-limited growth and inhibition by phenol. As for the physical significance of these constants (beyond equations), KS reflects the microorganism’s affinity to phenol, Ki measures a significantly (two-fold) inhibiting substrate concentration (thus reflecting phenol toxicity). The high popularity of Haldane model is due to its’ sound physical basis and practical applicability; this model proved to be the best in fitting experimental data in a number of studies (Watanabe, 1996; Kumar et al., 2005; Jiang et al., 2007; Sahinkaya and Dilek, 2007; Jahan et al., 2008; Singhet et al., 2008; Agarry and Solomon, 2008; Nicolella et al., 2009; El-Naas et al., 2009). However, the critical weakness of this and other models is that the parameters determined under the idealized conditions of a research laboratory may not accurately represent the real physiological status of a bacterial culture. Small changes in environmental or nutrition conditions, e.g., pH of the medium or extent of cells’ adaptation to phenol, may significantly affect the bacterial growth and phenol removal efficiency (Contreras et al., 2008). As a result, similar (sometimes, the same) strains under seemingly similar conditions may yield different values of kinetic constants (Agarry et al., 2008). In particular, we postulate that Haldane parameters may change upon simple biomass treatments, such as re-suspension in simple buffers upon centrifugation, especially if this treatment is prolonged.
Thus, the present study is focused on the determination of kinetic parameters of aerobic phenol degradation by free suspended cells of Comamonas testosteroni Pb50 under varied growth/nutrition conditions. Unlike the other
identify the effects of nutrition limitation/abundance and cell starvation on both the exogenous (i.e., due to phenol oxidation) and endogenous respiration rates under inhibitory conditions caused by the presence of phenol. Determination of these parameters under specific conditions of growth and nutrient limitation allowed us to recognize physiological changes in the cell population resulting from impacts of the above-mentioned factors.
MATERIALS AND METHODS
Microorganisms
Comamonas testosteroni Pb50 was used for aerobic phenol degradation as a monoculture. This strain was isolated from a biofilm developed on polyurethane foam particles of a packed bed reactor after 4 months of continuous phenol degradation (Paca Jr. et al., 2005). The strain was able to utilize phenol, toluene, xylenes, styrene, and acetone as the sole carbon and energy sources.
Medium
Cell cultivations for the biodegradation experiments were carried out using the base synthetic medium (BSM) containing 4.30 g/L K2HPO4, 3.40 g/L KH2PO4, 2.00 g/L (NH4)2SO4,
0.34 g/L MgCl2×6H2O, 0.30 mg/L ZnSO4×7H2O,
0.16 mg/L MnSO4×7H2O, 0.15 mg/L
CaSO4×0.5H2O, 0.10 mg/L FeSO4×7H2O, 0.10
mg/L CuSO4×5H2O, 0.10 mg/L CoSO4×7H2O,
0.10 mg/L Na2B4O7×10H2O, 0.10 mg/L
Na2MoO4×2H2O. Phenol was used as the sole
carbon and energy source.
Apparatus, Conditions and Kinetic
Measurements
Figure 1 - Picture of the bioreactor.
In respiration experiments, the dissolved oxygen concentration changes were monitored using a polarographic O2 probe (Mettler, Toledo, Spain).
Respirometric measurements were conducted in a closed device with a magnetically driven impeller (with a working volume of 73 mL). The data were transferred to a computer using a micro-DCU (B. Braun Biotech GmbH, Melsungen, Germany). The respiratory flask was completely filled with the base mineral medium saturated with oxygen from air and thermostated at 30 °C. Then, a cell suspension in the same medium, with a controlled amount of biomass, was injected. The ensued constant rate (slope) of dropping the dissolved oxygen concentration was recorded as the endogenous respiration rate,
q
Oend2 . Then, a
controlled amount of phenol solution was injected yielding a faster total respiration rate,
2
O
q , which
was measured as a greater slope, within the linear range of the observed decline of oxygen concentration.
The exogenous (
q
Oex2) respiration rate was
calculated as a difference between
q
Oend2 and qO2
according to Equation (3):
)
3
(
22 2
end O ex O
O
q
q
q
=
+
The exogenous respiration rate describes the specific oxygen consumption rate for phenol oxidation whereas the endogenous respiration rate
is that of intracellular materials’ consumption upon their biological oxidation.
The biomass for respiration/biodegradation experiments was obtained using a phenol fed-batch culture system as described previously (Vojta et al., 2002). Experiments with mineral nutrients present in abundance were carried out using the base mineral medium. Select experiments were conducted in distilled water supplemented with certain nutrients (e.g., potassium phosphate for phosphorus and either potassium nitrate or ammonium sulfate for nitrogen) (1.0 g/L). In these experiments, prior to preparing the cell suspension, the centrifuged cells were washed twice with distilled water supplemented with the same salts as in the subsequent experiment, to eliminate the additional effect of ionic strength (osmotic pressure) in comparison to the growth medium. When mineral nutrients were present in abundance, the base mineral medium was used for washing. Cell starvation in select experiments was conducted for 16 h by placing the cell suspension in a salt solution of a required composition on a rotary shaker prior to the measurement.
Analytical Methods
The gravimetrically determined cell dry weight concentration (Xdw) was applied for concentrated
cell suspensions applied for spectrophotometric measurements of cell density. The biomass concentration (X) at the start of the phenol degradation and respiration experiments was measured photometrically as an optical density (OD) at 500 nm (Specol 11; Carl Zeiss, Jena, Germany); then, X was computed from the following calibration equation: X = 0.452·OD – 0.003 (g/L) with R2 = 0.999. Biomass
concentrations during the
biodegradation/respiration experiments were in a range of 0.20 – 0.22 g/L.
Phenol concentrations in the supernatant were determined using HPLC with a UV detector (Spectro monitor 3200 at 270 nm) and a column (Nucleosil 12-5 C18, 250 x 4 mm; Watrex, Czech Republic) operated under isocratic conditions (using the eluent mixture with the following component ratio: methanol-water-H3PO4, 50: 49: 1
at a flow rate of 1.0 mL/min). The signal obtained was evaluated by a Chromatography Station for Windows, version 1.7 (CSW).
Obtaining the Kinetic Parameters
The Haldane model kinetic parameters of Equations (1-2) were obtained from the data on phenol consumption using the analytical methods described in the previous section.
The bulk of the biokinetic parameters were obtained using respiration kinetic measurements. Upon measuring the exogenous respiration rates at varied phenol concentrations, the parameters of Haldane equation were obtained as given by Equations (4-5):
)
4
(
)
/
/(
' 2 '(max)
2
2 O S i
O
q
S
K
S
S
K
q
=
⋅
+
+
) 5 ( )
( ' ' 1/2 '
i S
CR K K
S = ⋅
Effective affinity and toxicity parameters of Equations (1-2) and (4-5) (KS vs. K’s and Ki vs. K’I, respectively) and specific degradation/oxidation rates (qS(max) and qO2(max)) were then compared
and discussed, see Results and Discussion.
The kinetic constants of the Haldane model were determined from experimental parameters (e.g.,
linear regression.
RESULTS AND DISCUSSION
Kinetic Parameters Obtained in the Base Growth Medium
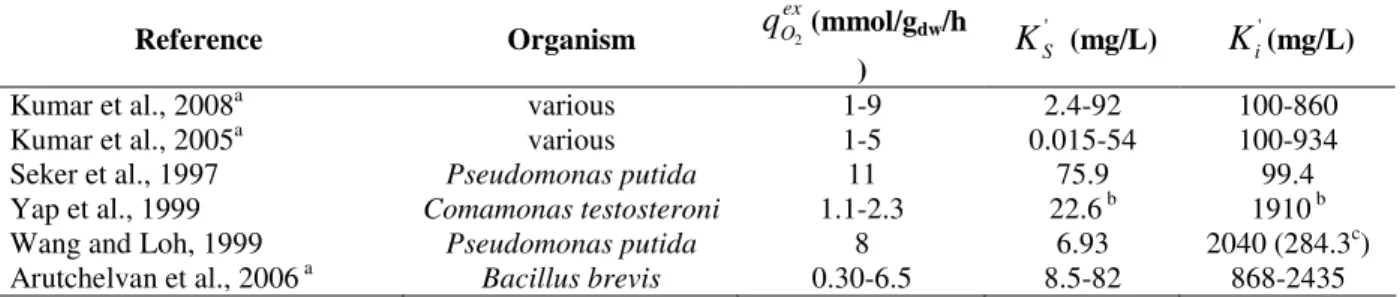
Figure 2a shows the concentration profile for phenol biodegradation observed in the growth medium. The Haldane equation parameters obtained are summarized in Table 1. They are comparable with the values reported in other studies (Table 2). The wide variation of kinetic constants may be due to different strain physiology, age of the population at harvesting, treatment conditions at preparing the cells for
measurements and different
environmental/nutrition conditions during the measurements. Figure 2b shows the exogenous respiration rates of Comamonas testosteroni Pb50 grown on phenol.
The calculated kinetic parameters are provided in Table 1, so they may be compared with those of phenol degradation. This comparison revealed a higher affinity and tolerance to phenol for the exogenous respiration (characterizing the oxygen consumption coupled with phenol oxidation) than for the specific phenol degradation rate (i.e., lower values of K’S vs. KS and higher values of K’i vs. Ki). A slightly higher affinity to phenol for respiration compared to phenol consumption is often observed and may be explained by higher substrate affinity of phenol oxygenases (dominating the respiration) than that of other phenol-degrading enzymes (Contreras et al., 2008; Ellis et al., 2006).
Figure 2 - Specific rate of phenol consumption (a) and exogenous respiration rate (b) in the base growth medium. Bars represent standard deviations. S is the phenol concentration (mg/L).
The maximum exogenous respiration rate observed in the base growth medium was higher than the values reported by several other researchers as it follows from Table 2. Different methods of measurement and/or medium composition may contribute to this difference. However, the population physiology (e.g., the cell
nutrition conditions and the time elapsed between the cell harvesting and degradation/respiration experiments) may also be among the primary factors causing these changes. The influence of such potential stress factors was investigated in the subsequent experiments.
Figure 3 - Effect of phenol concentration on the ratio of metabolic quotients (respiration/phenol consumption) in the growth medium.
0 0.5 1 1.5 2
S (mg/L)
qs
(
m
m
o
l/
(gd
w
.h
))
0 5 10 15
0 200 400 600
S (mg/L)
qO
2
ex (
m
m
o
l/
(g
d
w
.h
))
a
b
)
/(
(
2
h
g
m
m
o
l
q
d
w
ex O
⋅
)
/(
(
h
g
m
m
o
l
q
d
w
S
⋅
0 2 4 6 8 10 12
0 200 400 600
S (mg/L)
qO
2
/qsS
e
x
O
q
q
/
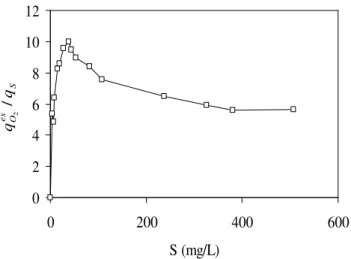
For a more accurate description and physiological interpretation of the inhibitory effect of phenol, the ratio of metabolic quotients S
ex
O
q
q
/
2 was
evaluated at varied initial phenol concentrations in the base growth medium, i.e., with ample mineral nutrients (Figure 3).
At low phenol concentrations, this ratio increased with phenol concentration, thus reflecting the increasing percentage of exogenous respiration. The values of S
ex
O
q
q
/
2 around the peak closely
matched those that can be expected for a complete phenol oxidation. A similar behavior (though yielding lower numerical values due to a different
(1991) for an immobilized unidentified mixed culture.
At higher (inhibiting) phenol concentrations, the
S ex
O
q
q
/
2 coefficient declined, Figure 3, thus
demonstrating that the exogenous respiration is more susceptible to inhibition by this toxic substrate than the phenol removal rate. Perhaps, the presence of ample oxygen (accessible in the experiments on phenol consumption conducted in an open reactor) decreased the physiological sensitivity of cells to phenol inhibition as it was reported for eukaryotic cells (Paca et al., 2002).
Table 1 – Kinetic parameters obtained in the base medium, i.e., when all nutrients in the growth medium were present in ample amounts.
ex
q
(max) (mmol/gdw/h) end Oq
2 (mmol/gdw/h)
S
cr;'
cr
S
a(mg/L)
K
S;K
S' (mg/L)K
i;K
i' (mg/L)S
q
2.5 ± 0.2 128.1 ± 3.3 88.4 ± 4.3 131 ± 32
O
q
29.6 ± 0.9 2.1 ± 0.3 97.5 ± 1.1 58.5 ± 2.6 324 ± 5a
Calculated using Equations 2 and 5.
Table 2 – Haldane kinetic parameters for exogenous phenol biodegradation obtained in other studies.
Reference Organism
ex O
q
2(mmol/gdw/h
)
'
S
K
(mg/L)K
i'(mg/L)Kumar et al., 2008a various 1-9 2.4-92 100-860
Kumar et al., 2005a various 1-5 0.015-54 100-934
Seker et al., 1997 Pseudomonas putida 11 75.9 99.4
Yap et al., 1999 Comamonas testosteroni 1.1-2.3 22.6 b 1910 b
Wang and Loh, 1999 Pseudomonas putida 8 6.93 2040 (284.3c)
Arutchelvan et al., 2006 a Bacillus brevis 0.30-6.5 8.5-82 868-2435
a
Including the review of the then-up-to-date literature. b
Mutant strain. c
Value obtained from growth kinetics.
However, this effect gradually declined and finally leveled off at higher phenol concentrations (almost no further decrease of the
q
Oex/
q
S2 ratio was
observed above 200 mg of phenol/L). Note that, based on the entire concentration profile shown in Figure 2, the
q
Oex/
q
S2 ratio is nearly constant
within a wide range of phenol concentrations, except for the narrow near-peak area. Thus, respirometry-based values are qualitatively representative for phenol biodegradation kinetics. Contreras et al. (2008) came up with a similar conclusion (noting its limitation that respirometry
kinetics in closed reactors is directly applicable only to substrate overload conditions in open batch reactors). However, the
q
Oex/
q
S2 ratios obtained in
Respiration Kinetics under Mineral Nutrient Limitation
This part of the study was focused on the effect of main mineral macronutrients on the respiration kinetics. The following ions have been selected: phosphate, ammonia and nitrate (either as individual nutrients or in combinations). The results are shown in Figure 4 and the calculated
kinetic parameters according to Equations (4) and (5) are listed in Table 3. The kinetic analysis revealed that nutrient limitation significantly decreased the exogenous respiration rate but increased the cell affinity to phenol (i.e., lower K’s)
and the cell tolerance to phenol (higher K’i) as
implied by the physical significance of these parameters in Equations 1 and 4.
Figure 4 - Exogenous respiration rates under nutrition limitation. The mineral nutrients present in the aqueous medium are shown in the legend.
○ -
PO
43− +NH
4+; ● -PO
43− +NO
3−; -NH
4+; ■ -PO
43−; □ -NO
3−Endogenous Respiration under Nutrient
Limitation
From Tables 1 and 3 it can be seen that the endogenous respiration rate increased significantly (nearly two-fold) under conditions of mineral nutrient limitation in comparison to the base growth medium. This was expected because when the cells are deprived of an external nutrient under aerobic conditions, the endogenous metabolism rate (characterized by
q
Oend2 ) increases to
compensate for the lack of external carbon source, due to the catabolism of intracellular reserve compounds (Dawes and Ribbons, 1962; Van Loosdrecht et al., 1997; Van Loosdrecht and Henze, 1999). Orupold et al. (2001) determined
end O
q
2 = 0.08 – 0.38 mmol per g of suspended
solids per h for activated sludge. Dietrich and Burris (1967) for Bacillus cereus found
q
Oend2 = 7.6
mmol/g/L. The values observed in this study, 2.1 – 4.3 mmol/gdw/h, are within this range. Rather large
variations of the reported endogenous respiration
rate indicate that this parameter appears to be sensitive to external stresses and may serve as an indicator of the population’s physiological conditions.
Under conditions of a nutrition stress, the maximal rates of exogenous respiration became virtually equal to those of endogenous respiration (Table 3). This is consistent with the fact that cell growth (and, thus, the growth-coupled substrate/oxygen consumption rate) is severely limited by the availability of mineral nutrients rather than the external carbon source. By contrast, when, at least, both ammonia and phosphorus are present in sufficient amounts (thus, enabling some minimum protein/nucleic acid synthesis), the exogenous respiration rate increases in comparison with the endogenous rate (see the first line of Table 3). Note that the inhibition of respiration by excess phenol virtually vanishes under nutrient-limited growth (the values of K’i increase by an order of magnitude), thus indicating that the uptake of this toxic substrate into cells (actually causing toxicity) also declines.
0 2 4 6 8 10 12
0 200 400 600
S (mg/L)
q
O
2
ex
)
/(
(
2
h
g
m
m
o
l
q
d
w
e
x
O
nitrogen), a drop of the ratio S ex
O
q
q
/
2 was
observed by Burleigh and Dawes (1967) for Sarcina lutea. This observation shows that
sensitive indicator of the cells’ physiological status than changes in phenol consumption.
Table 3 – Respiration kinetic parameters of the Haldane model under nutrient limitation.
Nutrient
ex O
q
(max)2
(mmol/gdw/h)
end O
q
2
(mmol/gdw/h)
'
cr
S
(mg/L)'
S
K
(mg/L)'
i
K
(mg/L)− 3 4
PO
+NH
4+ 12.0 ± 0.5 4.3 ± 0.6 41.8 ± 0.1 5.9 ± 0.1 625 ± 15−
3 4
PO
+NO
3− 4.6 ± 0.2 4.1 ± 0.4 11.4 ± 0.1 0.6 ± 0.1 1423 ± 26+
4
NH
4.6 ± 0.2 3.9 ± 0.4 15.0 ± 0.1 0.5 ± 0.1 1184 ± 36−
3 4
PO
3.3 ± 0.2 3.0 ± 0.4 26.6 ± 0.2 0.4 ± 0.1 498 ± 23−
3
NO
2.9 ± 0.1 2.9 ± 0.4 13.4 ± 0.1 0.2 ± 0.1 1058 ± 45Table 4 – Respiration kinetic parameters of the Haldane model of a starved population under nutrient limitation.
Nutrient
ex O
q
(max)2
(mmol/gdw/h)
end O
q
2
(mmol/gdw/h)
'
cr
S
(mg/L)'
S
K
(mg/L)'
i
K
(mg/L)−
3 4
PO
+NH
4+ 0.91 ± 0.03 0.30 ± 0.11 39.17 ± 2.53 1.36 ± 0.06 1194 ± 22−
3 4
PO
+NO
3− 0.59 ± 0.02 0.28 ± 0.16 7.16 ± 0.47 0.13 ± 0.02 385 ± 8Effect of Cell Starvation on Phenol Respiration Kinetics
The physiology of washed resting cells can be influenced not only by the treatment itself but also by the length of such a treatment. For this reason, a test of the effect of long-term starvation (16 h) was carried out in the media containing
PO
43− ++
4
NH
andPO
43− +NO
3−. The exogenous respiration concentration profiles are shown in Figure 5 and the kinetic parameters obtained (including endogenous rates) are provided in Table 4.Figure 5 - Exogenous respiration rates of a 16-h starved population under nutrition limitation. The mineral nutrients present in the aqueous medium are shown in the legend.
○ -
PO
43− +NH
4+; ● -PO
43− +NO
3−0 0.2 0.4 0.6 0.8 1
0 200 400 600
S (mg/L)
q
O
2
ex
)
/(
(
2
h
g
m
m
o
l
q
d
w
e
x
O
These experiments revealed a ca. 10-fold drop of the maximum exogenous respiration rate (
q
Oex2)combined with a similar drop of the endogenous respiration rate. These values are similar to those reported by Burleigh and Dawes (1967) for Sarcina lutea achieved with glucose as an exogenous substrate under similar conditions,
q
Oex2= 1.17 mmol/g/h and
q
Oend2 = 1.10 mmol/g/h, withend O
q
2 continuing to drop down to 0.18 mmol/g/h
upon a 16-h starvation. Similar findings were also obtained by Konopka et al. (2002) with an activated sludge under conditions of long-term starvation.
A significant drop of the saturation/affinity constant (K’S) upon a long-term starvation (Table 4 compared to the first two lines of Table 3 and, particularly, to Table 1 under no nutrient limitations) demonstrated an increase of the cells’ affinity to phenol compared to the normal growth. By contrast, the cell tolerance to phenol (K’i) maintained the same order of magnitude, showing no clear trends in observed changes. These observations indicate that, unlike the short-term starvation, cells may adapt to using phenol as a carbon source during a long-term starvation.
CONCLUSIONS
Respiration kinetics using the Haldane model is qualitatively representative for phenol degradation biokinetics and reflects the cells’ physiological state; the
q
Oex/
q
S2 ratio is nearly constant for C.
testosteroni Pb50 within a wide range of phenol concentrations, except near the peak. The mineral nutrient limitation results in a near-10-fold decline of the exogenous respiration rate thus approaching the endogenous respiration rate values, with a concurrent increase of the cell affinity and decrease of cell toxicity to phenol. Long-term cell starvation in mineral buffer solutions resulted in a further 10-fold drop of both the exogenous and endogenous respiration rates, along with an increase of the cell affinity to phenol. Thus, when cells are washed with buffers (particularly, if this treatment is prolonged), an alteration of Haldane kinetics parameters may occur.
ACKNOWLEDGEMENT
The work was financially supported by the Ministry of Education of the Czech Republic, Project MSM 6046137305, Project MSM 0021620808 and Project AMVIS ME09031.
REFERENCES
Agarry, S.E.; Solomon, B.O. (2008), Kinetics of batch microbial degradation of phenols by indigenous Pseudomonas fluorescence. Int J Environ Sci Tech, 5 (2), 223-232.
Agarry, S.E.; Durojaiye, A.O.; Solomon, B.O. (2008), Microbial degradation of phenols: a review. Int J Environ Pollut., 32 (1), 12-28.
Arutchelvan, V.; Kanakasabai, V.; Elangovan, R.; Nagarajan, S.; Muralikrishnan, V. (2006), Kinetics of high strength phenol degradation using Bacillus brevis. J Hazard Mater.,129 (1-3), 216-222.
Arvin, E.; Jensen, B.K.; Gundersen, A.T. (1991), Biodegradation kinetics of phenols in a aerobic biofilm at low concentrations. Water Sci Technol., 23, 1375-1384.
Bhunia, P.; Ghangrekar, M.M. (2008), Analysis, evaluation, and optimization of kinetic parameters for performance appraisal and design of UASB reactors.
Bioresour Technol., 99 (7), 2132-2140.
Burleigh, I.G.; Dawes, E.A. (1967), Studies on the endogenous metabolism and senescence of starved
Sarcina lutea. Biochem J., 102, 236-250.
Cokgor, E.U.; Insel, G.; Aydin, E.; Orhon, D. (2009), Respirometric evaluation of a mixture of organic chemicals with different biodegradation kinetics. J Hazard Mater.,161 (1), 35-41.
Contreras, E.M.; Albertario, M.E.; Bertola, N.C.; Zaritzky, N.E. (2008), Modelling phenol biodegradation by activated sludges evaluated through respirometric techniques. J Hazard Mater.,
158 (2-3), 366-374.
Dawes, E.A.; Ribbons, D.W. (1962), The endogenous metabolism of microorganismus. Ann Review Microbiology, 16, 241-264.
Dietrich, S.M.C.; Burris, R.H. (1967), Effect of exogenous substrates on the endogenous respiration of bacteria. J Bacteriol., 93, 1467-1470.
Ellis, L.B. M.; Roe, D.; Wackett, L.P. The University of Minnesota Biocatalysis/Biodegradation Database: the first decade. Nucleic Acids Research (2006), 34(Database), D517-D521.
Optimization of phenol degradation in a combined photochemical-biological wastewater treatment system. Chem Eng Res Des, 86 (11), 1243-1252. Haldane, J.B.S. (1965), Enzymes. Longman Green,
London, UK.
Jahan, K.; Ordonez, R.; Ramachandran, R.; Balzer, S.; Stern, M. (2008), Modeling biodegradation of nonylphenol. Water Air Soil Pollut Focus, 8(3-4), 395-404.
Jiang, Y.; Wen, J.; Bai, J.; Jia, X.; Hu, Z. (2007), Biodegradation of phenol at high initial concentration by Alcaligenes faecalis. J Hazard Mater.,147 (1-2), 672-676.
Konopka, A.; Zakharova, T.; Nakatsu C. (2002), Effect of starvation length upon microbial activity in a biomass recycle reactor. J Ind Microbiol Biotechnol., 29, 286-291.
Kumar, A.; Kumar, S.; Kumar, S. (2005), Biodegradation kinetics of phenol and catechol using Pseudomonas putida MTCC 1194. Biochem Eng J, 22 (2), 151-159.
Kuscu, O.S.; Sponza, D.T. (2009), Kinetics of para-nitrophenol and chemical oxygen demand removal from synthetic wastewater in an anaerobic migrating blanket reactor. J Hazard Mater.,161 (2-3), 787-799. Limbert, E.S.B.; Betts, W.B. (1995), Kinetics of
bio-oxidation of medium comparising phenol and mixture of organic contaminants. Appl Microbiol Biotechnol., 43, 165-170.
Lin, C.W.; Cheng, Y. W. (2007), Biodegradation kinetics of benzene, methyl tert-butyl ether, and toluene as a substrate under various substrate concentrations. J Chem Technol Biotechnol., 82 (1), 51-57.
Nicolella, C.; Converti, A.; Zilli, M. (2009), Biotrickling air filtration of 2-chlorophenol at high loading rates. Biochem Eng J., 43 (1), 98-105. Orupold, K.; Masirin, A.; Tenno, T. (2001), Estimation
of biodegradation parameters of phenolic compounds on activated sludge by respiratory. Chemosphere, 44, 1273-1280.
Paca, J.; Martius, G.G.S. (1996), Inhibition concentration of phenolic substances under different cultivation conditions - part I: phenol oxidation by mixed microbial population in a model system. Acta Hydrochim Hydrobiol., 24, 127–131.
Paca, J.; Komarkova, E.; Prell, A.; Stiborova, M.; Sobotka M. (2002), Kinetics of phenol oxidation by
Candida tropicalis: Effects of oxygen supply rate and nutrients on phenol inhibition. Folia Microbiol., 47, 701-707.
Paca, J.; Gregr V. (1979) Effect of
2
O
P
on growth and physiological characteristics of Candida utilis in a multistage tower fermentor. Biotechnol. Bioeng., 21 (10), 1827-1843.Sobotka, M.; Gerrard, A.M.; Soccol, C.R. (2005), Continuous aerobic phenol degradation by defined mixed immobilized culture in packed bed reactors,
Folia Microbiol.,50, 301-308.
Sahinkaya, E.; Dilek, F.B. (2007), Modeling chlorophenols degradation in sequencing batch reactors with instantaneous feed-effect of 2,4-DCP presence on 4-CP degradation kinetics.
Biodegradation 18 (4), 427-437.
Saravanan, P.; Pakshirajan, K.; Saha, P. (2009), Batch growth kinetics of an indigenous mixed microbial culture utilizing m-cresol as the sole carbon source. J Hazard Mater., 162 (1), 476-481.
Seker, S.; Beyenal, H.; Salih, B.; Tanyolac, A. (1997), Multi-substrate qrowth kinetic of Pseudomonas putida for phenol removal. Appl Microbiol Biotechnol., 47, 610-614.
Singh, R.K.; Kumar, S.; Kumar, S.; Kumar, A. (2008), Biodegradation kinetic studies for the removal of p-cresol from wastewater using Gliomastix indicus
MTCC 3869. Biochem Eng J., 40 (2), 293-303. Tomei, M.C.; Annesini, M.C. (2008), Removal of
xenobiotics in a two phase sequencing batch reactor: kinetics and modelling. Wat Sci Technol., 58 (2), 385-390.
Tsai, S.-Y.; Juang, R.-S. (2006), Biodegradation of phenol and sodium salicylate mixtures by suspended
Pseudomonas putida CCRC 14365. J Hazard Mater.,
138 (1), 125-132.
Van Loodrecht, M.C.M; Pot, M.A.; Heinen, J.J. (1997), The role of storage polymers in bioprocesses. Wat Sci Technol., 35, 41-47.
Van Loodrecht, M.C.M.; Henze, M. (1999), Maitenance, endogenous respiration, lysis, decay and predation. Wat Sci Technol., 39, 107-117.
Vojta, V.; Nahlik, J.; Paca, J.; Komarkova, E. (2002), Development and verification of the control system for fed-batch phenol degradation process. Chem Biochem Eng Q, 16, 59-67.
Wang, S.-J.; Loh, K.-C. (1999), Modeling the role of metabolic intermediates in kinetics of phenol biodegradation. Enzyme Microb Technol, 25, 177-184.
Watanabe, K.; Hino, S.; Onodera, K.; Kajie, S.-I.; Takahashi, N. (1996), Diversity in kinetics of bacterial phenol-oxygenating activity. J Ferment Bioeng, 81(6), 560-563.
Yap, L.F.; Lee, Y.K.; Poh, C.L. (1999), Mechanism for phenol tolerance in phenol-degrading Comamonas testosteroni strain. Appl Microbiol Biotechnol, 51, 833-840.