Inter Hydrogen Bonded Complexes of Hexadecylaniline and Alkoxy Benzoic Acids : A Study of
Crystallization Kinetics
V.N. Vijayakumar, K. Murugadass and M.L.N. Madhu Mohan∗
Liquid Crystal Research Laboratory (LCRL), Bannari Amman Institute of Technology Sathyamangalam 638 401, India (Received on 5 June, 2009)
A systematic crystallization kinetic study of two smectogens of homologous series of the inter molecular hydrogen bonded between undecyl, dodecyl benzoic acids and hexadecylaniline complexes viz., 16A+11BA and 16A+12BA respectively has been carried out by thermal microscopy, differential scanning calorimetry (DSC) and dielectric studies. FTIR studies indicate the formation of hydrogen bond in these complexes. The crystallization kinetics was studied by two techniques viz., the traditional thermal analysis (DSC) and electrical studies in which capacitance and dielectric loss variation with temperature were recorded and analyzed. The DSC thermograms were run from crystallization temperature to the isotropic melt for different time intervals. The liquid crystalline behaviour together with the rate of crystallization of smectic ordering in newly synthesized inter hydrogen bonded complexes were discussed in relation to the kinetophase (which occurs prior to the crystallization). The molecular mechanism and dimensionality in the crystal growth were computed from the Avrami equation. The characteristic crystallization time (t*) at each crystallization temperature was deduced from the individual plots of log t and ∆H. Further, it was observed that the data obtained from DSC and dielectric studies were in good agreement with one another. For the first time in the history of crystallization studies, crystallization kinetics data is experimentally elicited from a novel dielectric technique.
Keywords: 16A+nBA, Induced Smectic Phases, Crystallization Kinetics, Inter Hydrogen Bonding
Introduction
The smectic orderings exhibited by the liquid crystals can be broadly classified as orthogonal and tilted phases. The molecules in the orthogonal smectic phases are parallel to each other with their long axes perpendicular to the layer plane, resulting in free rotation of the molecules around the long molecular axis [1]. Consequently, in the case of tilted phase the significant difference is the tilt of the molecular long axes with respect to the layer normal, leading to the hindered rotation of the molecule along the long axis. Fur-thermore, the layer thickness in a tilted mesophase is smaller than the molecular length while in the case of orthogonal or-dering they are approximately equal. This degree of varia-tion in the layer thickness, coupled with the molecular ro-tation, has a significant influence on the rate of crystalliza-tion. In fact, the distribution of heat transformation in both orderings, which has a direct impact on the rate of crystalliza-tion, is rather complicated process which may be elucidated structurally by detailed X-ray investigation. Alternatively, the study and analysis of crystallization kinetics [2, 3] is a powerful tool to understand the various mechanisms involved in crystallization of liquid crystals. The inter molecular hy-drogen bonded p-n-alkoxybenzoic acids (nABA) and hexade-cylaniline liquid crystalline materials exhibits a fascinating mesomorphic behaviour associated with a distinct molecular ordering; the convenient working thermal range makes them suitable for systematic kinetic investigations. In continuation of our experimental studies [4-11] on liquid crystals here we present a detailed analysis of two smectogens of the hexade-cylaniline series namely 16A+11BA and 16A+12BA.
∗Electronic address:[email protected]
Experimental
The crystallization kinetics of the present compounds, de-termined by the rate of growth of a particular transition, were performed on a Shimadzu DSC-60 differential scanning calorimeter and Agilent 4192A LF impedance analyzer. The thermograms at each crystallization temperature, together with simultaneous phase identification were obtained using an Instec Standalone Temperature Controller (STC 200) sup-plemented by Nikon polarizing microscope. The DSC mea-surements were performed on each member of compounds (3-7 mg sample) using aluminum and/or glass crucibles. A typical DSC scan for a given sample at each crystallization temperature is described as follows. The sample was heated to its isotropic melt with a scan rate of 10oC min−1 ; after
holding for 1 minute to attain thermal equilibrium, the sample was cooled at the same scan rate to its predetermined crystal-lization temperature. After holding for a requisite time inter-val at crystallization temperature, the endothermic peaks were recorded while the sample was cooled to the crystal state with a scan rate of 10oC min−1. This process was repeated for each individual member of the series at the appropriate preselected crystallization temperatures.
For the elucidation of the dielectric data, the sample un-der investigation was filled in a 4 micron spacer polyamide buffed cells (Instec Inc. USA) in its isotropic state under vac-uum. Silver paste and wires were used to draw the electrodes from the cell. The cell was placed in a Instec hot and cold stage (HCS402) equipped with Instec Standalone Tempera-ture Controller (STC 200). The temperaTempera-ture is monitor and controlled through a computer by a software program to an accuracy of±0.01oC. The sample was heated to its isotropic melt with a scan rate of 10oC min−1; after holding for a period
was repeated for each individual member of the series at the appropriate preselected crystallization temperatures.
Synthesis of intermolecular Hydrogen bonded complexes
The intermolecular Hydrogen bonded complexes are syn-thesized by the addition of one moles of undecyloxy benzoic acid/ dodecyl benzoic acid with one mole of 4- hexadecylani-line in N, N-Dimethyl formamide (DMF) respectively. Fur-ther they are subject to constant stirring for 12 hours at am-bient temperature of 30oC till a white precipitate in a dense solution is formed. The white crystalline crude complexes so obtained by removing excess DMF are then recrystallized. The yield of the complex is approximately 95%. The inter hydrogen bonded complex of undecyl / dodecyl benzoic acids with 4- hexadecylaniline can be depicted as shown in the fig-ure 1, where n represents alkoxy carbon number of benzoic acid.
FIG. 1: Molecular structure of the hydrogen bonded complex.
Phase diagram of the hydrogen bonded complexes
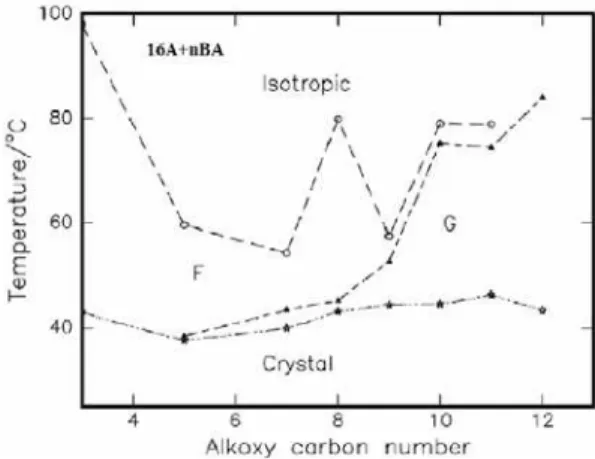
The phase diagram of the hydrogen bonded homologous series is illustrated as figure 2. It can be noticed that in the lower homologous series smectic F is pronounced while in the higher homologous series smectic G is pronounced. Thus it can be inferred that smectic F and G has been induced in the present series of hydrogen bonded complexes.
FIG. 2: Phase diagram of the 16A+nBA complex.
Results and Discussions
Infrared Spectroscopy (FTIR)
The IR spectra of p-n-alkoxybenzoic acid, 4-hexyl aniline and their intermolecular H- bonded complex were recorded in the solid state (KBr) at room temperature .The solid state spectra of free alkoxybenzoic acid is reported [12] to have two sharp bands at 1685 and 1695 cm−1due to the frequency
ν(C=O) mode. The doubling feature of this stretching mode
confirms the dimeric nature of alkoxybenzoic acid at room temperature [12]. Further a strong intense band appearing at 2916cm−1 is assigned to ν(O-H) mode of the carboxylic
acid group. The IR spectrum (KBr) of 4- hexadecylani-line shows characteristic bands forν(C=O)(∼1628cm−1), ν(N-H) (∼3371cm−1) and ν(C-O) (∼1257cm−1)
stretch-ing modes. The hypsochromic shift inν(C=O) of acid(∼
62cm−1)and bathochromic shift inν(OH)(∼8cm−1)mode
of acid in the present series suggest the formation of inter molecular H- bonding between the –COOH group of p-n-alkoxybenzoic acids and the –NH of 4- hexadecylaniline. The presence of H-bonding in the present complexes was further inferred by the appearance of new band diagnostic ofν(O—
H) at 2569cm−1. FTIR spectrum of 16A+11BA is shown in figure 3.
FIG. 3: FTIR spectrum of 16A+11BA complex
Phase Identification
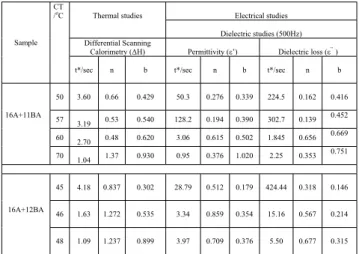
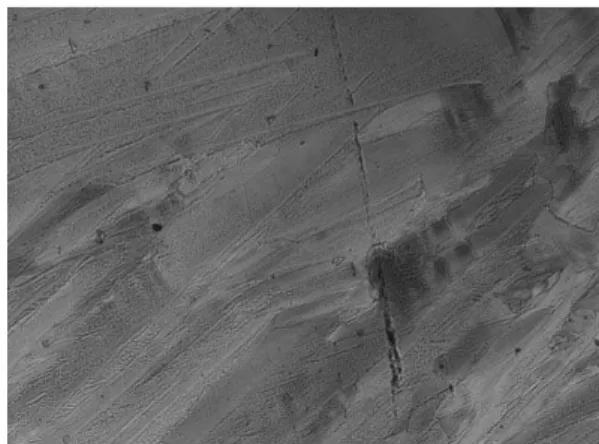
The observed phase variants, transition temperatures and cor-responding enthalpy values obtained by thermal microscopy, dielectric studies and DSC are presented in table 1. The com-pounds of the present inter hydrogen bonded series are found to exhibit characteristic textures [13], viz., smooth mosaic texture in Smectic G as depicted in plate 1 and broken focal-conic texture in smectic F phase The smectic F phase with monoclinic symmetry [1], and long range tilt order, possess-ing a hexagonal molecular packpossess-ing with in the smectic lay-ers (normal to the long axis of the molecules), has a quasi 2-dimentional solid structure (i.e. poor correlation between layers).
the phase transition temperatures observed by thermal mi-croscopy are found to be in good agreement with those ob-tained from DSC and optical textural studies (table 1).
Compound Phase Transition TM (oC)
DSC
16A+11BA
Isotropic – Sm F 79.12 78.92 (2.18) Sm F- Sm G 74.92 74.52 (5.41)
Sm G- Crystal 46.81 46.28 (37.68)
16A+12BA
Isotropic – Sm G
84.54 84.04 (7.78)
Sm G – Crystal
43.91 43.24 (143)
Table 1 - Transition temperatures (inoC) obtained from thermal
microscopy (TM) and DSC of complexes in the cooling run. Corresponding enthalpy values (in J/g) are given in parenthesis.
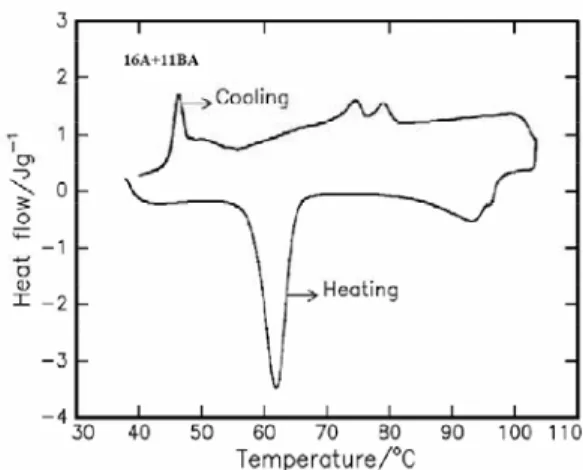
Selection of Thermal Range of Crystallization Temperatures
The procedure for the thermal selectivity for the crystal-lization temperatures (CT) is described for 16A+11BA and its DSC thermograms are illustrated in figure 4. The compound 16A+11BA is taken as a representative member of the present work , it exhibits three distinct transition in the cooling run viz., isotropic to smectic F at 78.92oC, smectic F to smectic G at 74.52oC and smectic G to crystal at 46.28oC with heat of transition 2.18 J/g, 5.41 J/g and 37.68 J/g, respectively. From this data it is inferred that the thermal span of meso-morphic phase as(TIso−SmF,)−(TSmG−Cry)is 32.64oC. Once theTIso−SmF is completed the kinetics of crystallization from smectic G could be investigated over a temperature range be-tweenTSmG−Cry. Provided if the crystallization kinetics are not too fast.
Crystallization Kinetics through DSC
The crystallization kinetics of 16A+11BA relating to the phase transition from Smectic G to the melt is selectively performed at each predetermined crystallization temperatures viz 70oC, 60oC, 57oC and 50oC respectively. The sample is held at 70oC for different time intervals (0.1 to 12 minutes). The heating curve with a crystallization time of t = 0 min is recorded immediately following the quenching of the crystal to melt, at crystallization temperature 70oC.
The enthalpy values for individual transitions at different time intervals are calculated at each crystallization tempera-ture, and the data plotted against the corresponding logarithm of time intervals for each member of the series. A plot of heats of melting of the mesomorphic phase, viz. the log of annealing time for different crystallization temperatures of
FIG. 4: DSC thermogram of 16A+11BA
16A+12BA is depicted in figure 5 These plots have an iden-tical shape, apart from the shift in the log t axis suggesting the limitations of the rate of crystallization kinetics [14,15]. Furthermore, simultaneous measurement of the heats of melt-ing of the smectic G endotherm with time shows, without ambiguity, that the affective beginning and end of the crys-tal formation process is uniform and unaltered. Such a master curve strongly suggests that the same mechanism operates for crystallization from the smectic G to crystal for both the com-plexes. As expected [14,15], the overall crystallization rate is controlled by a nucleation rate influencing the rate of growth of domains; this is a function of the degree of super cooling and the starting smectic mesophase.
FIG. 5: Master curve of 16A+12BA
calcu-FIG. 6: Linear graphs between -ln(ln(1-x)) and ln(t) for various CT‘s of 16A+12BA complex
lated using (2) described in the forthcoming sections.
Electrical studies Thermal studies
Dielectric studies (500Hz) Differential Scanning
Calorimetry (ǻH) Permittivity (İ’) Dielectric loss (İ”)
Sample CT /oC
t*/sec n b t*/sec n b t*/sec n b
50 3.60 0.66 0.429 50.3 0.276 0.339 224.5 0.162 0.416
57
3.19 0.53 0.540 128.2 0.194 0.390 302.7 0.139 0.452
60 2.70 0.48 0.620 3.06 0.615 0.502 1.845 0.656 0.669 16A+11BA
70 1.04 1.37 0.930 0.95 0.376 1.020 2.25 0.353 0.751
45 4.18 0.837 0.302 28.79 0.512 0.179 424.44 0.318 0.146
46 1.63 1.272 0.535 3.34 0.859 0.354 15.16 0.567 0.214 16A+12BA
48 1.09 1.237 0.899 3.97 0.709 0.376 5.50 0.677 0.315
Table 2 - Measured crystallization parameters for 63.2% transformation from the various smectic mesophases to the
crystalline phase of the inter hydrogen bonded complexes experimentally obtained by thermal and electrical studies.
Characteristic time is denoted by t*
Crystallization Kinetics through Dielectric Studies
It was earlier proposed by us [10] that the crystallization kinetics can also be studied and analyzed at a selected fre-quency with the dielectric data. The crystallization kinetics relating to the phase transition from Smectic G to the melt of 16A+11BA is selectively performed at same predetermined crystallization temperatures viz., 70oC, 60oC, 57oC and 50oC respectively at an excitation frequency of 500 Hz. The sam-ple is held at 57oC for different time intervals (0.1 to 12 min-utes). The dielectric data (capacitance and dielectric loss) at 500 Hz excitation frequency with a crystallization time of t = 0 to 10 min are recorded immediately following the quench-ing of the crystal to melt, at crystallization temperature 57oC. The capacitance and dielectric loss values for individual tran-sitions at different time intervals are noted at each crystalliza-tion temperature, and the corresponding data plotted against
the logarithm of time intervals for other member of series. The Avrami exponent b are obtained for dielectric studies (ε’
andε”) and DSC(∆H)as a function of crystallization
tem-peratures for the complexes 16A+11BA and 16A+12BA are depicted in figure 7. From the figure 7 it can be inferred that the growth mechanism follows a uniform trend for all the temperature studied in the present compounds. Further more, crystallization kinetics data obtained by this technique for 16A+12BA compound at 45oC, 46oC and 48oC are iden-tical to those data obtained by DSC studies suggesting the existence of the same mechanism in the rate of crystallization kinetics [6].
FIG. 7: The Avrami exponentb obtained by dielectric studies (ε’ andε”) and DSC(∆H)as a function of CT‘s for 16A+11BA and 16A+12BA Complexes.
The Process of Crystallization
In, general, the kinetics of crystallization involving the rate of growth of small domains in a smectic phase is manifested equally by its temperature and time. Temperature dependence of nucleation, taking place as a homogenous process over a constant period of time leads to the phenomenon of sporadic growth. In addition, defects and impurities in the compound have a pronounce influence on the nucleation process [15]. Further contributions from solid state transformations, where growth occurs only at the surface of the nuclei, hampers the overall rate of phase transformation and the dimensional ge-ometry of the growing domains.
It is well known that the crystallization process involving the fraction of the transformed volume x, at a time t measured since the beginning of the crystallization process, is described by Avrami equation [2,3]
ln(−ln(1−x)) =Inb+nln(t) (1) where the constant b and n depend on the nucleation mech-anism and the dimensionality geometry of the growing do-mains, respectively. The transformed volume x at a crystal-lization time t is given by ∆H/∆Ho where∆H is the
crys-tal heat of melt measured at time t and∆Hois the maximum
∆ε′/∆ε′
oand∆ε′/ε′′owhere∆ε’ and∆ε” are the values of ca-pacitance and dielectric loss at time t and∆ε′
o ,∆ε′′o are the maximum value obtained from the plateau of the individual master curves.
If the kinetics of the crystallization from the corresponding smectic phases are described by above Avrami equation, the data for all the crystallization temperatures can be applied to the single equation [2,3] described above.
x=1−exp[−(t/t∗)n] (2) where t* = b-1/n
It is found from the experimental data that the constant n which manifests the dimensional geometry of the growing do-mains is almost unaltered while the magnitude of the constant b, which governs the nucleation mechanism, varies for the compounds studied. Figures 8 and 9 depict the endotherm profiles of 16A+11BA at various holding times pertaining to different crystallization temperatures. The data of constants n and b experimentally obtained by DSC and dielectric studies (capacitance and dielectric loss) for various specified crystal-lization temperatures of 16A+11BA and 16A+12BA are tab-ulated in the table 2.
FIG. 8: DSC heating curves for 16A+12BA at 45oC for different time intervals.
FIG. 9: DSC heating curves for 16A+12BA at 48oC for different time intervals.
The trend of the magnitude of the two constants n and b are found to be in agreement with the data reported for discotic [15] and smectic [7] mesophases. The variation of the magni-tude of n in both the compounds is attributed to the sporadic nucleation and growth in two dimensions.
Plate 1 - Texture of smectic G phase as observed in 16A+12BA at 60oC with a magnification of 10x
Influence of Tilted (Smectic G) Phase Variance on Crystallization Kinetics
The phase sequence in liquid crystal molecules has a pro-nounced influence on their crystallization kinetics. The kineto phase which occurs prior to the crystallization is solely re-sponsible for many combinational factors of the crystalliza-tion mechanism. In the present study of 16A+11BA and 16A+12BA complexes the kineto phase prior to crystalliza-tion is Smectic G. Our previous studies [5, 6, 10, 11] on different nO.m compounds exhibiting various kineto phases concurred with data of the present investigations. Further in Smectic G, as expected, the rate of crystallization is rapid as it is close to crystalline phase. It is a known fact that crys-tallization kinetics will be fast for the cryscrys-tallization temper-atures (CT) near to crystal and slow when the CT is near the isotropic melt.
Influence of Alkoxy Carbons
time t* is in accordance with equation (1) which strongly im-plies the completion of crystallization process.
Conclusions
1. For the first time in the history of crystallization studies, crystallization kinetics data is experimentally elicited from a novel dielectric technique. Though the magnitude of the Avrami exponent b obtained by both these techniques varies considerably, we claim that the trend of the crystallization kinetics result by this new technique is similar to that of the traditional thermal analysis.
2. In titled ordering (Smectic G) the formation of an or-dered domain occurs which converts to a stable nu-cleus that initiates the aggregation of the surrounding molecules to form layered domains. The origin of this nucleus is critical since its formation proceeds until it reaches a sufficient size to initiate the crystallization process.
3. Further, we propose that this process of crystallization is controlled by either the lamellar or inter layer dis-tances in tilted (Smectic G) kineto phase. In such a pro-cess of seed nucleation, factors relating to the smectic layer play an important role. A particular molecule in the lower smectic layer first acquires the requisite
en-ergy to allow the formation of ordered domains, which in turn propagate crystallization to the adjacent smec-tic layers. These ordered domains will further proceed through the smectic layers by a process of successive addition of the molecules from neighboring layers lead-ing to sporadic nucleation and growth in two dimen-sions. This process continues until the crystallization is completed.
4. The nucleation mechanism is found to be uniform in all the crystallization temperatures of both the hydrogen bonded mesogens studied. This is manifested in the figure 7, where Avrami exponent b is plotted against crystallization temperature. Further in both the process of dielectric studies (ε’ andε”) the slope of the above
curve is almost identical indicating the same type of mechanism is involved in the nucleation process.
Acknowledgements
The authors thank the Management of Bannari Amman In-stitute of Technology for providing the laboratory and other infrastructural facilities. One of the authors (MLNMM) ac-knowledges the financial support provided by Department of Science and Technology, New Delhi, All India Council of Technical Education, New Delhi and Defence Research De-velopment Organization, New Delhi.
[1] D. Demus (1994)Liquid Crystals: Phase Types Structures and Chemistry of Liquid Crystals,Springer, New York.
[2] M. Avrami, J.Chem. Phy,7,1103 (1939). [3] M. Avrami, J.Chem. Phys.8,212 (1940).
[4] M.L.N. Madhu Mohan, B. Arunachalam, C.R. Aravind Sankar, Met. Mat. Trans. A,39,1192 (2008).
[5] M.L.N. Madhu Mohan, B. Arunachalam, Z.Naturforsch,63a,
435 (2008).
[6] P.A. Kumar, M.L.N. Madhu Mohan and V.G.K.M. Pisipati, Liq. Cryst,27, 727 (2000) ; T Chitravel, M.L.N. Madhu Mo-han, and V Krishnakumar, Z.Naturforsch64a,341 (2008). [7] V.G.K.M. Pisipati, P.A. Kumar and M.L.N. Madhu Mohan,
Mol. Cryst. Liq. Cryst.350, 141 (2000).
[8] M.L.N. Madhu Mohan P.A. Kumar and V.G.K.M. Pisipati, Mol. Cryst. Liq. Cryst.366,431 (2001).
[9] P.A. Kumar, M.L.N. Madhu Mohan, and V.G.K.M. Pisipati,
Mol. Cryst. Liq. Cryst.325,127 (1998).
[10] T Chitravel, M.L.N. Madhu Mohan, and V Krishnakumar Mol. Cryst. Liq. Cryst.493,17 (2008) ; M.L.N. Madhu Mohan, Ro-manian J. Phys. (Accepted for publication) (2009).
[11] T Chitravel, M.L.N. Madhu Mohan, and V Krishnakumar, Physica B: Cond.Matter404,1310. (2009).
[12] K. Nakamoto (1978)Infrared and Raman Spectra of Inorganic and Co-ordination Compounds, 4th Ed., Interscience, New York.
[13] G.W.Gray, and. J.W.G. Goodby (1984)Smectic Liquid Crystals - Textures and Structures, Leonard Hill, London.
[14] P.A. Kumar, P. Swathi, V.G.K.M .Pisipati, Ch. Srinivasu and P.N. Murty Liq. Cryst.29,967 (2002).