J. of the Braz. Soc. of Mech. Sci. & Eng. Copyright 2008 by ABCM April-June 2008, Vol. XXX, No. 2 / 139 !
! " #
!
" $ "
#
!
" $ "
#
!
! " #
The present work is an attempt to study the role of emulsifier on the effectiveness of cutting fluids. Cutting tests have been carried out and influence on different parameters is estimated. A mathematical model is proposed to estimate the influences of emulsifier content on tool wear.
Keywords: metal cutting, cutting fluids, emulsifier, tool wear
Introduction
1Study of the effectiveness of cutting fluids has always been of
interest to the researchers. Studies are conducted to estimate the cooling and lubricating effects of the fluids and their impact on the work piece. In a turning operation, the maximum amount of heat generated in the cutting zone is carried away by chip and the minimum amount of heat is carried away by workpiece, tool and cutting fluid, if used (Yerkes and Dorian, 1999). In the absence of cutting fluid, the heat carried away from the cutting zone is decreased, resulting in an increase in tool and workpiece temperature (Chiou et al, 2003). The elevated cutting zone temperature significantly shortens the tool life, contributes to thermal distortion and poor dimensional accuracy and promotes the formation of built-up edge (BUE) on the tool tip (Ko et al, 1999) (Chou, 1999).
Motta and Machado (1995) concluded that the cost of cutting fluids in machining is justified by the returns obtained in the form of savings through enhanced tool life and economic consumption of energy. Minke (1999) pointed out that cutting fluids play a decisive role in maintaining the quality of the work piece. The fluids lubricate the tool in addition to acting as a coolant. Baradie (1996) reported the increase of grinding wheel life and improvement in surface texture with effective application of cutting fluids. Improvement in dimensional accuracy and energy conservation are reported. Adoslav Raki and Zlata Raki (2002) studied the influence of cutting fluids on the failure of machine tools. The investigations were carried out on 30 lathes in four different time peroids. The obtained results indicated that water based metal working fluids have a great influence on tribological processes, wear and failures of tribo-mechanical system. Wang and Kou (1997) studied the effectiveness of cutting fluid as a coolant in grinding. The results reveal that water has higher cooling effectiveness than oil. In addition, the cooling
Paper accepted February, 2008. Technical Editor: Anselmo Eduardo Diniz.
effect of the grinding fluid becomes more significant at lower workpiece speed, higher grinding depth and greater wheel speed.
Tsao (2000) studied the effect of sulfurous boric acid ester in milling, in which tool wear was observed to decrease with the addition of the ester. Though the effect of the cutting fluids is much fluid. The present work is an attempt to study the effect of emulsifier content on the machining parameters and to arrive at a logical decision on the composition of cutting fluid.
cutting fluid condition, workpiece temperatures and drill geometry were examined. The results indicated that the cutting fluid does have an effect on the surface finish, and that the cutting fluid interacts with other variables to have an effect on hole quality.
In addition to the effect on the surface finish, the cutting fluids are also known to influence the hardness of the machined surface. At high temperatures of machining, the fluids act as quenching medium and thus harden the work piece. Gedberg et al (1987) compared two different emulsions as quenching medium. Results indicated that the emulsion with higher cooling capacity or thermal conductivity had better quenching abilities. Soshko (1991) investigated the influence of polymer component in cutting fluids on the surface of machined component. The results showed that the relationship of micro-hardness of the steel specimens to depth in machining in the polymer fluid has a more complex character than in oil or water. Surface roughness was also measured and it was reported that surface roughness was always lesser in cases of increased hardness. Though the significance of the various properties of the cutting fluids and the consequence of the usage of the fluids is well recognized, not much work is reported on the influence of the composition of the fluids in determining their effectiveness.
The introduction should contain information intended for all readers of the journal, not just specialists in its area. It should describe the problem statement, its relevance, significant results and conclusions from prior work and objectives of the present work.
Experimental Set-Up and Experimentation
To examine the influence of the cutting fluids of varying compositions, the fluids are used in turning (machining) of EN-8 steel. The experimental set-up details are given in table 1. The tests are carried out on PSG-124 lathe with H.S.S and carbide tools of similar tool signature. The cutting parameters are selected according to the tool supplier’s recommendation for tool and work piece combination as
Average cutting speed = 102 m/min Feed range = 0.4396 mm/rev Depth of cut = 0.5 mm.
Cutting tests are conducted employing the formulated fluids, water as coolant and in dry conditions. For this purpose, cemented carbide tool and EN8 steel work piece are selected. The cutting tests are performed on PSG-124 lathe. The experimental details are presented in Table 1. Cutting velocity and feed rates are selected based on the tool manufacturer’s (Sandvik) recommendations for work-piece material and tool.
Table 1. Experimental conditions.
Work specimen
Material: EN 8 steel (C = 0.36-0.45%, Mn= 0.6-1%, Si= 0.2-0.3%, S = 0.025%, P=0.015%)
Size (mm): Ø50×400 mm Hardness: 30±2 HRC, heat treated
Process parameters
Cutting velocity, V= 110 m/min Feed rate, S= 0.25 mm/rev Depth of cut, t=1.0 mm
Environment: Dry, wet (flood cooling)
Machine tool
Lathe Machine: (PSG Company, INDIA) 10 hp
Cutting tool (insert): Carbide, SNMG 120408 (H-13A ISO specification) Tool holder: PSRNR 12125F09 (ISO specification)
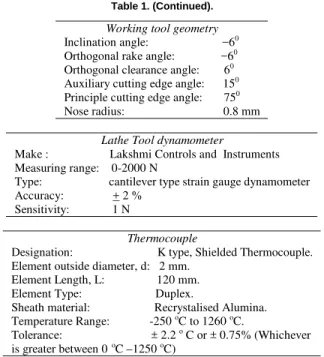
Table 1. (Continued).
Working tool geometry
Inclination angle: −60
Orthogonal rake angle: −60
Orthogonal clearance angle: 60
Auxiliary cutting edge angle: 150
Principle cutting edge angle: 750
Nose radius: 0.8 mm
Lathe Tool dynamometer
Make : Lakshmi Controls and Instruments Measuring range: 0-2000 N
Type: cantilever type strain gauge dynamometer Accuracy: + 2 %
Sensitivity: 1 N
Thermocouple
Designation: K type, Shielded Thermocouple. Element outside diameter, d: 2 mm.
Element Length, L: 120 mm. Element Type: Duplex.
Sheath material: Recrystalised Alumina. Temperature Range: -250 oC to 1260 oC.
Tolerance: ± 2.2 o C or ± 0.75% (Whichever
is greater between 0 oC –1250 oC)
The cutting forces are measured with calibrated strain gauge dynamometer. The tool flank wear is measured off-line at the end of each cut under 30 x magnifications in a profile projector. The temperature is sensed by the K-type thermocouple. A thermocouple is placed at the bottom of the tool insert in the tool holder (Haan et al, 1997) (Gedberg et al 1987). The temperature measured by the thermocouple is only a representative figure for comparison purpose, as this does not measure the cutting zone temperature. Calibration of the thermocouple is carried out in a water bath with a
thermometer and a maximum of 1oC difference is noted over a range
from 40 oC to 95 oC. Tool profile is projected on an optical
projector and is compared with that of the virgin tool to assess the tool wear (Haan et al, 1997) .
With the progress of machining time, tool flank wear, temperature at the bottom of the tool, cutting force, tool flank wear and surface roughness are measured.
Digital temperature indicator is used to record the temperature at the nodal point by an embedded thermocouple located away from the cutting edge since it is difficult to assess the temperature at the tool tip due to chip flow and work interaction with tool. The temperatures are extrapolated to get the tip temperatures. The turning tests are continued till tool wear reaches the limiting criterion of maximum flank wear of 0.6mm.
At different stages of machining, the tool flank wear and surface roughness are measured offline and the corresponding temperature at nodal point and cutting forces are recorded (Haan et al, 1997). An optical projector is used to measure the tool flank wear with magnification of X50 and surface roughness is measured using a portable Surface Roughness Tester (Make: Mitutoyo. Japan). Hardness of the samples is measured using a micro hardness tester (Make: Leitz, Germany) (ASTM Standard E384-08, 2004).
As thermal conductivity of the fluids is shown to have an influence on their quenching ability (Soshko, 1991), it was determined using standard Hot-Plate method (ASTM Standard C177-04, 2005). As a validation for the results obtained through turning test, Jominy End Quench test (Avner, 1998) has been carried out using the cutting fluids as quenching media.
Results and Discussions
J. of the Braz. Soc. of Mech. Sci. & Eng. Copyright 2008 by ABCM April-June 2008, Vol. XXX, No. 2 / 141
cutting fluid (ii) with water and (iii) with cutting fluid with varying emulsifier content are plotted. It was observed that nodal temperatures decrease with increase in emulsifier content but not much change is observed beyond 15% of emulsifier. This maybe attributed to the results observed in thermal conductivity measurements (Nageswara Rao and Srikant, 2006). Thermal conductivity of the fluids increases with emulsifier content but less rapidly after 15%.
As the contact between the tool and the work-piece is a single point, where the cutting fluid cannot reach, the cutting tip temperature is constant in all the cases; however the nodal temperatures change due to different thermal conductivities of the fluids. In case of dry cutting, the heat transfer coefficient is taken as
60 W/m2-K and the cutting tip temperatures are estimated
extrapolating the nodal temperatures recorded. Tip temperatures are assumed to be in the range of 200o Cto 1200oC. At the assumed tip temperature, nodal temperature is estimated using ANSYS 5.4. Corresponding tip temperature for recorded nodal temperature is estimated. The estimated tool tip temperatures are presented in Fig.3. 20 30 40 50 60 70 80 90 100
0 10 20 30 40 50 60 70
Machining Time, mins
N o da l Te m p e ra tur e , 0C Dry Water 5% 10% 15% 20% 25%
Figure 1. Recorded nodal temperatures for H.S.S Tool.
0 20 40 60 80 100 120 140 160 180
0 10 20 30 40 50 60 70
Machining Time, mins
N o d a l T e m p e ra tu re ,
0C Dry
Water 5% 10% 15% 20% 25%
Figure 2. Recorded nodal temperatures for cemented carbide tool.
300 400 500 600 700 800 900
0 10 20 30 40 50 60 Machining Time, mins
T o o l T ip T e m p e ra tu re , 0C HSS Carbide
Figure 3. Extrapolated tool tip temperatures.
Cutting forces are recorded at regular intervals and are presented in Figs 4 and 5. The results indicate that cutting forces decrease considerably with rise in emulsifier content, which may be attributed to the high lubricating action due to increasing viscosity. However, above 15% emulsifier, as the oil content gets low, not much reduction in the cutting forces is observed. Further the findings on kinematic viscosity of the fluids endorse the same (Nageswara Rao and Srikant, 2006). Though the kinematic viscosity of the fluids increases with the emulsifier content, not much increase is observed after 15% content. As kinematic viscosity influences lubrication, cutting forces are affected by it.
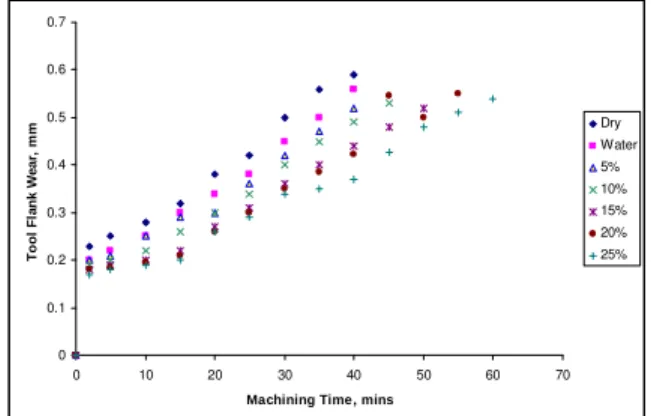
At regular intervals, machining is interrupted and tool flank wear and surface roughness are measured. The progress of tool wear with machining time is shown in Figs 6 and 7. Variation in surface roughness with machining time is plotted in Figs 8 and 9.
Hardness of the samples is determined using Micro-Hardness Tester. The results are shown in Figs.10 and 11.
0 100 200 300 400 500 600 700
0 10 20 30 40 50 60 70
Machining Time, mins
R e s u lt a n t C u tt in g F o rc e , N Dry Water 5% 10% 15% 20% 25%
Figure 4. Variation of cutting force with machining time for H.S.S. tool.
0 100 200 300 400 500 600 700
0 10 20 30 40 50 60 70
Machining Time, mins
R e s u lt a n t C u tt in g F o rc e , N Dry Water 5% 10% 15% 20% 25%
Figure 5. Variation of cutting force with machining time for cemented carbide tool. 0 0.1 0.2 0.3 0.4 0.5 0.6 0.7
0 10 20 30 40 50 60 70 Machining Time, mins
T o o l F la n k W e a r, m m Dry Water 5% 10% 15% 20% 25%
0 0.1 0.2 0.3 0.4 0.5 0.6 0.7
0 10 20 30 40 50 60 70 Machining Time, mins
T
o
o
l
F
la
n
k
W
e
a
r,
m
m Dry
Water 5% 10% 15% 20% 25%
Figure 7. Progress of tool flank wear with machining time for cemented carbide tool.
10 11 12 13 14 15 16
0 5 10 15 20 25 30 35 Machining Time, mins
S
u
rf
a
c
e
R
o
u
g
h
n
e
s
s
,
M
ic
ro
m
ts
Dry Water 5% 10% 15% 20% 25%
Figure 8. Variation of surface roughness with machining time while using H.S.S tool.
6 7 8 9 10 11 12
0 5 10 15 20 25 30 35 Machining Time, mins
S
u
rf
a
c
e
R
o
u
g
h
n
e
s
s
,
m
ic
ro
m
ts
Dry Water 5% 10% 15% 20% 25%
Figure 9. Variation of surface roughness with machining time while using cemented carbide tool.
1600 1800 2000 2200 2400 2600 2800 3000 3200
0 5 10 15 20 25 30 35 Machining Time, mins
H
a
rd
n
e
s
s
,
M
P
a
Dry Water 5% 10% 15% 20% 25%
Figure 10. Hardness of samples machined with H.S.S.tool.
1600 1800 2000 2200 2400 2600 2800 3000 3200
0 5 10 15 20 25 30 35 Machining TIme, mins
H
a
rd
n
e
s
s
,
M
P
a
Dry Water 5% 10% 15% 20% 25%
Figure 11. Hardness of samples machined with carbide tool.
It can be observed that tool wear and surface roughness decrease with increase in emulsifier content, however, not much change is observed above 15% emulsifier. The improved tool life and surface finish with increase in emulsifier content may be due to the reduced cutting forces and increased heat transfer rates.Variation in hardness of the samples with progress in machining time is more in case of samples machined using Carbide tool compared to H.S.S tool, the reason being higher tool tip temperatures generated in carbide tool. However in both cases, samples machined using different cutting fluids vary significantly in terms of hardness. Though hardness variations are observed the metallurgical structure of the samples is consistent (Fig. 12 and 13).
Figure 12. Structure of sample machined with H.S.S. tool.
J. of the Braz. Soc. of Mech. Sci. & Eng. Copyright 2008 by ABCM April-June 2008, Vol. XXX, No. 2 / 143
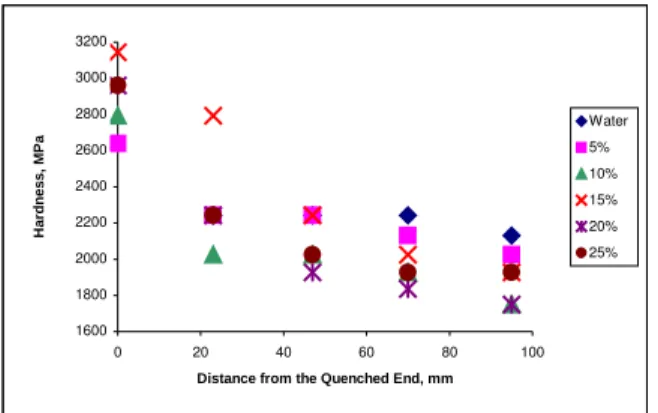
To validate the findings, Jominy-End Test is carried out. Hardness is estimated at different depths of the specimen. The results are presented in Fig. 14. It can be observed that the results are synonymous with the results obtained in machined samples; i.e at the quenched end, the hardness of the sample is proportional to the emulsifier content.
1600 1800 2000 2200 2400 2600 2800 3000 3200
0 20 40 60 80 100
Distance from the Quenched End, mm
H
a
rd
n
e
s
s
,
M
P
a
Water
5%
10%
15%
20%
25%
Figure 14. Results from jominy-end quench test.
Mathematical Model
A mathematical model is proposed to estimate the influence of emulsifier content on various observable parameters. Jominy End Quench test results can be used to estimate the hardness of the quenched end of the test bar (which simulates the application of cutting fluids in a facing operation). A correlation can be drawn between the hardness at the end and thermal conductivity of the corresponding fluid used as a quenchent as represented in Eqn.1. (Fig.15). Similarly, a relation is drawn between thermal conductivity of the fluids and emulsifier content as shown in Eqn 2 (Fig.16).
H=-0.021k2 + 14.844k+534.21 (1)
k = 8.4052* e + 176.6 (2)
where,
H represents the Hardness of Quenched End, MPa k represents the thermal conductivity, W/m-0C
e represents the emulsifier content in the cutting fluid, % Hardness predicted using the above two equations is compared with the values obtained from the Jominy test (Fig.17). It is interesting to note that predictions for machined samples using carbide tool show better agreement than those machined with HSS tool, obviously due to the higher temperatures produced and proximity to the test conditions.
y = -0.021x2
+ 14.844x + 534.21 R2 = 0.9918
2750 2800 2850 2900 2950 3000 3050 3100 3150 3200
0 50 100 150 200 250 300 350 400 450 Thermal Conductivity, W/m-K
H
a
rd
n
e
s
s
,
M
P
a
Figure 15. Variation of Hardness of Quenched End with Thermal Conductivity.
y = 8,4052x + 176,6 R2 = 0,9734
200 250 300 350 400
0 5 10 15 20 25 30
Emulsifier Content, %
T
h
e
rm
a
l
C
o
n
d
u
c
ti
v
it
y
,
W
/m
-K
Figure 16. Variation of Thermal Conductivity with Emulsifier content.
1600 1800 2000 2200 2400 2600 2800 3000 3200
0 5 10 15 20 25 30 Emulsifier Content, %
H
a
rd
n
e
s
s
,
M
P
a
Predicted HSS Cemented Carbide
Figure 17. Comparison of Predicted and Measured Hardness values.
To simplify the model for tool wear prediction, dimensional analysis is carried out and the following four non-dimensional Π -terms are deduced.
Π1= υ * t/ s2 (3)
Π2= (υ * f) / (s2 * k * T) (4)
Π3= w/ (5)
Π4=( υ * H) /(k * T) (6)
where, υ = Kinematic Viscosity, stokes s = Surface Roughness, microns
k = Thermal Conductivity, kW/m-0C
f = Resultant Cutting Force, N w = Tool Flank Wear, mm t = Machining Time, mins T = Nodal temperature, 0C
Since relation between the different parameters is inherently non-linear, the natural logarithms of Π terms are considered for regression analysis. All the different cases (different emulsifier contents & tools) are considered and equations are deduced. The obtained relations are of the form:
Π3 = K1ΠaΠbΠc (7)
where a,b,c,K1 are constants dependent on different cutting
parameters. An average Regression coefficient of 0.75 is obtained. For the present set of conditions, the values are:
K1= 0.277
c= 0.669 (8)
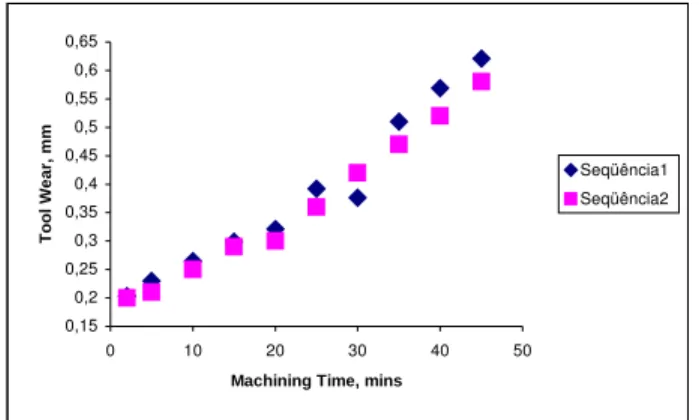
Equations 1, 2, 7 and 8 are used to predict the value of tool wear from different parameters. As an example, comparison of predicted and measured values for machining with carbide tool and 15% emulsifier is shown in Fig.18. Fig.19 shows the percentage error of predicted values from the model. It may be observed that errors obtained are less than 10%. Thus the model stands validated and as an effective tool to estimate tool wear.
0,15 0,2 0,25 0,3 0,35 0,4 0,45 0,5 0,55 0,6 0,65
0 10 20 30 40 50
Machining Time, mins
T
o
o
l
W
e
a
r,
m
m
Seqüência1 Seqüência2
Figure 18. Validation of Proposed Model.
-15 -10 -5 0 5 10 15
0 0,1 0,2 0,3 0,4 0,5 0,6 0,7
Tool Wear, mm
E
rr
o
r,
%
Figure 19. Percentage Errors of Predicted Values.
Conclusions and Scope of Future Work
1. Better lubricating properties and thus lesser Cutting forces are observed for 15 % emulsifier content.
2. Content of emulsifier in the cutting fluid highly influences the surface of the machined component.
3. Hardness of the machined samples is found to vary with the content of emulsifier in the cutting fluid.
4. Though improved properties are observed for higher contents of emulsifier, not much change is observed beyond 15%. 5. Multiple regression model serves as an aide in prediction of
tool wear based on content of emulsifier. The proposed model predicts tool wear with reasonable accuracy.
6. Work may be carried out varying the content of other constituents like water, base oil, etc.
Acknowledgements
The authors would like to express their gratitude to M/s United Petroleum Corporation, Mumbai, India for providing the emulsifier of consistent quality, free of cost.
The authors would like to acknowledge the support extended by Department of Metallurgy, Andhra University, Departments of Mechanical Engineering and Chemical Engineering, Gayathri Vidya Parishad College of Engineering, Department of Industrial Production Engineering, College of Engineering, GITAM, Visakhapatnam, India and Department of Mechanical Engineering, Regency Institute of Technology, Yanam, India in providing the facilities to carry out the experiments.
References
Adoslav Raki, A. and Zlata Raki, B, 2002, “The influence of the metal working fluids on machine tool failures”, Wear, Vol. 252, No. 5-6, pp. 438-444.
Alves, A. S. M. and Oliveira, J. F. G., 2006, “Development of new cutting fluid for grinding process adjusting mechanical performance and environmental impact”, Journal of Materials Processing Technology, Vol. 179, No. 1-3, pp. 185-189.
ASTM Standard C177-04, 2005, “Test Method for Steady-State Heat Flux Measurements and Thermal Transmission Properties by Means of the Guarded-Hot-Plate Apparatus”, In: ASTM Book of Standards, Vol. 04.06, Construction, Thermal Insulation, Environmental Accoustics.
ASTM Standard E384-08, 2004, “Standard Test Method for Microindentation Hardness of Materials”. In: ASTM Book of Standards, Vol. 03.01 Metals Test Methods and Analytical Procedures: Metals - Mechanical Testing; Elevated and Low-Temperature Tests; Metallography, (ASTM International, Philadelphia, Pennsylvania).
Avner, S. H., 1998, “Introduction to Physical Metallurgy”, 2nd Edition,
Tata McGraw-Hill Publishing Company Limited, NewDelhi, pp. 297-302. Baradie, M. A. E. I., 1996, “Cutting fluids: Part I. Characterization”, J. of Material Processing Technology, Ireland, No..56, pp. 786-787.
Bianchi, E. C.; Franzo, C. G.; De Aguiar, P. R. and Catai, R. E, 2004, “Analysis of the influence of infeed rate and cutting fluid on cylindrical grinding processes using a conventional wheel”, J. Materials Research, Vol.7, No.3, pp. 385-392.
Chiou, R.Y.; Chen, J. S. J.; Lu, L. and North, M. T., 2003, “The effect of an embedded heat pipe in a cutting tool on temperature and wear”, Proceedings of ASME Conference on Mechanical Engineering, pp. 1–8.
Chou, Y. K., 1999, “Hard turning of M50 steel with different micro structures in continuous and intermittent cutting”, Wear, Vol. 255, pp. 1388– 1394.
Gedberg, M. G.; Kononov, V. Z. and Makarov, V. N, 1987,“Properties of a water-oil emulsion used as a quenching medium”, Journal of Metal Science and Heat Treatment, Vol. 29, No. 5, pp. 392-395.
Haan, D. M.; Batzer, S. A.; Olson, W. W. and Sutherland, J. W., 1997, “An experimental study of cutting fluid effects in drilling”, Journal of Materials Processing Technology, Vol. 71, No. 2 , pp. 305-313.
Ko, T.L.; Kim, H. S. and Chung, B. G., 1999, “Air-oil cooling method for turning of hardened material”, Int J Adv Manuf Technology, Vol. 15, No. 7, pp. 470–477.
Minke, E., 1999, “Contribution to the Role of Coolants on Grinding Process and Work Results”, 3rd International Machining and Grinding
Conference, Cincinnati, Ohio.
Motta, M. F. and Machado, A. R, 1995, “Cutting Fluids: types, functions, selection, application methods and maintenance”, Machines and Metals Magazine, Brazil, pp 44-56.
Nageswara Rao, D. and Srikant. R. R, 2006, “Influence of emulsifier content on cutting fluid properties”, Journal of Engineering Manufacture, ,
Proceedings of IMechE, Vol. 220, Part B, pp. 1803-1806.
Radoslav Raki, A. and Zlata Raki, B., 2002, “Tribological aspects of the choice of metalworking fluid in cutting processes”, Journal of Materials Processing Technology , Vol. 124, No. 1-2 , pp. 25-31.
Soshko, V. A., 1991, “The condition of a metal surface after machining with use of cutting fluids”, Journal of Materials Science, Vol. 26, No. 5, pp. 603-604.
Tsao, C. C., 2000, “Study on tool life and surface roughness in milling aluminum alloys using sulfurous boric acid ester cutting fluids by Taguchi method”, Proceedings of the 17th Conference CSME 4, pp. 425–428.
Wang, S-B. and Kou, H-S., 1997, “Cooling Effectiveness of Cutting Fluid in Creep Feed Grinding”, Intern. Communications in Heat and Mass Transfer, Vol. 24, No. 6 , pp. 771-783