Article
Printed in Brazil - ©2016 Sociedade Brasileira de Química0103 - 5053 $6.00+0.00*e-mail: [email protected]; [email protected]
On-line Green Solid Phase Extraction of Trace Rare Earth Elements and Uranium
in Environmental Samples and ICP OES Detection
Naeemeh Zari,a Jalal Hassan,*,b Kourosh Tabar-Heydara and Seyyed H. Ahmadia
aEnvironmental Chemistry and Green Technology Department, Chemistry and Chemical
Engineering Research Center of Iran, 14335-186 Tehran, Iran
bDivision of Toxicology, Department of Basic Sciences, Faculty of Veterinary Medicine,
University of Tehran, Tehran, Iran
An on-line solid phase extraction (SPE) method using mini column packed with natural sorbent based on cotton roll dyed by quinalizarin was developed for simultaneously pre-concentration of rare earth elements and uranium at trace levels in environmental samples followed by inductively coupled plasma optical emission spectrometry (ICP OES) determination. Various parameters such as sample and eluent flow rate, sample volume and matrix ions on the method efficiency have been investigated. Under the optimized conditions, the limits of detection (LODs, 3σ) for rare earth elements were in the range of 0.002-0.300 µg L−1 and 0.420 µg L−1 for uranium. The relative
standard deviation (n = 5) were lower than 6% except for samarium and uranium. The method was successfully applied for determination of trace rare earth elements and uranium in lake, well, tap water and carbonate mineral samples. The accuracy of the proposed method was validated by add-found method and direct analysis by ICP OES. This method has some advantages such as simplicity, rapidity, green chemistry and high sensitivity.
Keywords: on-line solid phase extraction, ICP OES, rare earth elements, uranium, quinalizarin
Introduction
Nowadays ground water globally has gained more paramount attention. For the protection and safe use of ground water, it is important to know the origin of water and how it is influenced by the environment. The chemical formulation of waters in the continental crust is determined by water-rock interaction. For inspection of this process fact, the rare earth elements (REEs) can be used as tracers. REEs are also of interest in a wide range of fields in geochemistry including magmatic, hydrothermal and low temperature environments.1-3 These elements are also being widely used
in high technology industries due to their metallurgical, optical and electronic properties.4-7 Rare earth elements
enhance chlorophyll content and improve photosynthetic rate, so they have been applied as plant regulator for crops.8-10 The rising consumption of REEs in different
industries have lead to the great amount discharge of them into the environment. The importance of rare earth elements at mentioned field demands their determination accurately and precisely. Recently, studies for determination of REEs
in natural water samples have increased greatly. Due to low content of REEs in water samples and complexity of matrix (e.g., marine samples) the most common sensitive analytical techniques used, are inductively coupled plasma mass spectrometry (ICP-MS) and inductively coupled plasma optical emission spectrometry (ICP OES).11-17
Although ICP-MS has the detection power to determine traces elements at sub µg L−1, it suffers from the problem
of isobaric polyatomic interferences and its low tolerance to total dissolved solids (TDS). This technique is very expensive; its maintenance is very difficult and inaccessible for much laboratories.18 Low level of rare earth elements
in natural water samples is not compatible with limits of detection (LOD) exhibited by ICP OES technique. Also, ICP OES sometimes encounters problems such as signal suppression and clogging of the introduction system as for dissolved solids in natural samples. For these reasons, there is a demand for pre-concentration and separation of REEs as a group from different matrices before determination. For matrix separation and pre-concentration of REEs, solid phase extraction (SPE) in off-line/on-line mode19-25 has been
co-precipitation27 and cloud point extraction.28 On-line
SPE mode in comparison with off-line mode has greater efficiency, lower consumption of sample and reagent, improved precision and capability of on field sampling.29,30
On-line column pre-concentration systems coupled with ICP OES are based on retention of analytes in mini/ micro column packed with adsorbent that determines the sensitivity and selectivity of the analytical method. The choice of an adsorbent material for SPE can provide simple operation and more flexible working conditions. Many kinds of solid materials for REEs have been reported in the literature.31-34
Quinalizarin (1,2,5,8-tetrahydroxyanthraquinone) is an organic compound which is one of many tetrahydroxyanthraquinone isomers that has been frequently utilized as an analytical reagent in metal ions and pharmaceutical analysis.35,36
Our research group has previously reported an off-line methodology with octadecyl silica gel modified with quinalizarin prior to ICP OES determination of REEs.37
In the present work, a simple on-line procedure for pre-concentration and determination of trace levels REEs and uranium (U) in natural water samples and carbonate mineral by ICP OES is proposed. The mini column is packed with cotton roll dyed by quinalizarin as sorbent material. The operation condition of ICP OES was optimized using experimental design (Box-Behnken)38,39
to get better signal to noise ratio.
Experimental
Instrumentation
Simultaneous ICP OES (Varian 735-ES, Palo Alto, CA, USA) in radial torch configuration equipped with V-groove nebulizer and charge coupled device (CCD) detector was used for elemental analysis. Control of the spectrometer was provided by PC-based ICP Expert II software (Agilent Technologies, Santa Clara, CA, USA). For pH adjustment a Jenway 3510 pH meter (Staffordshire, UK) was used. A four channel peristaltic pump (accompanying ICP OES instrument) and a six-port rotary valve were used for coupling SPE extraction system to ICP OES instrument.
Standard solution and reagents
Working standard solutions by further dilution of stock REEs and U solution (100 µg mL−1; SM 80B-500 VHG
Labs, Manchester, NH, USA) were being prepared to desired concentration daily prior to use. Cotton role was used to prepare the mini column with the dimension of 25 × 4 mm
(length × inner diameter). All solvents and reagents were of highest available purity and at least of analytical grade, in which the presence of REEs and U were not detected.
Mini column preparation
Thirty milligrams of quinalizarin was dissolved in dimethyl sulfoxide (DMSO) and the cotton roll was dyed in prepared solution on heater at temperature of 100 ºC for at least 4 h. Then, it was washed by cold distilled water and dried in an oven. This procedure leads the quinalizarin to be fixed on cotton and the reproducibility of procedure to be guaranteed. This cotton roll was replaced in a sector of an empty cylindrical tube. Finally, the column was connected with polytetrafluoroethylene (PTFE) tubing to a peristaltic pump and rotary valve to form the pre-concentration system.
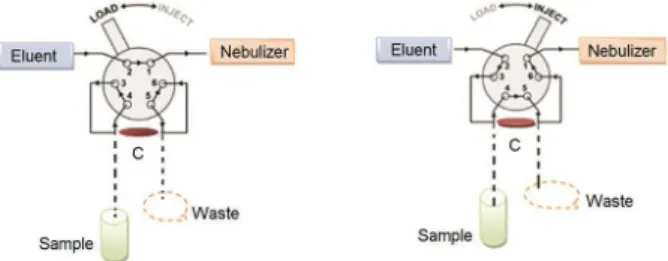
On-line pre-concentration procedure
The schematic of integrated extraction/elution set up is shown in Figure 1.
Before loading the mini column, it was conditioned for pre-concentration with buffer solution (ammonium acetate 0.1 mol L−1) adjusted to pH 7 by 0.1 mol L−1 of hydrochloric
acid or sodium hydroxide. For extraction procedure, 25 mL of aqueous sample solution (100 µg L−1) of REEs and U
(adjusted to desired pH) was loaded on prepared mini column at flow rate of 2 mL min−1 with peristaltic pump
and rotary valve in load position.
Injection step
After loading time, the valve was switched to elution position. The retained REEs and U on the cotton roll were eluted with nitric acid (2 mol L−1) and were directly
introduced to the nebulizer. All the measurements were done as peak height of emission signal. After analyte determination, the injection valve was switched back to loading position and tubing lines were washed by distilled water to eliminate remaining acid.
Result and Discussion
In order to optimize the extraction and pre-concentration conditions, some experimental variables were evaluated and optimized using one at a time approach. Type of eluent and pH were optimized in our off-line previous work.37
Sample flow rate, eluent flow rate, breakthrough volume and interfering elements were studied and optimized in this survey. The optimum instrumental conditions for ICP OES were done by experimental design based on Box-Behnken model. Selected analytical wavelength of REEs and U could be seen in the Supplementary Information (Table S1).
ICP OES optimization parameters
Box-Behnken experimental design was applied to optimize the operating parameters to obtain better sensitivity. The Box-Behnken design (BBD) is an independent quadratic design that does not contain any points at the vertices of the experiment region. The radio frequency of ICP OES (plasma power), nebulizer gas flow rate, sample uptake rate and viewing height were selected as independent variables. Signal to background ratio (SBR) values of REEs were studied as response. Independent variables values are shown in table 1 and the BBD design could be seen in the Supplementary Information (Table S2).
According to the design, each variable was studied at least in 2 levels. The central point was made in 5 replicates adding up to 29 experiments. The experimental data were processed by Design-Expert software version 7.0.40 All
measurements were carried out using a test solution with 1 mg L−1 of La, Nd and Yb. Response was obtained for
geometric mean of results by plotting the mean SBR against radio frequency (RF, plasma power), nebulizer gas flow rate, viewing height and sample uptake rate.
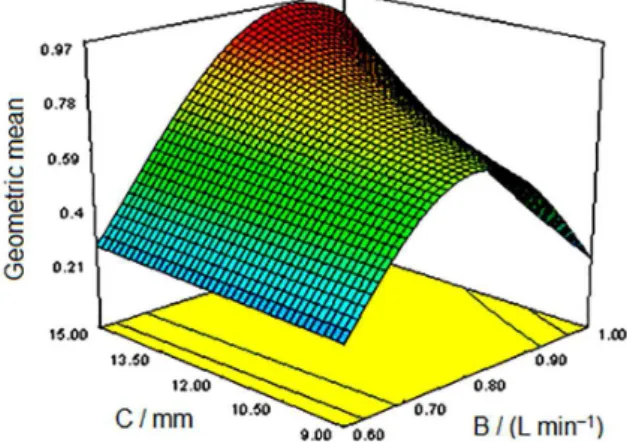
Based on the analysis of variance (ANOVA) results (Table 2), the p-values of these parameters, A = Rf, B = nebulizer flow, C = viewing height, D = sample uptake rate, AB, BC, A2, B2, D2, AB2, B2C, B2D, are less than 0.050
and could be named as significant parameters. Furthermore, the values of different R2, coefficient of variation, standard
deviation and adequate precision, indicated the significance and reliability of the model.
3D response surface plots of AB and BC terms are demonstrated in Figures 2 and 3. Maximum area are clear in the figures (red area).
Plotbased, the optimal conditions of selected factors were attained. So, the RF (plasma power) of 1 kW, viewing height of 15 mm and nebulizer gas flow rate of 0.9 L min−1
were used for instrument parameter analysis. Table 2. Analysis of variance of response
Parameter Value Parameter Value
Standard deviation 0.021 R-squared 0.9928
Mean 0.62 adjusted R-squared 0.9857
Coefficient of variation / % 3.41 predicted R-squared 0.8757
Press 0.11 adequate precision 41.367
Table 1. Independent variable values
Variable − Center point +
Viewing height / mm 9 12 15
Radio frequency (RF, plasma power) / kW 1 1.25 1.5
Nebulizer gas flow rate / (L min−1) 0.6 0.8 1
Sample uptake
rate / (mL min−1) 1 2 3
Figure 3. 3D Response surface plots of BC terms. B: Nebulizer flow rate; C: viewing height.
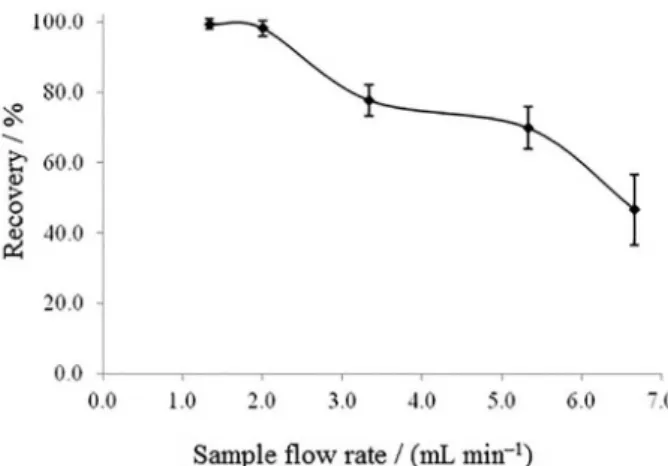
Effect of sample flow rate
In an analytical procedure, analysis time is of great attention. As the sample flow rate through mini columns is one of the steps that controls this time, so this parameter was investigated between 1.3 and 6.6 mL min−1. According
to obtained results (Figure 4), optimal flow rates were in the rage 1.3-2 mL min−1. It was assumed that this
pre-concentration is kinetic dependent.
Effect of concentration and flow rate of eluent
REEs and U desorption were studied by increasing the acid concentration from 0.1 up to 3 mol L−1. Results
were judged based on recovery values. Total desorption was attained at concentration above 1 mol L−1. In order
to get a guaranteed elution, 2 mol L−1 nitric acid solution
was chosen as optimum eluent concentration. Also, the influence of eluent flow rate on cations desorption was examined. This modification was done in the range from 0.6-6.6 mL min−1. Elution flow rate was evaluated in off-line
mode first (2 mL eluent was passed through mini column in different rate). Different rates did not show any differences in emission signals. After that, in on-line mode, results showed that analytical signal of desorbed analytes increased as flow rate increased up to 1.4 to 4.7 mL min−1 due to
peak narrowing and maximum signal to noise (Figure 5). Improper sample introduction at upper flow rate caused decreasing emission signal.
Interference studies
The effect of interfering ions on the recovery of REEs and U up to tolerance level (90%) was studied on 5 µg L−1
of desired analytes under the corresponding optimum
pre-concentration conditions. A number of common anions such as Cl−, Br−, C, P, and S were examined up to
100 µg mL−1 and no interferences were found. The effect of
some base metal cations such as CuII, CdII, CoII, TiII, CrVI,
MnII, FeII, ZnII and NiII, usually found in water samples, was
studied in the range of 1000-5000 folds of desired analyte. The results showed there was not any serious interference on recovery of target analytes. Among alkaline and alkaline earth metal ions (Na+,K+, Ca2+, Mg2+), quinalizarin form
stable complex with Mg2+. It seems that quinalizarin form
more stable complexes with REEs and U than Mg2+ at pH 7,
so no interferences from these common ions were observed in the range of 5000 folds of desired analytes.
Analytical performance
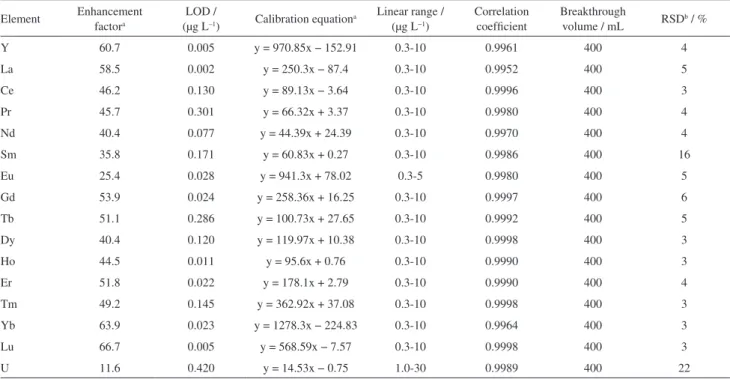
The dependence of REEs and U recoveries on the volume of real sample was evaluated using 25-400 mL of sample solution containing 1.0 µg of desired elements. The breakthrough volumes of 16 elements were 400 mL for various ions (Table 3). The calibration graphs with optimized conditions were obtained using 25 mL of multi elements standard solutions in the range of 0.3-30 µg L−1.
Calibration curves were plotted as emission intensity of extracted analytes against their initial concentration in aqueous phase. Precision of method was evaluated using 5 portions of standard solution of 5 µg L−1. The figure of
merits of proposed method is summarized in table 3. The obtained RSD% values were lower than 6%, except for Sm and U. The enhancement factors (EF) of analytes were calculated as the respect of the slope of calibration curve after pre-concentration to that obtained by direct injection of standard solution of desired elements.
A comparison with the analytical performance of proposed method and some of the published pre-concentration methods for REEs elements were summarized Figure 5. Effect of eluent flow rate on the extraction efficiency. Pre-concentration conditions: 25 mL of 100 µg L−1 of analytes; pH 7; eluent: HNO3 2 mol L−1.
in Table 4. It is obvious that this methodology is comparable with other method and in some cases better LODs and precision.
Analysis of real sample
Certified natural water reference materials are not available for REEs and U.41 Thus, the developed method
was applied to the pre-concentration and determination of spiked REEs and U in lake, well and tap water. All water samples were collected in polyethylene bottles and acidified up to pH = 2 in order to ion metals do not be adsorbed by
wall of bottles. Aqueous standard solutions along blank (25 mL deionized water adjusted pH to 7 by ammonium acetate solution) without matrix optimization were used for calibration and determination of desired elements in samples. The obtained results are presented in Table 5. The Student’s t-test showed that each mini column supports 20 pre-concentration cycles (data are not shown).
As can be seen, for matrix with high major elements concentration (high TDS, Urumieh Lake, Lorestan Well, Table 6), recoveries have been decreased. For routine analysis correction factor or calibration standard solutions with optimized matrix is applicable.
Table 4. Comparison of the proposed method and some of the published pre-concentration methods for rare earth elements (REEs)
Element Technique LOD / (ng mL−1) RSD / % Reference
Pr, Sm, Eu, Gd, Ho, Tb Tm, Yb, Lu, Dy SPE-ICP OES 0.01-0.42 − 25
REE CPE-ICP OES 0.041-0.045 1-6 28
Eu, Gd, Ho, La, Tb, Yb, Sm MWCNT-ICP OES 3-57 < 6 11
REE magnetic-SPE-ICP-MS 0.0004-0.0014 2-7 16
La, Sm, Nd SPE-ICP OES 3.9-7.4 < 3 32
REE on-line-SPE-ICP-MS 0.0004-0.0025 < 8 19
REE MWCNT-ICP-MS 0.0001-0.0016 − 18
Ce, Dy, La, Sm, Y, U on-line-SPE-ICP OES 0.011-0.069 1-8 24
REE, U on-line-SPE-ICP OES 0.002-0.420 3-6,a 22b this study
aREE; bU. CPE: Cloud point extraction; ICP OES: inductively coupled plasma optical emission spectrometry; ICP-MS: inductively coupled plasma mass spectrometry; MWCNT: multi walled carbon nanotube; SPE: solid phase extraction.
Table 3. Figures of merit of the proposed method
Element Enhancement factora
LOD /
(µg L–1) Calibration equationa
Linear range / (µg L−1)
Correlation coefficient
Breakthrough
volume / mL RSDb / %
Y 60.7 0.005 y = 970.85x − 152.91 0.3-10 0.9961 400 4
La 58.5 0.002 y = 250.3x − 87.4 0.3-10 0.9952 400 5
Ce 46.2 0.130 y = 89.13x − 3.64 0.3-10 0.9996 400 3
Pr 45.7 0.301 y = 66.32x + 3.37 0.3-10 0.9980 400 4
Nd 40.4 0.077 y = 44.39x + 24.39 0.3-10 0.9970 400 4
Sm 35.8 0.171 y = 60.83x + 0.27 0.3-10 0.9986 400 16
Eu 25.4 0.028 y = 941.3x + 78.02 0.3-5 0.9980 400 5
Gd 53.9 0.024 y = 258.36x + 16.25 0.3-10 0.9997 400 6
Tb 51.1 0.286 y = 100.73x + 27.65 0.3-10 0.9992 400 5
Dy 40.4 0.120 y = 119.97x + 10.38 0.3-10 0.9998 400 3
Ho 44.5 0.011 y = 95.6x + 0.76 0.3-10 0.9990 400 3
Er 51.8 0.022 y = 178.1x + 2.79 0.3-10 0.9990 400 4
Tm 49.2 0.145 y = 362.92x + 37.08 0.3-10 0.9998 400 3
Yb 63.9 0.023 y = 1278.3x − 224.83 0.3-10 0.9964 400 3
Lu 66.7 0.005 y = 568.59x − 7.57 0.3-10 0.9998 400 3
U 11.6 0.420 y = 14.53x − 0.75 1.0-30 0.9989 400 22
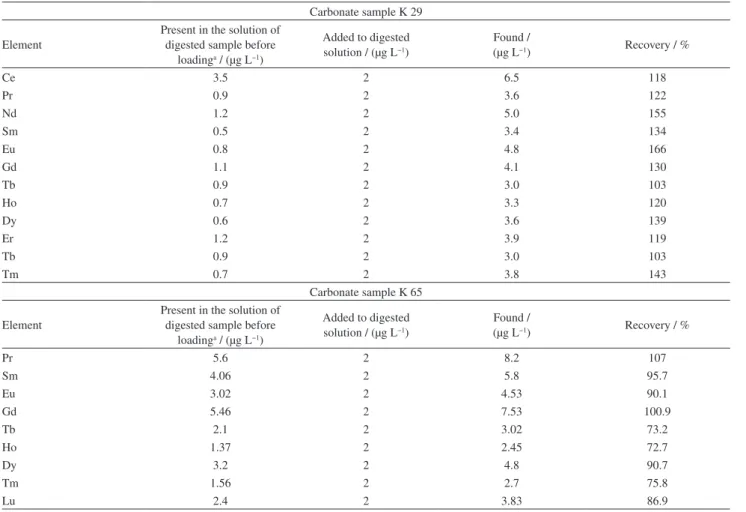
This method was applied for REEs and U determination in two carbonate mineral samples from central Iran zone (Tabas) too. An aliquot of pulverized sample (0.5 g) was digested with aqua regia (HCl:HNO3, 3:1) for 2 h
at 95 °C. The sample was cooled and then diluted up to 50 mL with deionized water. Digested sample with adjusted pH was loaded on mini column in optimized flow rate, and then the adsorbed REEs and U were eluted and analyzed by ICP OES. Recoveries are presented in Table 7.
REEs in some samples were not detected directly by ICP OES. So, 2 µg L−1 of REEs and U standard solution was
Table 6. Urumieh and Lorestan matrix elementsa
Major element Urumieh /
(µg mL−1)
Lorestan / (µg mL−1)
Ca 175.0 10.0
Na 80.0 5.0
K 7.5 0.5
Mg 70.0 10.0
aAnalysed in the Applied Geological Research Center of Iran.
Table 5. Results of rare earth elements (REEs) and uranium (U) determination in natural water samples
Element
Urumieh Lake Lorestan Well Tap water Karaj
Added / (µg L−1)
Found / (µg L−1)
Recovery / %
Added / (µg L−1)
Found / (µg L−1)
Recovery / %
Added / (µg L−1)
Found / (µg L−1)
Recovery / %
Y 20.0 3.3 16 5.0 3.6 73 5.0 5.0 100
La 20.0 13.4 67 5.0 3.4 68 5.0 4.9 98
Ce 20.0 13.9 70 5.0 3.5 70 5.0 4.5 91
Pr 20.0 14.9 75 5.0 3.3 67 5.0 4.6 92
Nd 20.0 14.7 74 5.0 3.9 79 5.0 4.7 94
Sm 20.0 15.1 76 5.0 4.0 80 5.0 4.9 98
Eu 20.0 4.3 22 5.0 4.7 94 5.0 4.8 97
Gd 20.0 14.4 72 5.0 4.0 80 5.0 4.9 98
Tb 20.0 14.3 72 5.0 3.9 77 5.0 5.0 100
Dy 20.0 14.8 74 5.0 3.4 69 5.0 5.1 102
Ho 20.0 14.9 75 5.0 3.8 76 5.0 5.2 105
Er 20.0 15.0 75 5.0 3.9 78 5.0 5.0 100
Tm 20.0 15.0 75 5.0 4.1 81 5.0 5.5 111
Yb 20.0 3.6 18 5.0 4.9 89 5.0 4.7 93
Lu 20.0 14.7 74 5.0 4.1 83 5.0 5.0 100
U 20.0 26.6 133 5.0 5.6 112 5.0 2.8 56
Table 7. Determination of rare earth elements (REEs) ions in carbonate minerals
Element
Carbonate sample K 29 Carbonate sample K 65
Found directly by ICP OESa /
(µg g−1)
Proposed method /
(µg g−1) Recovery / %
Found directly by ICP OES /
(µg g−1)
Proposed method /
(µg g−1) Recovery / %
Y 0.6 0.7 114 7.5 5.5 73
La 1.36 0.9 63 8 7.8 98
Ce < LOD 1.8 − 15 14.5 97
Pr < LOD 0.5 − < LOD 2.8 −
Nd < LOD 1.3 − 6.2 6.5 105
Sm < LOD 0.3 − < LOD 2.0 −
Eu < LOD 0.4 − < LOD 1.51 −
Gd < LOD 0.6 − < LOD 2.7 −
Tb < LOD 0.4 − < LOD 1.1 −
Ho < LOD 0.4 − < LOD 0.7 −
Dy < LOD 0.3 − < LOD 1.6 −
Er 0.6 0.5 84 1.9 1.8 96
Tm < LOD 0.4 − < LOD 1.2 −
Yb 0.4 0.4 95 1.1 1.2 113
Lu < LOD 0.4 − < LOD 1.2 −
U 6.8 3.2 48 8.91 7.3 82
added to the solution of digested sample. The recoveries are demonstrated in Table 8.
Conclusions
The proposed on-line solid phase extraction pre-concentration methodology using a mini column filled with green sorbent based on dyed cotton roll by quinalizarin is a simple way suitable for determination of 14 REEs and uranium simultaneously in real samples. The procedure offers acceptable accuracy, precision and significant enrichment factor. In addition, this procedure is very straightforward, environment friendly and economical since only quinalizarin without any modification was used for REEs and U pre-concentration simultaneously. This method has feasibility for automation. In this procedure extraction, pre-concentration and elution steps are integrated. The results of real samples analysis showed a strong performance for this method for pre-concentration/ determination of the analytes from real aqueous samples and carbonate minerals.
Supplementary Information
Supplementary data are available free of charge at http://jbcs.sbq.org.br as PDF file.
Acknowledgments
The authors of this survey would like to thank the Environmental Chemistry and Green Technology Department of Chemistry and Chemical Engineering Research Center of Iran and ICP OES laboratory in applied geology research center of geological survey of Iran.
References
1. Murakami, M.; Hamanaka, E.; Takada, T.; Anal. Lett. 2005, 38, 2449.
2. U.S. Geological Survey (USGS); Rare Earth Elements-Critical Research for High Technology, Fact Sheet 087-02, USGS: Virginia, 2002.
Table 8. Results of some rare earth elements (REEs) in digested sample by add-found method
Carbonate sample K 29
Element
Present in the solution of digested sample before
loadinga / (µg L−1)
Added to digested solution / (µg L−1)
Found /
(µg L−1) Recovery / %
Ce 3.5 2 6.5 118
Pr 0.9 2 3.6 122
Nd 1.2 2 5.0 155
Sm 0.5 2 3.4 134
Eu 0.8 2 4.8 166
Gd 1.1 2 4.1 130
Tb 0.9 2 3.0 103
Ho 0.7 2 3.3 120
Dy 0.6 2 3.6 139
Er 1.2 2 3.9 119
Tb 0.9 2 3.0 103
Tm 0.7 2 3.8 143
Carbonate sample K 65
Element
Present in the solution of digested sample before
loadinga / (µg L−1)
Added to digested solution / (µg L−1)
Found /
(µg L−1) Recovery / %
Pr 5.6 2 8.2 107
Sm 4.06 2 5.8 95.7
Eu 3.02 2 4.53 90.1
Gd 5.46 2 7.53 100.9
Tb 2.1 2 3.02 73.2
Ho 1.37 2 2.45 72.7
Dy 3.2 2 4.8 90.7
Tm 1.56 2 2.7 75.8
Lu 2.4 2 3.83 86.9
3. Gob, S.; Lodes, A.; Nolde, N.; Bau, M.; Jaccob, D. E.; Markl, G.; Appl. Geochem. 2013, 33, 127.
4. Moldoveana, G. A.; Papangelakis, V. G.; Hydrometallurgy2012,
117, 71.
5. Hu, W.; Noreus, D.; J. Alloys Compd. 2003, 356, 734. 6. Gschneidner, K. A.; Pecharsky, V. K.; J. Rare Earths2007, 24,
641.
7. Guanming, Q.; Xikun, L.; Tai, Q.; Haitu, Z.; Honghau, Y.; Rutting, M.; J. Rare Earths2007, 25, 281.
8. Zhang, Z.; Sun, Q.; Ding, S.; Liang, T.; Zhang, Ch.; Yan, J.;
Biol. Trace Elem. Res.2005, 107, 73.
9. Anitha, S.; Challarj, E. S. E.; Saranraj, P.; J. Ecobiotechnol.
2010, 217, 01.
10. Lijun, W.; Tao, L.; Aitang, H.; Shiming, D.; Chaosheng, Z.; Xin, Y.; J. Rare Earths2005, 23, 747.
11. Liang, P.; Liu, Y.; Guo, L.; Spectrochim. Acta, Part B2005, 60, 125.
12. Hakim, L.; Sabarudin, A.; Oshima, M.; Motomizo, S.; Anal. Chim. Acta2007, 588, 73.
13. Nobuo, S.; Naoki, K.; Hiroshi, I.; Appl. Geochem. 2008, 23, 2955.
14. Dick, D.; Wegner, A.; Gabrielli, P.; Ruth, U.; Barbante, C.; Kriews, M.; Anal. Chim.Acta2008, 621, 140.
15. Chung, C. H.; Brenner, I.; You, C. F.; Spectrochim. Acta, Part B
2009, 64, 849.
16. Su, S.; Chen, B.; He, M.; Hu, B.; Xiao, Z.; Talanta2014, 119, 458.
17. Wen, B.; Shan, X. Q.; Xu, S. G.; Analyst (Cambridge, U. K.)
1999, 124, 621.
18. Cho, J.; Chung, K. W.; Coi, M. S.; Kim, H. J.; Talanta2012,
99, 369.
19. Hirata, S.; Kajia, T.; Aihara, M.; Honda, K.; Shikino, D.; Talanta
2002, 58, 1185.
20. Maquieira, A.; Elmahdi, H.; Puchades, R.; J. Anal. At. Spectrom.
1999, 11, 99.
21. Rao, T. P.; Kala, R.; Talanta2004, 63, 949.
22. Karadaş, C.; Kara, D.; Fisher, A.; Anal. Chim. Acta2011, 689, 184.
23. Huang, C. Z.; Jiang, Z.; Hu, B.; Talanta2007, 73, 274. 24. Bahramifar, N.; Yamini, Y.; Anal. Chim. Acta2005, 540, 325. 25. Karadas, C.; Kara, D.; Water, Air, Soil pollut.2014, 225, 2192.
26. Chandrasekaran, K.; Karunasagar, D.; Arunachalam, J.; J. Chromatogr. A2008, 118, 59.
27. Taicheng, D.; Tiny, C. H.; Xianjin, Z.; J. Anal. At. Spectrom.
2002, 17, 410.
28. Li, Y.; Hu, B.; J. Hazard. Mater.2010, 174, 534.
29. Hang, C. Z.; Hu, B.; Jiang, Z. C.; Zhang, N.; Talanta2007, 71, 1239.
30. Praveen, R. S.; Daniel, S.; Rao, T. P.; Sampath, S.; Rao, K. S.;
Talanta2006, 70, 437.
31. Dave, S. R.; Kaur, H.; Menon, S. K.; React. Funct. Polym.2010,
70, 692.
32. Chen, S.; Xiao, M.; Lu, D.; Zhan, X.; Anal. Lett.2007, 40, 2105. 33. Zeren, F.; Yilmaz, V.; Arslan, Z.; Microchem. J.2013, 110, 178. 34. Shariati, S.; Yamini, Y.; Faraji, M.; Saleh, A.; Microchim. Acta
2009, 165, 65.
35. Zanjanchi, M. A.; Noei, H.; Moghimi, M.; Talanta2006, 70, 933.
36. Cozza, G.; Mazzorana, M.; Papinutto, E.; Biochem. J.2009,
421, 387.
37. Hassan, J.; Zari, N.; Tabar-Heydar, K.; J. Anal. Chem. 2016, 71, 36.
38. Borokowski, J. J.; Technometrics1995, 37, 399.
39. Anderson, S. S.; dos Santos, W. N. L.; Ferreira, S. L. C.;
Spectrochim. Acta, Part B2005, 60, 737.
40. Stat-Ease, Inc; Design Expert Software Version 7.0; Minneapolis, USA, 2006.
41. Jarvis, K. K.; Gay, A. L.; Houk, R. S.; Handbook of Inductively Coupled Plasma Mass Spectrometry; Springer: Berlin, 1992.
Submitted: February 18, 2016