Chemical Industry & Chemical Engineering Quarterly www.ache.org.rs/CICEQ
Chem. Ind. Chem. Eng. Q. 20 (1) 109−114 (2014) CI&CEQ
KULANDAIVELU KARUNAKARAN1 GURUSAMY NAVANEETHAN1 ELANGO KUPPANAGOUNDER PITCHAIMUTHU2 1
Department of Chemistry, Sona College of Technology (Anna University), Salem, India 2Department of Chemistry, Gandhigram Rural Institute (Deemed University), Gandhigram, India
SCIENTIFIC PAPER
UDC 543.544.5.068.7:615 DOI 10.2298/CICEQ120502106K
A VALIDATED STABILITY-INDICATING
RP-HPLC METHOD FOR PARACETAMOL
AND LORNOXICAM: APPLICATION TO
PHARMACEUTICAL DOSAGE FORMS
Article Highlight
• The developed method is user-friendly for routine release analysis in pharmaceutical industry and it achieved very low level of LOQ value, hence it can be used for the cleaning verification of LR and PR
Abstract
A new method for the simultaneous determination of paracetamol (PR) and lornoxicam (LR) has been developed by reversed phase HPLC from the com-bination drug product. The separation achieved on a C18 column using
aceto-nitrile and 0.02 M potassium dihydrogen phosphate in the ratio of 35:65 (v/v) as the mobile phase at a flow rate of 1.0 mL/min. Both the components were monitored at a single wavelength at 260 nm and the column temperature was maintained at 30 °C throughout the analysis. A linear response was found in the concentration range of 125–375 µg/mL for PR and 2–6 µg/mL for LR, with the correlation coefficient of more than 0.999. Although the tablet contained a high dose of PR (500 mg) and a low dose of LR (8 mg), a single HPLC method was developed and the intra- as well as inter-day precision was obtained at less than 2% of RSD. The accuracy results obtained were between 98% and 102%. The drug was intentionally degraded under acidic, basic, peroxide, ther-mal and photolytic conditions. The major degradation observed for both PR and LR under peroxide condition indicated that the drug product is susceptible to oxidation. The degraded peaks were properly resolved from PR and LR. Hence, the method is stability indicating.
Keywords: RP-HPLC, paracetamol, lornoxicam, stability indicating, forced degradation, validation.
Lornoxicam (LR), an oxicam derivative, is an NSAID. It is used for the treatment of musculoskeletal and joint disorders such as osteoarthritis and rheuma-toid arthritis. It is also used for the treatment of other painful conditions including postoperative pain. For the treatment of osteoarthritis and rheumatoid arthri-tis, LR is administered in an oral dosage form at a daily dose of 12 mg, in two or three divided doses. Paracetamol (PR) is a widely used over-the-counter as an analgesic and an antipyretic. It is also used for
Correspondence: K. Karunakaran, Department of Chemistry, Sona College of Technology (Anna University), Salem 636 005, India.
E-mail: [email protected] Paper received: 2 May, 2012 Paper revised: 8 November, 2012 Paper accepted: 8 November, 2012
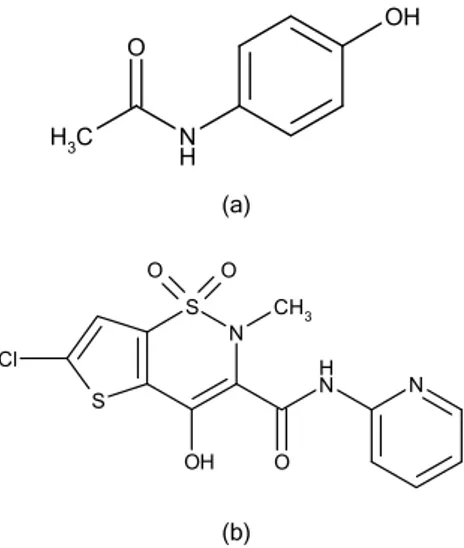
fever, headaches and other minor aches and pains. It is a major ingredient in numerous cold and flu medi-cines. PR is also used in the management of very severe pain such as pain caused by cancer or post-operative pain [1]. Chemically, PR is called N -(4-hyd-roxyphenyl)ethanamide and LR, 6-chloro-4-hydroxy- -2-methyl-N-2-pyridinyl-2H-thieno-[2,3-e]-1,2-thiazine- -3-carboxamide 1,1-dioxide (Figure 1).
effective. Stability-indicating methods have also been reported to be effective for the estimation of LR indi-vidually [13] and in combination with other oxicams [14,15] and thiocolchicoside [16].
OH
N H C
H
3
O
(a)
N N H
O N S
S
OH Cl
O O
CH
3
(b)
Figure 1. The chemical structures of a) paracetamol and b) lornoxicam.
Other than the above methods, there is no offi-cial method for the estimation of LR in any of the pharmacopoeias. Recently, a UV-Vis spectrophoto-metric method [17] and TLC [18] method were pub-lished for the simultaneous determination of PR and LR. Some of the non-stability indicating HPLC methods were reported for the combination drug product [19,20]. Dinesh Kumar et al. published stability indi-cating HPLC and HPTLC methods [21]. However, this method does not discuss the degradation product in the HPLC method. Srinivasu et al. reported the non-stability indicating UPLC method [22]. Therefore, the aim of the present endeavor is to develop a simple, rapid, accurate and stability-indicating isocratic RP- -HPLC method for the simultaneous estimation of both drugs in a combined tablet dosage form in pre-sence of their degradation products.
MATERIALS AND METHODS
Reagents
The working standards of PR and LR have been received as gift samples from M/S GS laboratory, Chennai, India, and M/S Pharma laboratory, Baddi, India. LORNISTAR-P, a commercially available drug, containing 500 mg of PR and 8 mg of LR was used. HPLC grade acetonitrile and AR grade potassium dihydrogen phosphate were purchased from Merck, India, and were used as received. The water used in the present study was provided by a Milli-Q water
purification system. All other reagents employed were of high purity analytical grade.
Instrumentations and chromatographic conditions
The chromatographic system (Waters Alliance), equipped with quaternary solvent delivery system with 2487 UV and 2996 PDA detectors was employed in the present study. A Kromasil C18 column, 5 µm, 250
mm×4.6 mm, was used as a stationary phase. The separation was achieved in the isocratic mode, with mobile phase consisting of a mixture of 0.02 M potas-sium dihydrogen phosphate and acetonitrile in the ratio of 65:35 (v/v), with a flow rate of 1.0 mL/min. The eluants were monitored at 260 nm. The analysis was carried out at 30 °C at an injection volume of 50 µL. All mobile phases were filtered through a 0.45 µm Millipore filter.
Preparation of standard solutions
A standard solution containing 250 µg/mL of PR and 4 µg/mL of LR was prepared by dissolving PR and LR working standards in the diluent (70:30 (v/v) acetonitrile and water).
Preparation of sample solutions
Five tablets were weighed and finely powdered. The total powder sample was transferred to a 500 mL standard volumetric flask. Approximately 300 mL of the diluent was added and sonicated for 30 min with intermittent shaking. The volume was made up to the mark with the diluent. The solution was filtered and further diluted with the diluent to have a final working concentration of 250 µg/mL of PR and 4 µg/mL of LR.
RESULTS AND DISCUSSION
Method development
The RP-HPLC method was optimized with a goal of developing a stability indicating assay method to quantify PR and LR simultaneously from the phar-maceutical dosage form. The degraded samples were used for the optimization of the method. Both pure drugs and degraded samples were injected in diffe-rent mobile phases and columns. The initial results observed in the mobile phase containing phosphate buffer and acetonitrile with C18 column were positive.
commercial C18 column was tried finally good peak
shape and theoretical plates found in Kromasil C18
column without using any ion-pair agent. The wave-length selected was 260 nm at which both the drugs got good response. Satisfactory results were obtained with the above-mentioned chromatographic condi-tions with respect to tailing, theoretical plates and resolution.
Optimization of sample preparation
Twenty tablets were weighed and crushed. The powder equivalent of 40 mg of LR was taken in a 500 mL volumetric flask; 300 mL of the diluent was added, sonicated for 30 min, and then made up to the mark with the diluents, 5 mL of the solution was further diluted to 100 mL with the diluent. The samples were analyzed using the proposed analytical method. The recovery of LR was found between 82 and 111%. The
RSD, %, was found to be more than 10 in six replicate sample preparations. In order to improve the recovery and consistency of LR, five tablets were crushed with the help of mortar and pestle. The total powder sample was taken in a 500 mL volumetric flask; 300 mL of the diluent was added and sonicated for 30 min and then made up to the mark with the diluents, 5.0 mL of the solution was further diluted to 100 mL with the diluent. The recovery found was between 98% and 102% for LR and PR. The %RSD was found to be less than 2.0, indicating precision of the method.
Method validation
The optimized HPLC method was validated with respect to specificity, selectivity, precision, rugged-ness, linearity, robustness and accuracy [23,24].
System suitability
To check the system and column performance, the standard solution was injected five times. The following parameters were monitored, i.e., tailing factor (not more than 2.0), theoretical plates (not less than 5000 for PR and not less than 10000 for LR), RSD of PR and LR (not more the 2%) and the resolution between PR and LR (not less than 2.0). The system suitability results are shown in Table 1.
Specificity and selectivity
The intentional degradation study was attempted to prove the stability indicating power of the optimized LC method and to find the degradation pathway of the
drug product. All forced degradation samples were prepared at a test concentration of 250 µg/mL of PR and 4 µg/mL of LR. For acid (0.1 M HCl), base (0.1 M NaOH) hydrolysis and peroxide oxidation (10% H2O2)
the solution were refluxed at 80 °C for 8 h. Deg-radation was also carried out in solid sample by exposing the drug product at 105 °C temperature and light at 254 nm for 48 h. To prove the selectivity of the method, individual components of PR and LR were injected. All the stressed samples were analysed and all the peak purity tests were carried out using the PDA detector. The percentage degradation was cal-culated against the standard solution of PR and LR.
The results are shown in Table 2, indicating that the drug product was stable under photolytic and thermal stress conditions, while minor degradation occurred in acid and base degraded samples. Sig-nificant degradation of the drug product under oxide-tive condition led to the formation of unknown deg-radation product peaks at 2.82, 3.97, 4.82, 5.36, 7.21 and 9.46 min (Figure 2). The results of the peak purity test using PDA confirmed that the PR and LR peaks obtained from all the stressed samples analyzed were homogeneous and pure. The close eluting degrada-tion products were well resolved from the pure drugs. The purity angle was observed to be within the purity threshold limit in all the stressed samples, demon-strating the stability indicating power of the method. No blank interference was found at the RT of PR and LR (Figure 3).
Precision
The precision of the developed method was evaluated by injecting six individual preparations of the sample at the test concentration. For intermediate precision, six individual samples were analysed by different analysts on different days using different HPLC systems. The percentage assay and RSD were calculated for PR and LR. The RSD of PR and LR was found to be less than 2.0 proving the precision of the method.
Linearity
The linearity curves were plotted in the range of 125–375 µg/mL for PR and 2–6 µg/mL for LR against their peak areas. Excellent linearity was obtained, which is represented by the following linear regres-sion equations:
Table 1. System suitability results
Compound RT / min Resolution USP Tailing factor USP Theoretical plates PR
LR
3.29 10.49
- 26.51
1.2 1.2
Table 2. Results of forced degradation study; acceptance criteria: purity angle is less than purity threshold
Conditions PR LR
Assay, % Purity angle Purity threshold Assay, % Purity angle Purity threshold Unstressed sample
Acid hydrolysis (0.1 M HCl for 8h) Base hydrolysis (0.1 M NaOH for 8 h) Oxidation (10% H2O2 for 8 h)
Thermal (105 °C for 48 h) Photolytic (254 nm for 48 h)
99.5 97.5 96.2 82.3 98.9 99.1
0.390 0.412 0.451 0.515 0.512 0.362
1.022 1.015 0.962 0.981 1.011 1.032
99.1 97.0 95.5 75.2 98.9 99.1
0.588 0.513 0.423 0.315 0.526 0.423
0.820 0.932 0.852 0.810 0.921 0.791
Figure 2. Typical LC chromatogram obtained from a sample after oxidative stress.
Figure 3. Typical HPLC chromatograms of blank (A) and unstressed sample (B).
(
2)
PR 14745 48000 0.999
Y = x + r =
(
2)
LR 10192 926 0.999
Y = x + r =
Accuracy
Accuracy of the developed method was con-firmed by the recovery study as per ICH guidelines at three different concentration levels, viz., 80, 100 and 120%. The study was performed in triplicate to check the recovery of the drugs at different levels in the formulations. The result of the accuracy study is reported in Table 3. The percentage recovery ranged from 99.32 to 100.05% for PR and from 99.25 to
100.10% for LR. According to the recovery results, it is clear that the proposed method is very accurate for the estimation of PR and LR in the combined dosage form.
Robustness
The low values of %RSD obtained after introducing small changes in the chromatographic parameters indicated the robustness of the method.
Limit of detection (LOD) and limit of quantification (LOQ)
In order to estimate the LOD and LOQ, the serial dilution of PR and LR solutions was performed and the to-noise ratio was determined. The signal-to-noise ratios of 3 and 10 were considered as LOD
and LOQ, respectively. The LOD and LOQ concen-trations for PR were found to be 0.238 µg/mL and 0.665 µg/mL, respectively. The LOD and LOQ con-centrations for LR were found to be 0.192 and 0.480 µg/mL, respectively. The LOQ precision was studied at six different preparations. The RSD for PR and LR was found to be less than 5.
Market sample analysis
The proposed method was verified by means of six replicated estimations of the pharmaceutical pre-parations of the commercially available tablet LORNISTAR-P, containing 500 mg of PR and 8 mg of LR. The average assay for PR and LR was found to be 99.51 and 100.15%, respectively. The RSD values for the six assay values were 1.10% for PR and 1.21% for LR.
CONCLUSION
The proposed isocratic RP-HPLC method deve-loped for the simultaneous determination of PR and LR was found to be specific, linear, precise, accurate and robust. All validation parameter results were within the acceptance range. As the LOQ and LOD values of PR and LR were achieved at a very low level, this method can be suitable for cleaning vali-dation in the pharmaceutical industry. The developed method is stability indicating and can be conveniently used by the quality control department to determine the assay of PR and LR simultaneously in commercial and stability samples.
Acknowledgments
The author wishes to thank M/S GS lab (Chen-nai, India) and M/S Pharma Lab (Baddi, India) for providing gift samples of PR and LR standards. REFERENCES
[1] S.C. Sweetman, Martindale: The Complete Drug Refe-rence, 36th ed., The Pharmaceutical Press, London, 2009, pp. 77, 108
[2] J.T. Franeta, D. Agbaba, S. Eric, S. Pakvok, M. Aleksic, S. Vladimirov, Farmaco. 57 (2002) 709-713
[3] K.A. Shaikh, A.B. Devkhile, J. Chromatogr. Sci. 46 (2008) 649-652
[4] H. Cenyuva, T. Ozden, J. Chromatogr. Sci. 40 (2002) 97- –100
[5] P. Reddy, Int. J. Pharm. Tech. Res. 1 (2009) 514-516 [6] S.J. Wadher, P.R. Pathankar, P. Manisha, R.O.
Ganj-wale, P.G. Teole, Ind. J. Pharm. Sci. 70 (2008) 393-395 [7] X. Kang, J. Wang, H. Wu, J. Liu, A.A. Ilhan, Y. Lin,
Talanta 81 (2010) 754-759
[8] D.K. Laxman, Y. Asmita, Kamble, V.M. Mahadeo, R.D. Sunil,J. AOAC Int. 93 (2010) 765-770
[9] T. Belal, T. Award, C. Randall Clark, J. AOAC Int. 92 (2009) 1622-1630
[10] Y.H. Kim, H.Y. Ji, E.S. Park, S.W. Chae, H.S. Lee, Arch. Pharm. Res. 30 (2007) 905-910
[11] E. Nemutlu, S. Demicran, S. Kir, Parmazie 60 (2005) 421-425
[12] C. Ibrahim, K. Nisa, A. Sule, C. B. U. J. Sci. 5 (2009) 11- –18
[13] R.P. Kiran, P.R. Vipul, N.S. Jaiprakash, B.S. Devanand, Chromatographia 69 (2009) 1001-1005
[14] E.A. Taha, N.N. Salama, L. El-Said Abdel Fattah, J. AOAC. Int. 87 (2004) 366-373
[15] J. Joseph-Charles, M. Bertucat, J. Liq. Chromatogr. Related Technol. 22 (1999) 2009-2021
[16] M.B. Shekhar, M.P. Dasharath, P.K. Amit, C.N. Patel, J. Chem. Pharm. Res. 2 (2010) 563-572
[17] S. Lakshmi, K.S. Lakshmi, T. Tintu, Int. J. Pharm. Sci. 2 (2010) 166-168
[18] P.J. Dhara, P.P. Vivek, Int. J. Chem Tech. Res. 2 (2010) 1929-1932
[19] M.N. Santosh, N.S. Surekha, L.R. Swaroop, S.N. Jaiprakash, Pharmacia Sinica 2 (2011) 138-144
Table 3. Accuracy results
Drug Amount added Recovery, % (n = 3) RSD / % (n=3) % µg/ml
PR 80 100
120
200 250 300
100.05 99.51 99.32
1.23 0.89 1.05 LR 80
100 120
3.2 4.0 4.8
99.51 100.10
99.25
[20] M. Attimarad, Pharmaceutical Methods 2 (2011) 61-66 [21] J. Dinesh Kumar, D. Nitin, S. Yash, Int. J. Pharm.
Biomed. Sci. 2 (2011) 55-60
[22] T. Srinivasu, B.N. Rao, M.M. Annapurna, T.G. Chandra-shekhar, Int. J. Pharm. Sci. Res. 3 (2012) 1149-1154
[23] ICH Validation of Analytical Procedures (2005). Text and Methodology Q2 (R1), International Conference on Harmonization, IFPMA, Geneva, 2005
[24] United States Pharmacopoeia (2008), 31st ed., United
States Pharmacopoeia Convention Inc., Rockville, MD, pp, 683-687.
KULANDAIVELU
KARUNAKARAN1
GURUSAMY NAVANEETHAN1
ELANGO KUPPANAGOUNDER
PITCHAIMUTHU2
1Department of Chemistry, Sona
College of Technology (Anna University), Salem, India
2
Department of Chemistry, Gandhigram Rural Institute (Deemed University), Gandhigram, India
NAUČNI RAD
VALIDACIJA RP-HPLC METODE ZA PRA
Ć
ENJE
STABILNOSTI PARACETAMOLA I LORNOKSIKAMA
U FARMACEUSTKIM PREPARATIMA
Razvijena je nova, jednostavna metoda za simultano određivanje paracetamola (PR) i lornoksikama (LR) u kombinovanim preparatima RP-HPLC hromatografijom. Razdvajanje je izvedeno na C18 koloni, koristeći kao mobilnu fazu rastvarač
acetonitrile-kalijum-dihid-rogen-fosfatni puffer (0,02 M) u odnosu 35:65, v/v. Protok mobilne faze bio je 1,0 ml/min. Temperatura kolone je održavana na 30 °C , a obe komponente su detektovane na 260 nm. Metoda je linerana za određivanje paracetamola u opsegu 125-375 µg/mL, a lorno-ksikama u opsegu 2-6 µg/mL sa koeficijentom korelacije većim od 0,999. Iako tablete sadrže visoku koncentraciju paracetamola (500 mg) i malu koncentraciju lornoksikama (8 mg), moguće je određivanje obe komponente jednom HPLC analizom. Varijabilnost metode u toku jednog i više dana je <2% RSD. Tačnost je između 98 i 102%. Aktivne sup-stance su podrvgnute kiseloj, baznoj, peroksidnoj, termalnoj i fotolitičkoj degradaciji. Nađeni degradacioni produkti za PR i LR pri peroksidnoj degradciji su pokazali da se ove lekovite supstance lako oksidišu. Degradacioni produkti se uspešno razdvajaju od PR i LR razvijenom metodom, pa je ona pogodna za praćenje stabilnosti ispitivanih preparata.