Liseth Ferreira Rosa Perestrelo Michael Caldeira JosØ S. Câmara
Centro de Qumica da Madeira, Departamento de Qumica, Universidade da Madeira, Campus Universitrio da Penteada, Funchal, Portugal
Original Paper
Characterization of volatile substances in apples
from
Rosaceae
family by headspace solid-phase
microextraction followed by GC-qMS
The volatile composition of different apple varieties ofMalus domesticaBorkh. species from different geographic regions at Madeira Islands, namely Ponta do Pargo (PP), Porto Santo (PS), and Santo da Serra (SS) was established by headspace solid-phase microextraction (HS-SPME) procedure followed by GC-MS (GC-qMS) analysis. Signifi-cant parameters affecting sorption process such as fiber coating, extraction tempera-ture, extraction time, sample amount, dilution factor, ionic strength, and desorption time, were optimized and discussed. The SPME fiber coated with 50/30lm divinylben-zene/carboxen/PDMS (DVB/CAR/PDMS) afforded highest extraction efficiency of vola-tile compounds, providing the best sensitivity for the target volavola-tiles, particularly when the samples were extracted at 508C for 30 min with constant magnetic stirring. A qualitative and semi-quantitative analysis between the investigated apple species has been established. It was possible to identify about 100 of volatile compounds among pulp (46, 45, and 39), peel (64, 60, and 64), and entire fruit (65, 43, and 50) in PP, PS, and SS apples, respectively. Ethyl esters, terpenes, and higher alcohols were found to be the most representative volatiles.a-Farnesene, hexan-1-ol and hexyl 2-methylbu-tyrate were the compounds found in the volatile profile of studied apples with the larg-est GC area, representing, on average, 24.71, 14.06, and 10.80% of the total volatile frac-tion from PP, PS, and SS apples. In PP entire apple, the most abundant compounds iden-tified werea-farnesene (30.49%), the unknown compoundm/z(69, 101, 157) (21.82%) and hexyl acetate (6.57%). Regarding PS entire apple the major compounds werea -far-nesene (16.87%), estragole (15.43%), hexan-1-ol (10.94), andE-2-hexenal (10.67).a -Farne-sene (30.3%), hexan-1-ol (18.90%), 2-methylbutanoic acid (4.7%), and pentan-1-ol (4.6%) were also found as SS entire apple volatiles present in a higher relative content. Princi-pal component analysis (PCA) of the results clustered the apples into three groups according to geographic origin. Linear discriminant analysis (LDA) was performed in order to detect the volatile compounds able to differentiate the three kinds of apples investigated. The most important contributions to the differentiation of the PP, PS, and SS apples were ethyl hexanoate, hexyl 2-methylbutyrate,E,E-2,4-heptadienal,p -ethyl styrene, andE-2-hexenal.
Keywords:Apples / GC-qMS /Malus domesticaBorkh. / Solid-phase microextraction / Volatile profile /
Received: January 14, 2009; revised: March 11, 2009; accepted: March 11, 2009
DOI 10.1002/jssc.200900024
1 Introduction
From hybrid origin, the apple tree fromMalus domestica Borkh. (family Rosaceae) is largely cultivated in Madeira Islands for its edible fruits, where its production has a
significant impact on the economic activity of the region, being producedl3300 Tonperyear. Because its volatile composition has not yet been characterized, its aroma was subjectively defined assui generis. Aroma
vola-Correspondence:Professor Jos S. Cmara, Centro de Qumica da Madeira, Departamento de Qumica, Universidade da Ma-deira, Campus Universitrio da Penteada, 9000-390 Funchal, Portugal
E-mail:[email protected] Fax:+351-291705149
tile compounds are of the utmost importance on the establishment of fruit quality criteria and especially on determining consumer acceptance. Apple aroma profiles are complex since, they are constituted by a large num-ber of volatile compounds (volatile organic compound (VOCs)) that contributed to the overall sensory quality. Over 300 VOCs have been measured in the aroma profile of apples. These compounds include carboxylic esters, alcohols, aldehydes, ketones, acids, and ethers, but just about 20 of these chemicals are character impact com-pounds. Some are present in very low concentrations and contribute potent aroma characteristics typical of apple flavor (e.g., ethyl 2-methyl butyrate). Others con-tribute to the aroma intensity (e.g.,E-2-hexenal) or are related to aroma quality (alcohols). The contribution of each volatile compound depends on both its odor thresh-old and their respective concentration that in turn depends on the activity of related enzymes and on sub-strate availability [1]. Therefore, the final aroma profile of a fruit is the result of a balance between all volatile compounds emitted and any modification in this fine balance would result in changes in the fruit flavor [2]. The volatile composition of apples depends on several factors, mainly, cultivar, cultural practices, climacteric conditions, and the state of fruit maturity [3]. Although there is a great range of compounds in the volatile com-position of apples, the majority are carboxylic esters and higher alcohols [4 – 6]. The most abundant com-pounds are even numbered carbon chains including combinations of ethanoic, butanoic, and hexanoic acids with ethyl, butyl, and hexyl alcohols. Ethyl esters, which are the most significant contributors to apple aroma profile, being generated by esterification of alco-hols and acyl-CoA derived from fatty acids and amino acid metabolism. Lipoxygenase enzyme has also been reported to play an important role on the formation of straight-chain volatile aldehydes and alcohols through a number of different pathways. Other important aroma compounds are branched-chain volatile com-pounds, which are derived from branch-chained amino acids leucine, isoleucine, and valine, as well as from ala-nine and aspartic acid. It has also been noticed that fruits produce acetaldehyde and alcohol during their maturation and ripening [4, 6, 7]. However, only a few volatile compounds have a decisive impact on the sen-sory quality of apple fruits, such as ethyl acetate, ethyl butyrate, and methyl anthranilate [8]. The contribution of each volatile compound depends on both, its odor threshold and their respective concentration that in turn depends on the activity of related enzymes and on substrate availability [1]. Therefore, the final aroma profile of a fruit is the result of a balance between all volatile compounds emitted and any modification in this fine balance would result in changes in the fruit flavor [2].
The development of analytical methodologies for aroma characterization of food products has been impor-tant for the identification of volatiles and understanding their role in aroma and organoleptic quality. Several extraction techniques such as headspace, purge, and trap, liquid – liquid extraction (LLE) and SPE are described in different studies; however, these methods are based on the use of solvents and present some draw-backs such as possibility of sample contamination and the loss of some important volatiles, depending on sol-vent selectivity and volatility, during the concentration step. Additionally they require large amounts of sample, are laborious and time consuming methods [9, 10]. Solid-phase microextraction (SPME) is a solventless extraction technique that presents itself as an alternative to the con-ventional sample extraction techniques [9, 11] and more-over is faster and easier than solvent extractions and dis-tillations, as well as being highly reproducible and sensi-tive. Moreover a range of fiber coating are commercially available, providing specificity for a wide range of polar, nonpolar, volatile, and semivolatile compounds. This technique has been applied to the analysis of volatile and nonvolatile compounds (in gaseous, solid, and liquid samples) present in several matrixes and also for the analysis of volatiles in a large variety of fruits, such as apples [1, 12 – 19], peaches [5], pears [5, 20], strawberries [9, 21], annonas [22], among others. Its suitability has also been verified in the detection of characteristic aromas, off-flavors, pesticides, and even antibiotics in various food matrices, as for example, wine [10, 23 – 25], whisky [26], and beer [27].
differenti-ate the three apple varieties investigdifferenti-ated. To our knowl-edge, there are no reports in the literature on the aroma compounds of these apples species cultivated at Madeira Island.
2 Materials and methods
2.1 Chemicals and reagents
Both, the SPME commercial fibers and the SPME holder for manual sampling were supplied by Supelco (Aldrich, Bellefonte, PA, USA). The reagents and solvents used in this study were of analytical quality and HPLC grade, higher than 98%. Sodium chloride was purchased from Panreac (Barcelone, Spain) and C8-C20 n-alkanes series from Sigma – Aldrich (Buchs, Switzerland). Ultra pure water was obtained from a Milli-Q system (Millipore).
2.2 Fruit samples
The apple samples from PP, PS, and SS used in this study were harvested at commercial maturity during the 2007 season and purchased from traditional local stores. The apples of each location were cleaned, deseeded, and the bulbs and talks were removed. In order to homogenize the apple samples (pulp, peel, and entire fruit) each piece of fruit was cut into small pieces and immediately transferred into a domestic blender. An amount (3%, w/va) of calcium chloride (CaCl
2) was added to inhibit the enzyme activity. The mixture was stored in glass vials at – 208C until analysis. All analyses were carried out in triplicate.
2.3 HS-SPME optimization
The HS-SPME experimental parameters such as fiber coat-ing, extraction temperature and time, sample amount, dilution factor (water volume), ionic strength, and de-sorption time were systematically evaluated. To assess the effects of these experimental factors on the extrac-tion efficiency of VOCS, the number of the tentatively identified compounds and the total peak areas were used as parameters to optimize the methodology. The optimi-zation of the dynamic headspace method of extraction was done with PP apple pulp.
Six fibers were used to evaluate the effect of different coatings on the extraction efficiency of VOCs and SVOCs from apple samples: carbowax-divinylbenzene (CW/DVB, 70lm), DVB/carboxen (CAR)/PDMS (50:30lm), CAR/ PDMS (75lm), polyacrylate (PA, 85lm), PDMS/DVB (65lm), and PDMS (100lm). Prior to use, fibers were conditioned according to the manufactures' instruc-tions. Then, each fiber was exposed to the headspace of
a 4 mL septum-sealed glass vial containing 0.50 g of sam-ple, 0.50 mL of water, and 0.10 g of NaCl at the same temperature and time (308C and 30 min, respectively) under constant magnetic stirring of 800 rpm. Before sampling, each fiber was reconditioned for 15 min in the GC injection port at 2508C to eliminate possible remains on the coating. The optimization of the other experimental parameters was performed with extrac-tions at different temperatures (30, 40, and 508C), times (15, 30, 60, and 75 min), sample amounts (0.50, 0.75, and 1.00 g), water volumes (0.50, 1.00, and 1.50 mL), NaCl amounts (0.10, 0.20, and 0.30 g) and desorption times (3, 6, and 9 min).
2.3.1 HS-SPME procedure
After the selection of the best HS-SPME sampling condi-tions, the following procedures were carried out using 0.75 g of apple sample in a 4 mL septum-sealed glass vial containing 1 mL of water and 0.10 g of NaCl. The system was placed in a thermostated bath adjusted to 508C under constant magnetic stirring (800 rpm). The DVB/ CAR/PDMS fiber was then exposed to the headspace for 30 min to promote the compounds transfer from the sample to the headspace. Following the sampling proce-dure, the SPME fiber was retracted prior removal from the sample container and immediately inserted into the GC system injection port at 2508C for 6 min, where the analytes were thermally desorbed and transferred directly to the GC system column. Before daily analysis, the fiber was preconditioned for 15 min in the GC system injection port at 2508C. At least three replicates were done for each sample. Considering that the polymer phase of fibers can absorb/adsorb aroma chemicals from air and produce a high background in the chromato-gram, blank runs were conducted between extractions to verify the absence of any carry over which would cause memory effects and result discrepancy [24, 25].
2.4 GC-qMS analysis
source and transfer line temperatures were 2208C. Quad-rupole mass detector was operated at 1808C in the elec-tron-impact (EI) mode at 70 eV. The electron multiplier was set to the auto tune procedure. All data were obtained by collecting the full-scan mass spectra within the range of 30 – 300m/z. For the determination of Kovat's index (KI), a C8– C20n-alkanes series was used.
The volatile compounds were identified by matching mass spectra with spectra of reference compounds in the National Institute of Standards and Technology (NIST05) Mass Spectral Search Program. In addition, the com-pounds were tentatively identified by comparing the experimental retention indices with the theoretical ones obtained from literature. The relative amounts of the individual components are expressed as percentage rela-tive to the total area (RPA, %).
2.5 Statistical analysis
PCA was used to examine the relationship among the composition and the wine variety. It is an unsupervised technique that reduces the dimensionality of the origi-nal data matrix retaining the maximum amount of var-iance. LDA is a supervised technique method used for classification purposes. Both methods were carried out using the SPSS Program, version 11.0 (SPSS Headquar-ters, Chicago, IL, USA) and were applied to the normal-ized areas of the volatiles identified by HS-SPMEDVB/CAR/
PDMS/GC-qMS.
3 Results and discussion
3.1 HS-SPME optimization
According to the proposed methodology, the volatile compounds were extracted from apple samples using the HS-SPME technique that is very sensitive to experimental conditions. Since it is an equilibrium technique, any modification of an experimental parameter will change the distribution coefficient and absorption rate, influ-encing the amount absorbed/adsorbed by the SPME fiber and its corresponding reproducibility [24]. Therefore, the experimental parameters that influence the extraction efficiency such as fiber coating, extraction temperature and time, sample amount, dilution factor (water vol-ume), ionic strength (NaCl amount), and desorption time were systematically studied.
3.1.1 SPME Fiber coating
The extraction efficiency of volatile compounds by the HS-SPME technique strongly depends on their polarity and, consequently, on their affinity to the fiber-coated phase [9, 29]. Therefore, six commercial types of fibers (70lm CW/DVB, 50/30lm DVB/CAR/PDMS, 75lm CAR/ PDMS, 85lm PA, 65lm PDMS/DVB, and 100lm PDMS)
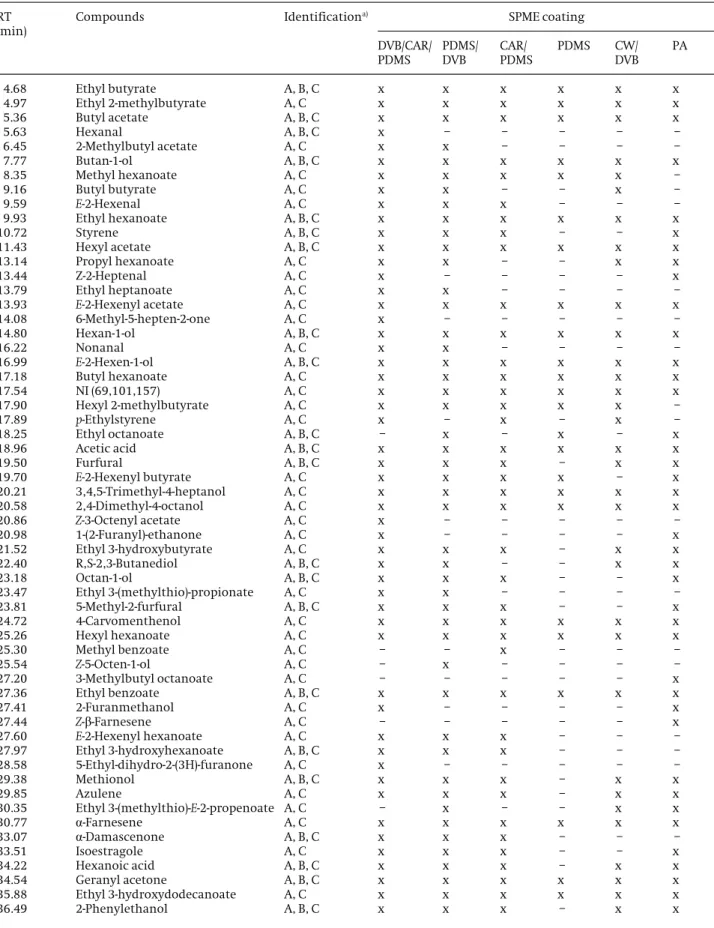
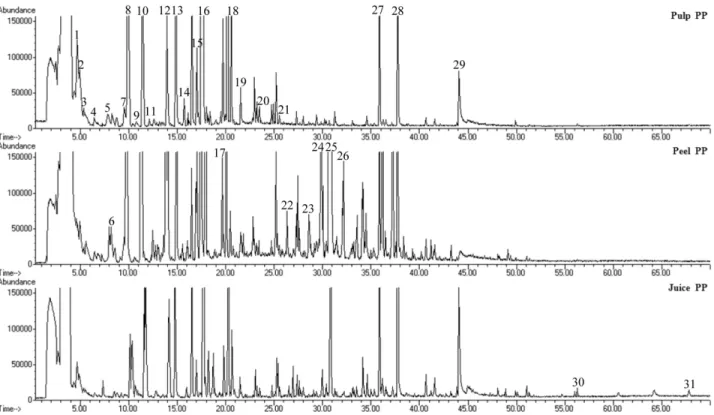
were used to evaluate the effect of different coatings on the extraction efficiency of volatile compounds in apple samples. The total ion current (TIC) chromatograms of volatile compounds identified in PP apple pulp extracts isolated by HS-SPME using different fiber coatings are shown in Fig. 1. The comparison among each TIC shows different GC profiles. The results illustrated in Fig. 2 indi-cate that the DVB/CAR/PDMS and PDMS/DVB coatings had higher extraction efficiency and a clear pattern of volatile compounds relatively to the other fibers. Despite the PDMS/DVB fiber coating showed a similar extraction performance comparatively to DVB/CAR/PDMS, the for-mer fiber coating showed a higher RSD% value than the latter (Fig. 2). As reported in Table 1, the differences of extraction efficiency of volatile compounds between each fiber using the same extraction conditions are noticeable. It can be observed that the fibers displayed different selectivity to different groups of compounds, where ethyl esters accounted for the largest chemical class identified (Table 1). It is also clear that the DVB/CAR/ PDMS fiber showed a better qualitative and quantitative behavior for apple volatiles than the remaining five stud-ied fibers with a total of 58 volatile compounds, while PDMS/DVB fiber extracted 53 volatile compounds. The remaining fibers PA, CAR/PDMS, CW/DVB, and PDMS extracted less volatile compounds, accounting with 44, 43, 36, and 24 VOCs, respectively. Under the same condi-tions, the DVB/CAR/PDMS fiber proved to be the most uni-versal and efficient for the isolation of PP apple pulp vol-atile compounds with different physic-chemical proper-ties, while the nonpolar PDMS fiber showed the lowest adsorptive capacity, but with a good selectivity for mid-dle to high-molecular weight analytes.
3.1.2 Extraction temperature and time
Fig. 3, the DVB/CAR/PDMS fiber coating showed a better extraction efficiency than PDMS/DVB. Based on these results this coating was chosen to perform the extraction of VOCs and SVOCs fromM. domesticaBorkh. apple spe-cies.
The effect of extraction time was studied by increase in the exposure time of the DVB/CAR/PDMS fiber to the headspace, from 15 to 75 min, maintaining the remain-ing experimental parameters strictly the same durremain-ing sampling. The influence of this parameter is displayed in Fig. 3. As can be seen the best extraction efficiency of VOCs from apple samples was obtained with 75 min. It was also observed a typical extraction profile that con-sists of an initial portioning followed by a “steady-state” equilibrium between the fiber and the vapor phase of analytes. For practical purposes, the extraction time of 30 min was adopted because the volatile profile and the total number of obtained compounds are identical com-paratively to the volatile profile obtained with an extrac-tion time of 75 min.
3.1.3 Sample amount
The sample amount was found to be volume dependent, even when 1.0 g of sample was placed inside the 4.0 mL vial instead of 0.75 or 0.5 g. However, larger sample amounts do not mean better results [29]. As seen in Fig. 4, the best extraction efficiency was obtained with 0.5 g of sample associated with a high SD, whereas 0.75 g of sam-ple also showed good extraction efficiency but with a lower deviation. Finally, the lowest total peak area was obtained using 1.0 g of sample and a high SD was observed. Considering the results, 0.75 g was selected as a sample amount to perform the volatiles extraction.
3.1.4 Dilution factor
Another procedure that can be adopted in order to improve the transfer of volatile compounds from the solid phase to the gaseous-headspace phase is the addi-tion of water to the sample matrix. Therefore, the homogenization of apple samples was performed in
Table 1.Volatile compounds identified in PP apple pulp by HS-SPME/GC-qMS using different fiber coatings (extraction temper-ature, 308C; extraction time, 30 min, 800 rpm)
RT (min)
Compounds Identificationa) SPME coating
DVB/CAR/ PDMS
PDMS/ DVB
CAR/ PDMS
PDMS CW/
DVB PA
4.68 Ethyl butyrate A, B, C x x x x x x
4.97 Ethyl 2-methylbutyrate A, C x x x x x x
5.36 Butyl acetate A, B, C x x x x x x
5.63 Hexanal A, B, C x – – – – –
6.45 2-Methylbutyl acetate A, C x x – – – –
7.77 Butan-1-ol A, B, C x x x x x x
8.35 Methyl hexanoate A, C x x x x x –
9.16 Butyl butyrate A, C x x – – x –
9.59 E-2-Hexenal A, C x x x – – –
9.93 Ethyl hexanoate A, B, C x x x x x x
10.72 Styrene A, B, C x x x – – x
11.43 Hexyl acetate A, B, C x x x x x x
13.14 Propyl hexanoate A, C x x – – x x
13.44 Z-2-Heptenal A, C x – – – – x
13.79 Ethyl heptanoate A, C x x – – – –
13.93 E-2-Hexenyl acetate A, C x x x x x x
14.08 6-Methyl-5-hepten-2-one A, C x – – – – –
14.80 Hexan-1-ol A, B, C x x x x x x
16.22 Nonanal A, C x x – – – –
16.99 E-2-Hexen-1-ol A, B, C x x x x x x
17.18 Butyl hexanoate A, C x x x x x x
17.54 NI (69,101,157) A, C x x x x x x
17.90 Hexyl 2-methylbutyrate A, C x x x x x –
17.89 p-Ethylstyrene A, C x – x – x –
18.25 Ethyl octanoate A, B, C – x – x – x
18.96 Acetic acid A, B, C x x x x x x
19.50 Furfural A, B, C x x x – x x
19.70 E-2-Hexenyl butyrate A, C x x x x – x
20.21 3,4,5-Trimethyl-4-heptanol A, C x x x x x x
20.58 2,4-Dimethyl-4-octanol A, C x x x x x x
20.86 Z-3-Octenyl acetate A, C x – – – – –
20.98 1-(2-Furanyl)-ethanone A, C x – – – – x
21.52 Ethyl 3-hydroxybutyrate A, C x x x – x x
22.40 R,S-2,3-Butanediol A, B, C x x – – x x
23.18 Octan-1-ol A, B, C x x x – – x
23.47 Ethyl 3-(methylthio)-propionate A, C x x – – – –
23.81 5-Methyl-2-furfural A, B, C x x x – – x
24.72 4-Carvomenthenol A, C x x x x x x
25.26 Hexyl hexanoate A, C x x x x x x
25.30 Methyl benzoate A, C – – x – – –
25.54 Z-5-Octen-1-ol A, C – x – – – –
27.20 3-Methylbutyl octanoate A, C – – – – – x
27.36 Ethyl benzoate A, B, C x x x x x x
27.41 2-Furanmethanol A, C x – – – – x
27.44 Z-b-Farnesene A, C – – – – – x
27.60 E-2-Hexenyl hexanoate A, C x x x – – –
27.97 Ethyl 3-hydroxyhexanoate A, B, C x x x – – –
28.58 5-Ethyl-dihydro-2-(3H)-furanone A, C x – – – – –
29.38 Methionol A, B, C x x x – x x
29.85 Azulene A, C x x x – x x
30.35 Ethyl 3-(methylthio)-E-2-propenoate A, C – x – – x x
30.77 a-Farnesene A, C x x x x x x
33.07 a-Damascenone A, B, C x x x – – –
33.51 Isoestragole A, C x x x – – x
34.22 Hexanoic acid A, B, C x x x – x x
34.54 Geranyl acetone A, B, C x x x x x x
35.88 Ethyl 3-hydroxydodecanoate A, C x x x x x x
order to produce a matrix to assure the most representa-tive extraction, since the analytes are not distributed uni-formly throughout the fruit pulp. Thus, the homogen-ized samples represent more closely the volatile profile than the entire or even cut apple. As observed in Fig. 4, the increase in water content in the sample matrix resulted in the decrease in extracted volatile compounds. Hence, in order to facilitate the sample agitation and consequent volatile release to the headspace, the addi-tion of 1.0 mL of water was considered for further anal-ysis.
3.1.5 Ionic strength
The dissolution of salt (NaCl) into the sample matrix enhances the partition coefficient of analytes between the headspace and the sample phase and therefore to the
fiber [9, 24, 29]. To analyze the salt effect on the sample matrix, three different NaCl amounts (0.1, 0.2, and 0.3 g) were dissolved in order to saturate the sample matrix. Figure 4 shows the variation of the extracted amount of volatile compounds from the matrix with the amount of salt added. From these results, the amount of 0.1 g of NaCl was added to all samples in the remaining assays.
3.1.6 Desorption time
Desorption time was also investigated for 3, 6, and 9 min. The purpose of optimizing desorption time is to eliminate any carryover and improve peak shape [9, 24]. The effects produced by desorption time are illustrated in Fig. 4 as total peak areas. Desorption time of 6 min proved to be enough to have the most complete
desorp-Table 1.Continued
RT (min)
Compounds Identificationa) SPME coating
DVB/CAR/ PDMS
PDMS/ DVB
CAR/ PDMS
PDMS CW/
DVB PA
37.74 Diethyl malate A, B, C x x x x x x
39.07 2,5-Furandicarboxaldehyde A, B, C x x x – – x
44.09 1,3-Octanediol A, C x x x – x x
48.15 DDMP A, C x x x – – x
49.15 2-Ethylhexyl salicylate A, C x x x – x –
52.93 Benzenecarboxylic acid A, C x x – – x –
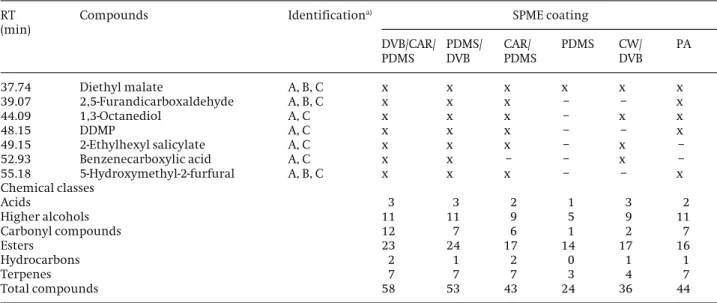
55.18 5-Hydroxymethyl-2-furfural A, B, C x x x – – x
Chemical classes
Acids 3 3 2 1 3 2
Higher alcohols 11 11 9 5 9 11
Carbonyl compounds 12 7 6 1 2 7
Esters 23 24 17 14 17 16
Hydrocarbons 2 1 2 0 1 1
Terpenes 7 7 7 3 4 7
Total compounds 58 53 43 24 36 44
a) The reliability of the identification or structural proposal is indicated by the following: A, structural proposals given on the
basis of mass spectral data (NIST05); B, mass spectrum and retention time consistent with those of an authentic standard; C, mass spectrum consistent with spectra found in the literature.
– Not detected. DDMP: 2,3-dihydro-3,5-dihydroxy-6-methyl-4H-pyran-4-one.
Figure 2.Effect of different fiber coatings on the extraction efficiency of all volatile compounds obtained from PP apple pulp. Error bars represent S.E.M. (n= 3 for each data point).
tion of the analytes, since a longer desorption time may damage the fiber, shortening its life time [29]. The higher number of extracted compounds and lower deviation were also factors taken into consideration.
3.2 Characterization of volatiles in apples (pulp, peel, and entire fruit)
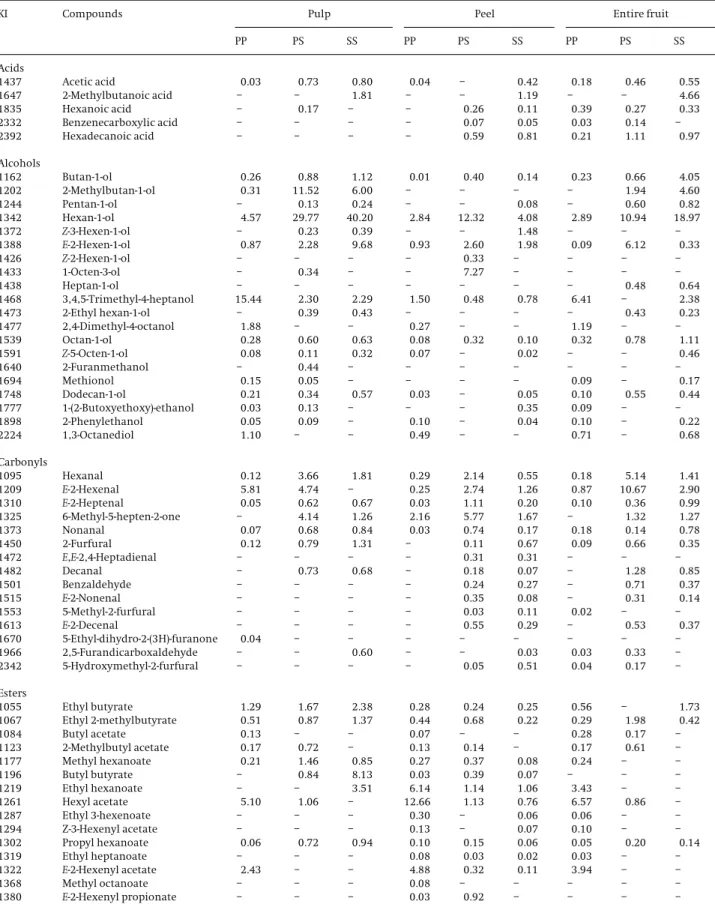
Characterization of VOCs and SVOCs compounds was done with the best HS-SPME methodology conditions on commercialized fruits from different geographical ori-gins of Madeira Islands, bought in 2007. About 100 differ-ent compounds presdiffer-ent in pulp, peel, and differ-entire apple samples from PP, PS, and SSM. domesticaBorkh. species (19 of which were common to PP, PS, and SS entire fruit, 32 to peel and 27 to pulp (see Table 2)), were extracted fol-lowed by GC-qMS analysis and afterward, tentatively identified by matching to US NIST (resemblance percent-age above 80%), by matching calculated RI values to liter-ature values, or by injection of authentic standards. Kovts retention indices were calculated for each peak and compared with the literature in order to certify the compound identification. Typical chromatograms (TIC) obtained from pulp, peel, and entire fruit of PP apples using the HS-SPME/GC-qMS methodology with the opti-mized sampling conditions are shown in Fig. 5. Table 2 lists the VOCs and SVOCs tentatively identified, in the three apple varieties, comprising 39 esters, 20 alcohols, 15 carbonyl compounds, 15 terpenoids, and 5 acids (Table 2). The peels of all three apple varieties presented the higher number of identified compounds, 64, 60, and 64, in PP, PS, and SS, respectively, while the pulp pre-sented the lowest. The number and nature of VOCs and SVOCs varied according apple geographical origin and apple fraction (pulp, peel, and entire fruit). The relative amount percent of the individual components are expressed as percent peak areas relative to total peak areas (RPA%) and are listed in Table 2.
Through a comparative analysis of results shown in Fig. 6 and Table 2, it could be found that the chemical classes that contribute to the total volatile profile of the studied apple samples are terpenes, ethyl esters, and higher
alco-hols.a-Farnesene was on average the most abundant com-pound in all threeM. domesticaBorkh. apple varieties stud-ied. Among ethyl esters which are responsible for a fruity, estery aroma, hexyl 2-methylbutanoate (10.80%), hexyl acetate (4.02%), and ethyl hexanoate (3.52%) contribute to apple aroma characteristics as well as to aroma intensity [30]. Higher alcohols and carbonyls of six carbon atoms, namely hexan-1-ol, E-2-hexenal, and E-2-hexen-1-ol, responsible for the herbaceous odor of several fruits, were also significantly abundant in all apple varieties ana-lyzed. The amount of these compounds was, on average, 14.06, 3.35, and 2.76%, respectively.
The RPA (%) values obtained for the different chemical classes in PP, PS, and SS pulp, peel, and entire fruit sam-ples are illustrated in Fig. 6. Higher alcohols, ethyl esters, carbonyl compounds, and acids represent 45.57, 38.28, 12.59, 7.64, and 1.18%, respectively, of the total volatile fraction in pulp apples. As for peel, the significant contri-bution for the total volatile profile arises from terpenes (50.94%) followed by ethyl esters (23.71%), higher alco-hols (12.94%), carbonyl compounds (7.76%), and acids (1.18%). Finally, for entire fruit samples terpenes, higher alcohols, ethyl esters, carbonyl compounds, and acids accounts for 34.61, 23.27, 19.16, 10.85, and 3.10%, respec-tively, of the total GC peak area of the chromatograms.
PP apple reports the higher content of VOCs and SVOCs compounds, having the most representative volatile pro-file in all matrices relatively to PS and SS samples. The total amounts of PP apple compounds were 65.14 and 5.79% higher than those of the PS and SS apples, respec-tively. Results reported in Table 2 demonstrate that the most prominent constituents found in PP apple pulp were hexyl 2-methylbutyrate (49.05%), 3,4,5-trimethyl-4-heptanol (15.44%), ethyl hexanoate (5.81%), hexyl acetate (5.1%), and hexan-1-ol (4.57%). Relatively to PP apple peel the VOCs and SVOCs with major contribution to their volatile profile are a-farnesene (45.39%), hexyl acetate (12.66%), ethyl hexanoate (6.14%), andE-2-hexen-1-ol ace-tate (4.88%). Concerning PP apple entire fruit these area -farnesene (30.49%), 3,4,5-trimethyl-4-hexyl acetate (6.57%), heptanol (6.41%), and ethyl hexanoate (3.43%). As for PS apple, the major volatile compounds
Table 2.Relative percent amount (RPA%) of volatile compounds of pulp, peel, and entire fruit from PP, PS, and SSM. domestica Borkh. apples obtained by HS-SPMEDVB/CAR/PDMSat the optimal sampling conditions (extraction temperature, 508C; extraction time, 30 min, 800 rpm)
KI Compounds Pulp Peel Entire fruit
PP PS SS PP PS SS PP PS SS
Acids
1437 Acetic acid 0.03 0.73 0.80 0.04 – 0.42 0.18 0.46 0.55
1647 2-Methylbutanoic acid – – 1.81 – – 1.19 – – 4.66
1835 Hexanoic acid – 0.17 – – 0.26 0.11 0.39 0.27 0.33
2332 Benzenecarboxylic acid – – – – 0.07 0.05 0.03 0.14 –
2392 Hexadecanoic acid – – – – 0.59 0.81 0.21 1.11 0.97
Alcohols
1162 Butan-1-ol 0.26 0.88 1.12 0.01 0.40 0.14 0.23 0.66 4.05
1202 2-Methylbutan-1-ol 0.31 11.52 6.00 – – – – 1.94 4.60
1244 Pentan-1-ol – 0.13 0.24 – – 0.08 – 0.60 0.82
1342 Hexan-1-ol 4.57 29.77 40.20 2.84 12.32 4.08 2.89 10.94 18.97
1372 Z-3-Hexen-1-ol – 0.23 0.39 – – 1.48 – – –
1388 E-2-Hexen-1-ol 0.87 2.28 9.68 0.93 2.60 1.98 0.09 6.12 0.33
1426 Z-2-Hexen-1-ol – – – – 0.33 – – – –
1433 1-Octen-3-ol – 0.34 – – 7.27 – – – –
1438 Heptan-1-ol – – – – – – – 0.48 0.64
1468 3,4,5-Trimethyl-4-heptanol 15.44 2.30 2.29 1.50 0.48 0.78 6.41 – 2.38
1473 2-Ethyl hexan-1-ol – 0.39 0.43 – – – – 0.43 0.23
1477 2,4-Dimethyl-4-octanol 1.88 – – 0.27 – – 1.19 – –
1539 Octan-1-ol 0.28 0.60 0.63 0.08 0.32 0.10 0.32 0.78 1.11
1591 Z-5-Octen-1-ol 0.08 0.11 0.32 0.07 – 0.02 – – 0.46
1640 2-Furanmethanol – 0.44 – – – – – – –
1694 Methionol 0.15 0.05 – – – – 0.09 – 0.17
1748 Dodecan-1-ol 0.21 0.34 0.57 0.03 – 0.05 0.10 0.55 0.44
1777 1-(2-Butoxyethoxy)-ethanol 0.03 0.13 – – – 0.35 0.09 – –
1898 2-Phenylethanol 0.05 0.09 – 0.10 – 0.04 0.10 – 0.22
2224 1,3-Octanediol 1.10 – – 0.49 – – 0.71 – 0.68
Carbonyls
1095 Hexanal 0.12 3.66 1.81 0.29 2.14 0.55 0.18 5.14 1.41
1209 E-2-Hexenal 5.81 4.74 – 0.25 2.74 1.26 0.87 10.67 2.90
1310 E-2-Heptenal 0.05 0.62 0.67 0.03 1.11 0.20 0.10 0.36 0.99
1325 6-Methyl-5-hepten-2-one – 4.14 1.26 2.16 5.77 1.67 – 1.32 1.27
1373 Nonanal 0.07 0.68 0.84 0.03 0.74 0.17 0.18 0.14 0.78
1450 2-Furfural 0.12 0.79 1.31 – 0.11 0.67 0.09 0.66 0.35
1472 E,E-2,4-Heptadienal – – – – 0.31 0.31 – – –
1482 Decanal – 0.73 0.68 – 0.18 0.07 – 1.28 0.85
1501 Benzaldehyde – – – – 0.24 0.27 – 0.71 0.37
1515 E-2-Nonenal – – – – 0.35 0.08 – 0.31 0.14
1553 5-Methyl-2-furfural – – – – 0.03 0.11 0.02 – –
1613 E-2-Decenal – – – – 0.55 0.29 – 0.53 0.37
1670 5-Ethyl-dihydro-2-(3H)-furanone 0.04 – – – – – – – –
1966 2,5-Furandicarboxaldehyde – – 0.60 – – 0.03 0.03 0.33 –
2342 5-Hydroxymethyl-2-furfural – – – – 0.05 0.51 0.04 0.17 –
Esters
1055 Ethyl butyrate 1.29 1.67 2.38 0.28 0.24 0.25 0.56 – 1.73
1067 Ethyl 2-methylbutyrate 0.51 0.87 1.37 0.44 0.68 0.22 0.29 1.98 0.42
1084 Butyl acetate 0.13 – – 0.07 – – 0.28 0.17 –
1123 2-Methylbutyl acetate 0.17 0.72 – 0.13 0.14 – 0.17 0.61 –
1177 Methyl hexanoate 0.21 1.46 0.85 0.27 0.37 0.08 0.24 – –
1196 Butyl butyrate – 0.84 8.13 0.03 0.39 0.07 – – –
1219 Ethyl hexanoate – – 3.51 6.14 1.14 1.06 3.43 – –
1261 Hexyl acetate 5.10 1.06 – 12.66 1.13 0.76 6.57 0.86 –
1287 Ethyl 3-hexenoate – – – 0.30 – 0.06 0.06 – –
1294 Z-3-Hexenyl acetate – – – 0.13 – 0.07 0.10 – –
1302 Propyl hexanoate 0.06 0.72 0.94 0.10 0.15 0.06 0.05 0.20 0.14
1319 Ethyl heptanoate – – – 0.08 0.03 0.02 0.03 – –
1322 E-2-Hexenyl acetate 2.43 – – 4.88 0.32 0.11 3.94 – –
1368 Methyl octanoate – – – 0.08 – – – – –
mined in pulp extracts are hexan-1-ol (29.77%), 2-methyl-butan-1-ol (11.52%), and butyl hexanoate (6.31%), in peel
a-farnese (30.57%), hexan-1-ol (12.32%), hexyl 2-methylbu-tyrate (8.51%), and 1-octen-3-ol (7.27%); and then, for juice extracts a-farnesene (16.87%), estragole (15.43%),
hexan-1-ol (10.94%), E-hexenal (10.67%), and hexyl 2-methylbutyrate (9.39%).
Finally in SS apples volatile extracts, 59 compounds were identified, among these 39 were detected in the pulp, 64 in the peel and 50 in the entire fruit. Some of
Table 2.Continued
KI Compounds Pulp Peel Entire fruit
PP PS SS PP PS SS PP PS SS
1392 Butyl hexanoate 0.06 6.31 1.17 0.16 2.76 1.34 0.64 0.70 1.65
1406 Hexyl 2-methylbutyrate 49.05 4.79 1.53 – 8.51 1.37 – 9.39 0.97
1418 Ethyl octanoate 0.17 – – 2.25 0.33 0.30 1.10 – –
1436 Isopentyl hexanoate – – – – 0.32 – – – –
1455 E-2-Hexenyl butyrate 1.31 0.59 0.47 0.60 0.69 0.23 0.56 0.36 0.37
1462 E-2-Hexenyl pentanoate – – – 0.06 1.59 0.37 0.84 – –
1496 Pentyl hexanoate – 0.12 – – 0.56 0.17 – 0.38 0.12
1499 Ethyl 3-hydroxybutyrate 0.34 – – 0.23 – – 0.22 – –
1506 Butyl 2-methylbutyrate – – – – 0.12 – – – –
1530 EthylE-2-octenoate – – – 0.10 0.10 – 0.08 – –
1546 Ethyl 3-(methylthio)-propionate 0.23 – – – – – 0.11 – –
1585 Hexyl hexanoate 0.61 0.97 0.20 0.64 3.47 1.95 1.00 2.51 1.51
1586 Methyl benzoate – – – – – – 0.19 – –
1587 Butyl octanoate – – – 0.04 0.80 0.09 0.02 – –
1610 Ethyl decanoate – – – 0.25 – – 0.19 – –
1635 3-Methylbutyl octanoate – – – – 0.42 – – – –
1639 Ethyl benzoate 0.12 – – 0.16 – 0.10 0.38 – –
1646 E-2-Hexenyl hexanoate – – – 0.14 1.09 – 0.27 – –
1656 Ethyl 3-hydroxyhexanoate 0.09 – – 0.04 – – – – –
1689 Octyl heptanoate – – – – 0.24 – – – –
1722 EthylE -3-(methylthio)-2-prope-noate
0.07 – – 0.16 – – 0.39 – –
1800 2-Phenylethyl acetate – – – 0.07 – – 0.12 – –
1801 Hexyl octanoate – – – – 0.31 0.09 – – –
1831 EthylE,Z-2,4-decadienoate – – – 0.62 – – 0.51 – –
1881 Ethyl 3-hydroxydodecanoate 1.87 – – 0.71 – – 2.20 – 0.28
1932 Diethyl malate 4.27 0.14 0.29 2.62 – 0.39 6.30 – 1.22
2308 Ethyl hexadecanoate – – – 0.03 0.10 0.05 0.20 0.24 0.62
2314 2-Ethylhexyl salicylate – – – 0.05 0.22 0.24 – – –
Terpenes
1148 b-Myrcene – – – 0.07 – – – – –
1170 Limonene – – 0.30 0.34 – – – 0.44 0.44
1531 Linalool – – 0.28 – – – – – 1.22
1573 4-Carvomenthenol 0.18 – – 0.09 – – 0.17 – –
1641 Z-b-Farnesene – – – 0.45 – – 0.23 – 0.18
1645 Estragole – – – – 0.68 0.18 – 15.43 –
1673 b-Ocimene – – – 0.43 – – – – –
1711 Z,E-a-Farnesene – – – 1.91 0.79 1.21 0.33 – 0.75
1735 a-Farnesene 0.05 1.21 0.24 45.39 30.57 67.33 30.49 16.87 30.26
1773 a-Himachalene – – – 0.79 – – 0.06 – –
1802 b-Damascenone 0.06 0.12 0.26 – – – – – 0.19
1814 Isoestragole – 0.07 – – 0.03 0.07 0.12 0.28 –
1844 Geranyl acetone 0.08 0.49 0.24 0.08 0.28 0.13 0.32 1.77 1.56
2309 Farnesal – – – – – 0.30 – – –
2323 Farnesol – – – 0.06 0.49 1.16 0.19 1.37 1.17
Others
1223 Styrene 0.08 1.57 0.36 0.03 0.10 0.09 0.34 – –
1399 N.I.m/z(69, 101, 157) – 9.60 5.23 4.59 0.69 1.13 21.82 – 3.67
1413 p-Ethylstyrene 0.17 0.83 0.60 – – – – 0.31 0.30
1810 N.I.m/z(135, 107) – – – 0.18 – – – – –
1901 N.I.m/z(135, 107) – – – 1.93 0.25 1.09 0.36 – 0.18
Number of identified compounds 46 45 39 64 60 64 65 43 50
RSD (%) 5.14 3.77 8.89 17.69 16.85 5.01 7.51 18.30 8.71
the previous compounds were also identified as major compounds, such as hexan-1-ol (40.2%), E-2-hexen-1-ol (9.68%), and butyl butyrate (8.13%) in pulp samples;a -far-nesene (67.33%) and hexan-1-ol (4.08%) in peel and, finally,a-farnesene (30.26%) and hexan-1-ol (18.97%) in entire fruit samples.
The comparison among the different extracts (pulp, peel, and entire fruit) from PP, PS, and SS apples, leads to the finding that peel extracts have the highest content of volatiles, where a-farnesene (sweet-wood odor) is the major compound accounting with 45.39, 30.57, and 67.33% for the total volatile fraction of PP, PS, and SS
Figure 5.Total ion chromatogram of obtained from pulp, peel, and entire fruit extracts from PP apples obtained by HS-SPMEDVB/ CAR/PDMSat the optimal sampling conditions (508C for 30 min under constant magnetic stirring (800 rpm), 0.1 g of NaCl). Time scale in minutes onx-axis; ion abundance (mV) ony-axis. Peak identification: 1, ethyl butyrate; 2, ethyl 2-methylbutyrate; 3, butyl acetate; 4, 2-methylbutyl acetate; 5, butan-1-ol; 6, methyl hexanoate; 7, 2-methylbutan-1-ol; 8, ethyl hexanoate; 9, styrene; 10, hexyl acetate; 11, ethyl 3-hexenoate; 12,E-2-hexen-1-ol acetate; 13, hexan-1-ol; 14, nonanal; 15,E-2-hexen-1-ol; 16, N.I.m/z (69, 101, 157); 17,E-2-hexenyl butyrate; 18, 3,4,5-trimethyl-4-heptanol; 19, 2,4-dimethyl-4-octanol; 20, ethyl 3-hydroxy butyrate; 21, hexyl hexanoate; 22, ethyl dodecanoate; 23,b-ocimene; 24,Z,E-a-farnesene; 25,a-farnesene; 26,a-himachalene; 27, ethyl 3-hydroxydodecanoate; 28, diethyl malate; 29, 1,3-octanediol; 30, 5-hydroxymethyl-2-furfural; 31, hexadecanoic acid.
apples, as well as in entire fruit extracts with 16.87, 30.26, and 30.49% for PS, SS, and PP, respectively (Table 2). Studies report that its presence on superficial cell layers of apples undergoes peroxidation through a, so far, unknown mechanism, where the peroxidized prod-ucts somehow cause tissue damage and browning on these fruits [31, 32].
The distribution of VOCs and SVOCs between different fractions (pulp, peels, and entire fruit) of PP, PS, and SS apples shows a highly uneven distribution (Fig. 7). Hexan-1-ol, ethyl butyrate and hexyl 2-methylbutyrate, e.g., were associated primarily with the pulp of the stud-ied apples, whereasa-farnesene, hexyl acetate, ethyl octa-noate and a-farnesene, hexanal, ethyl hexadecanoate were found in higher content in peels and entire fruit, respectively. The total PS apples volatile fraction (66.66 and 14.55%) occurred in the peel and pulp, whereas 49.91 and 20.69% of the total PP volatile free fractions were found in the peel and pulp, respectively. For SS apples, 47.11% of the total volatile fraction occurred in peels while only 5.92% was determined in the pulp (Fig. 7).
3.3 Multivariate analysis
By the application of PCA to the normalized relative amounts of all analytical variables (VOCs and SVOCs) and nine objects (apples), were extracted two factors that
explain 81.5% of the total variance of initial dataset. The observation of the loading scores suggests that 13 varia-bles, having coefficients magnitude a0.8, can be removed from the data matrix as they do not contribute to the explanation of data variability. The new variables set (data matrix 8069) account for 89.9% of the total var-iance. The first principal component (PC)1 explains 67.3% of the variance in the initial dataset and the sec-ond PC2 explain 22.6%. Table 3 present the eigenvalues, the percentage of variance and the cumulative percent-age explained by the two first PCs.
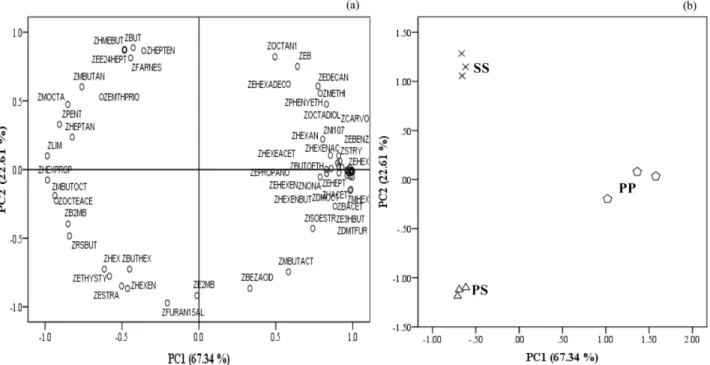
The projections of the samples along the directions identified by the first two PC's, is reported in Fig. 8 where the first PC1 of apples are plotted against the second PC2. The separations among different varieties of apples from this PC1 – PC2 scatter point plot are obvious (Fig. 8b). These figure shows that apples PS and SS were separated by the second PC, while PP apples are most influenced by the variables related with the first PC. The coefficient that defines the weight of the original variable in the PCs can be investigated to understand which chemical com-pounds are responsible for the ranking of wines. Methyl hexanoate (0.999), 3,4,5-trimethyl-4-heptanol (0.998), N.I. m/z (69, 101, 157) (0.998), ethyl hexanoate (0.998), and ethyl octanoate (0.998) were highly loaded on the first PC, while 2,5-furandicarboxaldehyde (0.972), ethyl 2-methylbutyrate (0.918), and butan-1-ol (0.887) were loaded on the second PC explaining most of the variabil-ity (Fig. 8a). PP apples (first quadrant) are essentially char-acterized by ethyl hexanoate, ethyl heptanoate, styrene, ethyl benzoate, and E-2-hexenyl acetate. The SS apples (second quadrant) are strongly associated with hexyl 2-methylbutyrate, E,E-2,4-heptadienal, Z-b-farnesene, and butan-1-ol, while the PS apples (third quadrant) are char-acterized byp-ethylstyrene,E-2-hexenal, estragole, butyl hexanoate, and hexanal.
After PCA, an LDA was applied in order to select an operative classification role for discriminating the three subspecies of apples obtained from different local in Madeira Island. Figure 9 reports a projection of apple spe-cies in 2D space, obtained by the two first discriminate functions that explain 100% of the total variance. Three groups representing each apple species, PP, PS, and SS were clearly observed. According to these results it can
Figure 7. Distribution of VOCs and SVOCs from PP, PS, and SS M. domestica Borkh. apples between pulp, peels, and entire fruit.
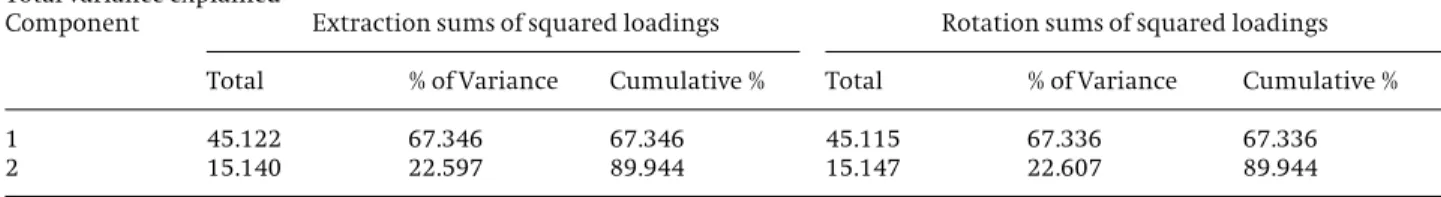
Table 3.Percentage of variance and percentage of cumulative variance explained by the two first extracted PCs
Total variance explained
Component Extraction sums of squared loadings Rotation sums of squared loadings
Total % of Variance Cumulative % Total % of Variance Cumulative %
1 45.122 67.346 67.346 45.115 67.336 67.336
2 15.140 22.597 89.944 15.147 22.607 89.944
be concluded that the proposed HS-SPME/GC-qMS meth-odology is a useful sample technique to distinguish these M. domestica Borkh. apples from different geographic regions based on their volatile profile.
4 Concluding remarks
This study is the first investigation on VOCs and SVOCs present in different apple varieties – PP, PS, and SS, from M. domestica Borkh. species. The optimization of SPME
parameters shows that the use of mixed phase DVB/CAR/ PDMS coating fiber, demonstrated best performance characteristics for a wide range of analytes having differ-ent physic-chemical characteristics, when compared to the other five tested fibers, particularly when the sam-ples were extracted at 508C for 30 min under constant magnetic stirring. The applicability of the SPME tech-nique was evaluated using three apple varieties from Madeira Islands. The optimized HS-SPME/GC-qMS method allows to identify in pulp, peel, and entire fruit of PP, PS, and SS applesca. 100 VOCs and SVOCs from different chemical families, comprising esters, terpe-noids, alcohols, carbonyl compounds, and fatty acids. The number and type of compounds varied according to apple variety and with the constituent parts of the apple. The peels presented the higher number of identified compounds, 64, 60, and 64, for PP, PS, and SS apples while pulp apples presented the lowest, 46, 45, and 39, respectively. The families of compounds with a great con-tribution to the total chromatographic area were the higher alcohols for the PP apples, esters for the PS apples and terpenoids for the PS apples. The obtained datasets were submitted to PCA and the corresponding varieties discriminations of PP, PS, and SS apples were successfully established. The most important contributions to the dif-ferentiation of the three apple varieties were ethyl hexa-noate, hexyl 2-methylbutyrate, E,E-2,4-heptadienal, p -ethyl styrene, andE-2-hexenal. Prediction ability of the calculated model was estimated to be 100% by the “leave-one-out” cross-validation.
Figure 8.PC1 and PC2 scatter plot of the main sources of variability between apple fruit samples. (a) Relation between the chemical classes (loadings); (b) distinction between the samples (scores).
The apples samples were kindly provided by “Direc¼o Regional de Agricultura – Divis¼o de Fruticultura” of Madeira Islands. This research work is also financially supported by Instituto Regional do Emprego (IRE).
The authors declared no conflict of interest
5 References
[1] Mehinagic, E., Prost, C., Demaimay, M.,J. Agric. Food Chem.2004, 52, 5175 – 5182.
[2] Lara, I., Graell, J., Lpez, M. L., Echeverra, G.,Postharvest Biol. Tech-nol.2006,39, 19 – 28.
[3] Dixon, J., Hewett, E. W.,J. Crop Hortic. Sci.2000,28, 155 – 173. [4] Dixon, J., Hewett, E. W.,Postharvest Biol. Technol.2001,22, 71 – 83. [5] Riu-Aumatell, M., Castellari, M., Lpez-Tamames, E., Galassi, S.,
Buxaderas, S.,Food Chem.2004,87, 627 – 637.
[6] Holland, D., Larkov, O., Bar-Ya’akov, I., Bar, E., Zax, A., Brandeis, E., Ravid, U., Lewinsohn, E.,J. Agric. Food Chem.2005,53, 7198 – 7203.
[7] Echeverra, G., Graell, J., Lpez, M., Lara, I.,Postharvest Biol. Tech-nol.2004,31, 217 – 227.
[8] Krokida, M. K., Philippopoulos, C.,J. Food Eng.2006,73, 135 – 141. [9] Ong, B., Nazimah, S., Tan, C., Mirhosseini, H., Osman, A.,
Hashim, D., Rusul, G.,J. Food Compos. Anal.2008,21, 416 – 422. [10] Coelho, E., Perestrelo, R., Neng, N., Cmara, J. S., Coimbra, M.,
Nogueira, J., Rocha, S. M.,Anal. Chim. Acta2008,864, 79 – 89. [11] Kataokaa, H., Lord, L. H., Pawliszyn, J.,J. Chromatogr., A2000,880,
35 – 62.
[12] Mu, R., Wang, X., Liu, S., Yuan, X., Wang, S., Fan, Z., Chromatogra-phia2007,65, 463 – 467.
[13] Rth, E., Berna, A. Z., Beullens, K., Yarramraju, S., Lammertyn, J., Schenk, A., Nicola, B. M.,Postharvest Biol. Technol.2007,45, 11 – 19.
[14] Reis, S. F. A. R., Rocha, S. M., Barros, A. S., Delgadillo, I., Coimbra, M.,Anal. Chim. Acta2009,113, 513 – 521.
[15] Young, J. C., Chu, C. L. G., Lu, X., Zhu, H.,J. Agric. Food Chem.2004, 52, 8086 – 8093.
[16] Saevels, S., Lammertyn, J., Berna, A. Z., Veraverbeke, E. A., Di Natale, C., Nokola, B. M.,Postharvest Biol. Technol.2004,31, 9 – 19.
[17] Hern, A., Dorn, S.,Phytochem. Anal.2003,14, 232 – 240.
[18] Song, J., Gardner, B. D., Holland, J. F., Beaudry, H. M.,J. Agric. Food Chem.1997,45, 1801 – 1807.
[19] Matich, A. J., Rowan, D. D., Banks, N. H.,Anal. Chem.1996,68, 4114 – 4118.
[20] Komes, D., Lovric, T., Ganic, K. K.,LWT2007,40, 1578 – 1586. [21] Ibaez, E., Lpez-Sebastin, S., Ramos, E., Tabera, J., Reglero, G.,
Food Chem.1998,63, 281 – 286.
[22] Ferreira, L., Perestrelo, R., Cmara, J. S.,Talanta2009,77, 1087 – 1096.
[23] Paix¼o, N., Pereira, V., Marques, J. C., Cmara, J. S.,J. Sep. Sci. 2008,31, 2189 – 2198.
[24] Cmara, J. S., Alves, M., Marques, J. C.,Anal. Chim. Acta2006,555, 191 – 200.
[25] Perestrelo, R., Caldeira, M., Rodrigues, F., Cmara, J. S.,J. Sep. Sci. 2008,31, 1841 – 1850.
[26] Caldeira, M., Rodrigues, F., Perestrelo, R., Marques, J. C., Cmara, J. S.,Talanta2007,74, 78 – 90.
[27] Rodrigues, F., Caldeira, M., Cmara, J. S.,Anal. Chim. Acta2008, 609, 82 – 104.
[28] Snchez-Palomo, E., Daz-Maroto, C., Coelho-Prez, M.,Talanta 2005,66, 1152 – 1157.
[29] Zhang, C., Qi, M., Shao, Q., Zhou, S., Fu, R.,J. Pharm. Biomed. Anal. 2007,44, 464 – 470.
[30] Dixon, J., Hewett, E. W.,N. Z. J. Crop Hortic. Sci.2000,28, 155 – 173. [31] Paliyath, G., Whiting, M., Stasiak, M., Mum, D., Clegg, B.,Food
Res. Int.1997,30, 95 – 103.