This paper presents an alternative to estimate the magniier of irst order moments to be applied on each storey of reinforced concrete structures, from the values obtained for the γz and B2 coeficients, used to evaluate second order effects in reinforced concrete structures and in steel struc-tures, respectively. In order to develop the study, initially several reinforced concrete buildings of medium height are processed, in irst order and in second order, using the ANSYS software. Next, γz, B2 and the increase in irst order moments, when considering the second order effects along the height of the buildings, are calculated. Finally, from the results obtained, the magniier of the irst order moments, differentiated for each storey of the structure and calculated from both γz and B2 coeficients, is estimated and the eficiency of the simpliied method of obtaining inal moments using the magniier proposed is evaluated.
Keywords: reinforced concrete, second order effects, γz coeficient, B2 coeficient.
Neste trabalho apresenta-se uma alternativa para estimar o majorador dos momentos de primeira ordem que deve ser aplicado em cada pavi -mento das estruturas de concreto armado, a partir dos valores obtidos para os coeicientes γz e B2, utilizados para avaliar os efeitos de segunda ordem em estruturas de concreto armado e de aço, respectivamente. Para conduzir o estudo, inicialmente diversos edifícios de médio porte de concreto armado são processados em primeira e segunda ordem utilizando o programa ANSYS. Em seguida, são calculados os valores dos coeicientes γz e B2, bem como dos acréscimos sofridos pelos momentos de primeira ordem, quando considerados os efeitos de segunda ordem, ao longo da altura dos edifícios. Finalmente, a partir dos resultados obtidos, estima-se o majorador dos momentos de primeira ordem, diferenciado para cada pavimento das estruturas e calculado a partir de ambos os coeicientes γz e B2, e avalia-se a eiciência do método simpliicado de obtenção dos momentos inais utilizando o majorador estimado.
Palavras-chave: concreto armado, efeitos de segunda ordem, coeiciente γz, coeiciente B2.
Evaluation of second order moments in reinforced
concrete structures using the
γ
z
and B
2
coeficients
Avaliação dos momentos de segunda ordem
em estruturas de concreto armado utilizando os
coeicientes
γ
z
e B
2
D. M. OLIVEIRA a [email protected]
N. A. SILVA b [email protected]
P. M. OLIVEIRA a [email protected]
C. C. RIBEIRO a [email protected]
a Universidade Federal de Minas Gerais, Escola de Engenharia, Deptº de Engenharia de Materiais e Construção, Belo Horizonte, MG, Brasil; b Universidade Federal de Minas Gerais, Escola de Engenharia, Deptº de Engenharia de Estruturas, Belo Horizonte, MG, Brasil.
Received: 22 Dec 2013 • Accepted: 13 Apr 2014 • Available Online: 02 Jun 2014
Abstract
1. Introduction
In recent decades, as in many other areas, engineering has undergone great change, particularly in project engineering and civil construction. Optimization techniques of weight and form, the development of ex-perimental equipment, information technology and eficient numerical models have all contributed to the creation of more economical and streamlined constructions, and higher, more ambitious buildings. Issues which once caused problems for engineers have now taken on fundamental importance in structural projects. Among these is -sues, two which stand out in particular are stability analysis and the evaluation of second order effects.
When one studies structural balance, taking into account the de-formed coniguration, there occurs an interaction between exist -ing forces and displacements, thereby produc-ing additional efforts. In these conditions, the so-called second order effects emerge. These effects can be extremely important in some structures, while in others they may not need to be taken into account.
If the second order effects are signiicant, a second order analysis should be carried out. As this analysis is often incompatible with practical demands such as time considerations, engineers have sought to develop simpliied processes capable of predicting the behavior of structures in the second order.
The coeficients γz and B2, commonly employed in reinforced con -crete and steel structures, may be used to evaluate second order effects and provide an estimate of the inal efforts of a structure – as long as their values do not go beyond certain limits.
At this point, it is worth remarking on an important feature of the coeficient γz: unlike the coeficient B2, it has just one value for the whole structure, although, as various studies (Carmo [1], Lima & Guarda [2] and Oliveira [3]) have shown, second order effects un-dergo variations along the whole height of the building.
This study presents an alternative way of assessing the inal efforts of a structure, including second order effects, using both the coef -icients γz and B2. A range of medium-sized buildings made from reinforced concrete are analyzed in irst and second order using the software ANSYS-9.0, and the simpliied process of assessing inal effort is evaluated, taking into account the variation of second order effects along the whole height of the structures.
2. Classiication of structures in relation
to horizontal displacement
As previously mentioned, second order effects emerge when the study of a structure’s equilibrium is carried out considering the deformed coniguration, in other words, when displacements are taken into account in the analysis. Existing forces interact with the displacements, producing additional internal efforts. Second order efforts induced by the horizontal displacements of the structural joints, when subject to vertical and horizontal loads, are deined as global second order effects.
In some, more stiff structures, the horizontal displacements of the joints are small, and as such, global second order effects have a negligible effect on total efforts. These structures are deined as non-sway structures.
However, in more lexible structures, horizontal displacements are signiicant. As a result, global second order effects represent a sig-niicant proportion of inal efforts and must be taken into account. These structures are deined as sway structures, and, in such
cas-es, a second order analysis must be carried out.
According to the Brazilian standard NBR 6118:2007 [4], if global sec-ond order effects are less than 10% of the correspsec-onding irst order ef -forts, the structure can be classiied as a non-sway structure. If not – if the global second order effects are more than 10% of the correspond -ing irst order efforts – the structure is classiied as a sway structure. The NBR 6118:2007 [4] also states that the classiication of struc -tures can be achieved by means of the coeficient γz, as detailed in the following section.
3
.
Coeficient
γ
z
The NBR 6118:2007 [4] stipulates thatthecoeficientγz, validfor
reticulatedstructuresofatleastfourstoreys, canbedetermined bymeansofalinear, irstorderanalysis, reducingthestiffnessof thestructuralelements, inordertoconsiderphysicalnon-linearity
inanapproximatemanner.
Foranypossibleloadcombination, thevalueofγziscalculatedby meansofthefollowingformula:
(1)
d,tot , 1
d , tot z
M
M
1
1
D
g
-=
– M1,tot,d(irstorder moment) being thesumofall thehorizontal force moments (with designvalues) of thecombination consid-ered, in relation to the base of the structure. This can be ex -pressedasthefollowing:
(2)
M1,tot,d = S
(Fhid
.
hi)
Fhid beingthehorizontalforceappliedtostoreyi(withdesign val-ue) andhi theheightofstoreyi.
– ΔMtot,d(theincreaseinmomentsfollowingtheirstorderanalysis):
thesumoftheproductsofalltheverticalforcesactingonthe struc-ture (with design values), inthe considered combination, by the horizontaldisplacementsoftheirrespectivepointsofapplication:
(3)
ΔM
tot,d=
S
(P
id.
u
i)
Pid beingtheverticalforceactingon storeyi(withdesignvalue),
andui thehorizontaldisplacementofstoreyi.
Ifthisconditionγz ≤ 1.1 is satisied, thestructurewillbeclassiied asanon-swaystructure.
The Brazilian standard NBR 6118:2007 [4] stipulates that total efforts (irst order + second order) can be assessed by additionally increas-ing the horizontal forces of the combination of load to be considered by 0.95γz, as long as gz is less than 1.3. Nonetheless, according to the project of revision of the NBR 6118:2000 [5], thetotaleffortscouldbe obtainedfromthemultiplicationoftheirstordermomentsby0.95γz,
and became the horizontal loadsmagniicationcoeficient.
According to Franco & Vasconcelos [6], the use of γz as a irst or -der moments magniication coeficient provides a good estimate of the results of the second order analysis; the method was applied successfully to tall buildings with γz in the region of 1.2 or more. Vasconcelos [7] adds that this process is valid even for values of γz of less than 1.10, cases in which technical norms allow second order effects to be disregarded.
4. Coeficient
B
2For the evaluation of second order effects in steel structures, AISC/LRFD [8] adopts the approximate method of amplifying the irst order moments by the magniication factors B1 e B2. The sec -ond order bending moment, MSd, must be determined by means of the following formula:
(4)
M
Sd= B
1.
M
nt+ B
2.
M
ltMnt beingthe designbendingmoment, assumingthatthereis no lateral displacementin the structure, and Mlt the design bending momentresultingfromlateraldisplacementoftheframe; bothMnt andMltare obtainedby irstorder analyses. TheB1ampliication coeficientrepresentstheeffectP-δ, relatedtotheinstabilityofthe bar, ortolocalsecondordereffects; B2 considerstheeffectP-Δ, re-latedtotheinstabilityoftheframe, ortoglobalsecondordereffects.
Foreachstoreyofthestructure, thecoeficientB2canbecalcu -latedasfollows:
(5)
å
å
-=
Sd Sd h
0 2
H
N
L
1
1
B
D
ΣNSdbeing thesum total ofthedesignaxial forcesof compres -sionon allthecolumns andother elementsresistanttothe sto-rey’sverticalforces, ∆0h therelativehorizontaldisplacement, Lthe lengthofthestoreyandΣHSdthesumtotalofallthedesign hori-zontalforcesonthestoreythatproduce∆0h.
According to Silva [9], if all in all storeys the coeficient B2 is less than 1.1, the structure can be considered largely resistant to horizontal displacements, and as such, global second order effects need not be taken into account. When the greatest B2 is between 1.1 and 1.4, the approximate method B1-B2 may be used to calculate the bending moment, the other forces (axial force and shear force) being ob -tained directly in the irst order analysis. Finally, a rigorous elasto-plastic second order analysis is recommended in the event that B2 > 1.40. Silva [9] adds that if 1.1 < B2 ≤ 1.2, the bending moments can also be calculated by means of a irst order analysis performed with the horizontal efforts magniied by the greatest B2.
Inshort, asinthecaseofthecoeficientγz, thecoeficientB2con -stitutes an indicator of the importance of global second order effects in a structure. Oliveira [10] developed a formula capable of relating these parameters, which will be analyzed in the following section.
5. Relation
between
the
coeficients
γ
zand
B
2Figure [1] represents a structure composed of three storeys of
equal length (L). The igure also shows the vertical (Pid) and hori -zontal (Fhid) design forces acting on each storey i, together with their respective horizontal displacements (ui).
To calculatetheγz, equation (1), it is necessary to determine the
values of M1,tot,d and ∆Mtot,d. Equations (2) and (3) provide the fol -lowing, respectively:
(6)
×
M
1,tot,d= (F
h1d×
L + F
h2d×
2L + F
h3d×
3L) =
F
h1d×
L + 2 F
h2d×
L + 3 F
h3d×
L
(7)
×
D
M
tot,d= P
1d×
u
1+ P
2d×
u
2+ P
3d×
u
3CoeficientB2, providedbyequation (5), hasadifferentvaluefor each storeyof thestructure. Thus, referring to coeficient B2 of storeyi asB2,i, andtheparts(L ⋅ΣHSd)and(∆0h⋅ΣNSd)as Miand ∆Mi, respectively, thefollowingformulasareobtained:
– 1ststorey
(8)
×
M
1= L
×
(F
h1d+ F
h2d+ F
h3d) =
F
h1d×
L + F
h2d×
L + F
h3d×
L
(9)
×
D
M
1= (u
1– 0)
×
(P
1d+ P
2d+ P
3d) =
P
1d×
u
1+ P
2d×
u
1+ P
3d×
u
1(10)
(
)
1, 2 1 1 1 1 1 1 1, 2 1 1 1, 21
1
1
B
M
M
M
M
M
M
B
M
M
B
D
Þ
=
-
D
Þ
-
D
=
-=
– 2nd storey:
(11)
M
2= L
×
(F
h2d+ F
h3d) = F
h2d×
L + F
h3d×
L
(12)
D
M
2= (u
2– u
1)
×
(P
2d+ P
3d) =
P
2d×
u
2+ P
3d×
u
2– P
2d×
u
1– P
3d×
u
1(13)
(
)
2, 2 2 2 2 2 2 2 2, 2 2 2 2, 2B
M
M
M
M
M
M
1
B
M
M
1
1
B
Þ
=
-
Þ
-
=
-=
D
D
D
– 3rd storey:
(14)
M
3= L
×
(F
h3d) = F
h3d×
L
(15)
D
M
3= (u
3– u
2)
×
(P
3d) = P
3d×
u
3– P
3d×
u
2(16)
(
)
3, 2 3 3 3 3 3 3 3, 2 3 3 3,2
M
M
B
M
M
M
M
1
B
M
M
1
1
B
Þ
-
=
-=
Þ
-=
D
D
D
Adding M1, M2 and M3, equations (8), (11) and (14), and ∆M1, ∆M2
and ∆M3, equations (9), (12) and (15), results in the following:
(17)
M
1+ M
2+ M
3= F
h1d×
L + 2F
h2d×
L + 3F
h3d×
L
(18)
D
M
1+
D
M
2+
D
M
3= P
1d×
u
1+ P
2d×
u
2+ P
3d×
u
3A comparison of equations (17) and (18) with (6) and (7) can be expressed as follows:
(19)
M
1,tot,d= M
1+ M
2+ M
3(20)
D
M
tot,d=
D
M
1+
D
M
2+
D
M
3Substituting equations (19) and (20) in equation (1), the coeficient γzisdeinedasfollows:
(21)
1
3 2 1 3 2 1 zM
M
M
M
M
M
1
=
+
+
+
+
-=
3 2 1 3 2 1 3 2 1M
M
M
)
M
M
M
(
)
M
M
M
(
1
+
+
+
+
-+
+
D
D
D
D
D
D
g
)
(
)
(
)
(
M
1M
1M
1 2 2M
2 3M
3M
3M
M
M
z
=
-
D
+
+
-
D
+
+
-
D
g
Inverting equation (21) provides the following:
(22)
3 2 1 3 3 2 2 11
)
(
)
(
)
(
1
M
M
M
M
M
M
M
M
M
z
+
+
D
-+
D
-+
D
-=
g
Substituting equations (10), (13), (16) and (19) in equation (22) provides the following:
(23)
, ,1 3 , 2 3 2 , 2 2 1 , 2 11
1
M
B
M
B
M
B
M
z d tot z 3 , 2 , , 1 3 2 , 2 , ,1 2 1, 2 , ,1 1B
M
M
B
M
M
B
M
M
d tot d tot d tot×
+
×
+
×
=
Þ
+
+
=
g
g
Finally, equation (23) may be expressed as follows:
(24)
3 , 2 3 2 , 2 2 1 , 2 1 zB
c
B
c
B
c
1
=
+
+
Withtheconstantsc1, c2 andc3 beingprovidedbythefollowing:
(25)
d 3 h d 2 h d 1 h d 3 h d 2 h d 1 h d, tot ,1 11
M
M
F
F
L
L
2
F
F
L
L
3
F
F
L
L
c
d 3 h d 2 h d 1 h d 3 h d 2 h d 1 hF
3
F
2
F
F
+
F
+
F
+
+
=
×
+
×
+
×
×
+
×
+
×
=
=
(26)
d 3 h d 2 h d 1 h d 3 h d 2 h d, tot ,1 22
M
M
F
L
F
2
F
L
F
L
3
L
F
L
c
d 3 h d 2 h d 1 h d 3 h d 2 hF
3
F
2
F
F
+
F
+
+
=
×
+
×
+
×
×
+
×
=
=
(27)
d 3 h d 2 h d 1 h d 3 h d, tot ,1 33
M
M
F
L
2
F
F
L
L
3
F
L
c
d 3 h d 2 h d 1 h d 3 hF
3
F
2
F
F
+
+
=
×
+
×
+
×
×
=
=
Therefore, inastructureconsistingofnstoreys, thecoeficientγz maybe calculated withreferencetotheB2coeficient inthe fol-lowingmanner:
(28)
å
==
n i i i zB
c
1 2,1
g
and(29)
å
å
= =×
=
n 1 j hjd n i j hjd iF
j
F
c
6. Numerical applications
In conducting the study, ten medium-sized buildings made from reinforced concrete (the storey types of which are dealt with in Oliveira [10]) were processed in irst and second order. Table [1] lists the main characteristics of the structures analyzed.
The buildings were processed for vertical actions (consisting of permanent loads and accidental load), acting simultaneously with horizontal loads (corresponding to the action of the wind, in the directions parallel to the axes X and Y, and calculated according to the requirements of Brazilian standard NBR 6123:1988 [11]). The coeficients applied to the actions, deined by means of the ultimate normal combination that considers the wind as the main variable action, were determined according to the requirements of Brazilian standard NBR 6118:2007 [4].
The structures were analyzed using three-dimensional models in the software ANSYS-9.0. The bar element “beam 4” was used to represent the columns and beams. It provides six degrees of free-dom in each node: three translations and three rotations, in the directions X, Y and Z.
It is worth reiterating that the buildings were processed in second order by means of a non-linear geometric analysis, reducing the stiffness of the structural elements in order to consider physical non-linearity in a simpliied manner (the values adopted were equal to 0.8 Ic for the columns and 0.4 Ic for the beams, Ic being the moment of inertia of gross concrete section).
6.1 Results obtained
Initially, with the results of the irst order analysis, the coeficients γzand B2 were calculated for all the buildings, in the directions X
Table 1 – Main characteristics of the buildings analysed
Building of storeysNumber Ceiling height(m) Number
of slabs of beamsNumber of columns Number (MPa)fck
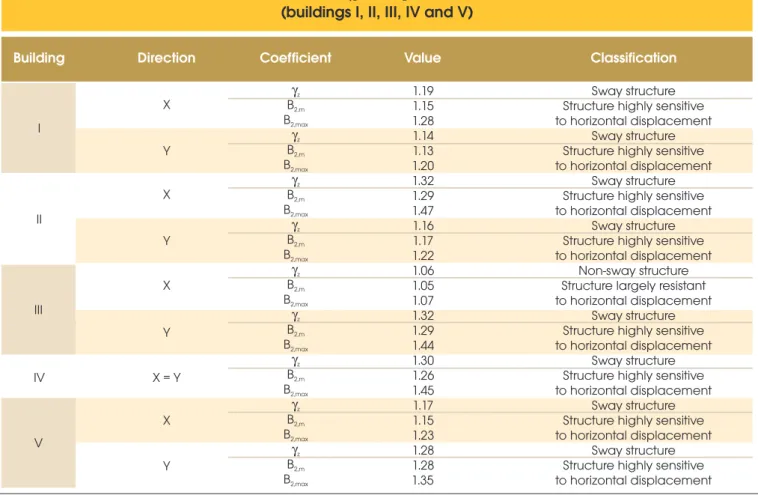
and Y. Tables [2] and [3] present the values obtained, along with classiications of the structures, in both directions. However, in the case of coeficient B2, only the mean (B2,m) and maximum (B2,max) values of the storeys are presented. Again, it is noteworthy that for Silva [9], a structure can be considered largely resistant to hori -zontal displacement if, in all its storeys, the coeficient B2 does not
exceed the value of 1.1. If B2 exceeds this value in one storey or more, the structure will be considered highly sensitive to horizontal displacement. Thus, the classiication of buildings is carried out by analyzing the value of B2,max which is obtained.
In tables [2] and [3] it can be observed that in all cases, the coef -icients γz e B2 provide the same classiication for the structures. Moreover, the values of γz and B2,m are extremely close, with the greatest difference, corresponding to direction X in building I, being around 3.4%. It is also remarkable that in nearly 17% of cases, B2,m was superior to γz.
6.1.1 Assessment of γz as magniication coeficient of irst
order efforts (bending moments, axial and shear forces), in
obtaining inal efforts
The relation between the efforts obtained by the second and irst order analyses, in directions X and Y, was calculated for all storeys of each building.
Theonlyeffortstakenintoaccountintheanalysisarethosewhich
are relevant intermsofstructural dimensioning. Inother words,
the bending moments and axial forceswere considered forthe
columns; andthebendingmomentsandshearforcesinthecase ofthebeams.
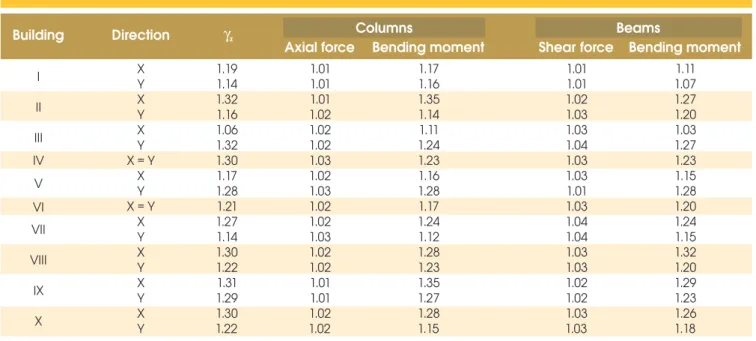
Table [4] contains theaverageresultsofthestoreys, alongwith the valuesfor coeficient γzfor each building, in the directions X and Y. One may thus compare the increases in the irst order ef -forts, when second order effects are considered,andtheincreases predictedbycoeficientγz.
In table [4] it can be observed that, for all buildings and in both di-rections, the average increases obtained in the case of axial force in the columns and of shear force in the beams are very small (between 1% and 4%) – in general, far smaller thantheincreases predictedbyγz. Therefore, inpracticalterms, themagniicationof these forces by the coeficient γzis not necessary, even when the value it represents may be high (as in the case of building II, in direction X).
In table [4], it can also be observedthattheaverage increases display close proximityinrelationtoγz for thebendingmoment
in the columns and beams. In the case of the bending moment
of the columns, the greatest difference between the average increases and those predicted by γz is close to 6% (building III, direction Y) in favor of safety. For the bending moment of the beams, the greatest difference (building I, direction X) is 6.7%, also in favor of safety. Nonetheless, considering only those cases
Table 2 – Values of the coefficients
g
zand B , and classification of the structures
2(buildings I, II, III, IV and V)
Building Direction Coefficient Value Classification
I
II
III
IV
V
X
Y
X
Y
X
Y
X = Y
X
Y
gz
B2,m
B2,max
gz
B2,m
B2,max
gz
B2,m
B2,max
gz
B2,m
B2,max
gz
B2,m
B2,max
gz
B2,m
B2,max
gz
B2,m
B2,max
gz
B2,m
B2,max
gz
B2,m
B2,max
1.19 1.15 1.28 1.14 1.13 1.20 1.32 1.29 1.47 1.16 1.17 1.22 1.06 1.05 1.07 1.32 1.29 1.44 1.30 1.26 1.45 1.17 1.15 1.23 1.28 1.28 1.35
Sway structure Structure highly sensitive to horizontal displacement
Sway structure Structure highly sensitive to horizontal displacement
Sway structure Structure highly sensitive to horizontal displacement
Sway structure Structure highly sensitive to horizontal displacement
Non-sway structure Structure largely resistant to horizontal displacement
Sway structure Structure highly sensitive to horizontal displacement
Sway structure Structure highly sensitive to horizontal displacement
Sway structure Structure highly sensitive to horizontal displacement
Table 3 – Values of the coefficients
g
zand B , and classification of the structures
2((buildings VI, VII, VIII, IX and X)
Building Direction Coefficient Value Classification
X Y X Y X Y X = Y
X Y gz B2,m B2,max gz B2,m B2,max gz B2,m B2,max gz B2,m B2,max gz B2,m B2,max gz B2,m B2,max gz B2,m B2,max gz B2,m B2,max gz B2,m B2,max 1.21 1.18 1.31 1.27 1.25 1.40 1.14 1.14 1.18 1.30 1.28 1.44 1.22 1.20 1.30 1.31 1.34 1.47 1.29 1.30 1.38 1.30 1.30 1.44 1.22 1.18 1.34 Sway structure Structure highly sensitive to horizontal displacement
Sway structure Structure highly sensitive to horizontal displacement
Sway structure Structure highly sensitive to horizontal displacement
Sway structure Structure highly sensitive to horizontal displacement
Sway structure Structure highly sensitive to horizontal displacement
Sway structure Structure highly sensitive to horizontal displacement
Sway structure Structure highly sensitive to horizontal displacement
Sway structure Structure highly sensitive to horizontal displacement
Sway structure Structure highly sensitive to horizontal displacement VI
VII
VIII
IX
X
Table 4 – Coefficient
g
zand average values of relation
(second order effort/first order effort)
Building Direction Columns Beams
Axial force Bending moment Shear force Bending moment
g
z I II III IV V VI VII VIII IX X X Y X Y X Y X = YX Y X = Y
in whichthemagniicationbyγz isagainstsecurity, themaximum differencesarelessthan 5% forthe bending moment of the col-umns (building III, direction X) and 4% for the same moment in the beams (building II, direction Y).
Therefore, it can be afirmed that the calculation of the inal mo -ments (irst order + second order), by means of the magniication oftheirstordermomentsbyγz,issatisfactory. However, the pres-ent study is concerned only with structures which provide maxi-mum values for γz in the region of 1.3; in other words, structures for which the simpliied process of evaluation of inal effortsusing thecoeficientγzisstillvalid, accordingtotheBrazilianstandard
NBR 6118:2007 [4]. Moreover, the average increases of the structures were considered as a whole, without taking into ac -count the variation of second order effects along the whole height of the buildings, as reported in various studies (Carmo [1], Lima & Guarda [2] and Oliveira [3]). This means that if only the coef-icientγzisusedasamagniier ofirstordermoments, theinal momentsmaybeunderestimatedforsomestoreys, and overes-timatedforothers.
Therefore, a better estimate for theinal moments can be ob-tainedusingalsothecoeficientB2, whichiscalculatedforeach storeyofthestructure, andtheaveragevalueofwhichis close to γz. The magniier of the irst order moments would thus be differentforeachstoreyiofthestructure, andprovidedby(B2,i / B2,m)⋅γz. This methodthus takesintoaccountboth theabilityof coeficientγztoobtaintheinalaveragemomentsofthestoreys,
aswell asthe ability of coeficientB2 to take into account the variation of second order effects along the whole height of a building. Theeficacyofthismethod, whenappliedtobuildings ofreinforcedconcrete, willbeevaluatedinthenextsection.
6.1.2 Study of the variation of second order effects with the height of the storeys in the buildings
With the results of the irst order analysis, the estimated magniier of the irst order moments was calculated by means of the follow -ing formula:
(30)
z m
i
est
B
B
g
g
=
×
, 2
, 2
As mentioned above, the relation between the moments obtained by the second and irst order analyses was also calculated for col-umns and beams, along the whole height of the buildings, and in directions X and Y.
This relation between the moments (second order moment/ irst order moment) can be deined as the magniier of the irst order moments, “γ”, since it represents the value by which the irst order moments should be multiplied in order to obtain the inal moments, which include the second order effects. In an ideal situation, in which the magniication of the irst order moments by γestprovides the inal moments with 100% accuracy, the values of γ and γest would coincide for all the storeys of the buildings. In other words, γ /γest = 1 would be true along the whole height of the structure.
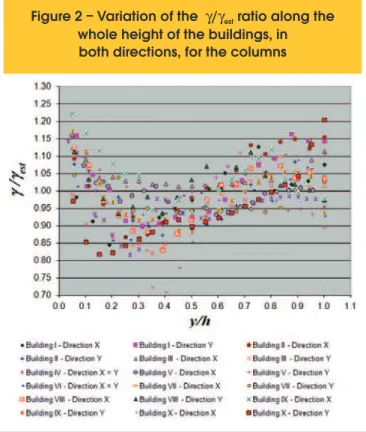
In view of these considerations, the graphs in igures [2] and [3] were produced. They represent the variation of the γ /γestratio alongthewholeheightofallthebuildings, inbothdirections, for
columns and beams, respectively. In these graphs, the axis of theabscissascorrespondstotherelationy/h, whereyrepresents
Figure 2 – Variation of the
g
/
g
estratio along the
whole height of the buildings, in
both directions, for the columns
Figure 3 – Variation of the
g
/
g
estratio along
the whole height of the buildings,
theheightofthestoreytobeconsideredandhthetotalheightof
thestructure.
In igures [2] and [3], it is clear that most of the values for γ /γest are situated between, approximately, 0.85 and 1.10, both in the case of the columns and the beams. It is also clear that it is not possible to evaluate with great accuracy the variation andthe dis-tributionofthevariableγ /γest bymeansofasimpleobservationof igures [2] and [3]. For a more precise assessment of the results obtained, a statistical analysis was carried out, using the software MINITAB-14.
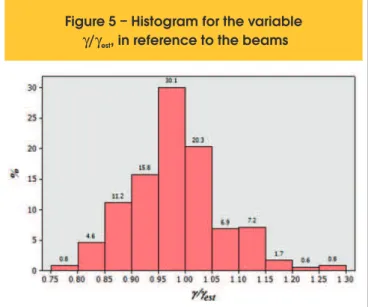
Measurements of central tendency (the mean and the median) and variability (standard deviation, coeficient of variation, mini-mum and maximini-mum) were calculated for the variable used in the study, the relation γ /γest. The results are presented in table [5]. For a graphic representation of the distribution of the variable γ /γest, see the histograms presented in igures [4] and [5], which corre-spond to columns and beams, respectively.
In table [5], it can be observed that the relation γ /γest varies from0.71 to 1.29, with the mean being less than 1.0 in both the columns and the beams. Approximately 50% of the values for
γ /γest arelessthan 0.992 in the case of the columns and 0.973 in the case of the beams. In addition, the variabilityofγ /γestcanbe consideredsmall, since the coeficients of variation obtained are
between 8% and 9%. The coeficient of variation is a measure-ment which expresses variability in relative terms, comparing the standard deviation with the mean, and can be considered small as long as it remains below 30%.
Figure 4 – Histogram for the variable
g
/
g
est,
in reference to the columns
Figure 5 – Histogram for the variable
g
/
g
est, in reference to the beams
Observing the histograms in igures [4] and [5], it can beseenthat theγ /γestratio is less than 1.05 in approximately 77% of instances when considering the columns, and 83% when considering the beams. This means, that in most cases, the magniicationofirst ordermomentsbyγest would produce a maximum error, opposing to safety, of less than 5%. In the case of the columns, the frequen-ciesaregreaterforvaluesofγ /γestbetween 0.90 and 1.05. For the beams, the frequency is greatest in the range 0.95 ≤ γ /γest< 1.00.
7. Final considerations
Thisstudyhaspresentedanalternativemethodofestimatingthe magniication coeficient of irst order momentsto be applied to eachstoreyinreinforcedconcretestructures, bymeansofthe val-ues obtained by the coeficients γz andB2, used toevaluate the second order effects in structures made from reinforced concrete and steel, respectively. Several medium-sized, reinforced concrete buildings were analyzed in both irst and second orders using the computer program ANSYS-9.0, and the simpliied process of obtain -ing the inal moments was assessed, tak-ing into account the varia-tion of second order effects along the whole height of the structures. The γ /γestrelation wasdeined, with “γ” being the magniier of irstordermoments (therelationbetweenthemomentsobtained bysecondandirstorderanalysis, forbothcolumnsandbeams,
along the whole height of the buildings), and γestthe estimated magniierofirstordermoments, differentiatedforeachstoreyiof thestructure, calculatedby(B2,i /B2,m)⋅γz.
Table 5 – Basic descriptive measures for the variable g/g
estVariable Sample size (n) Mean Standard
deviation
Coefficient of
variation (%) Minimum Median Maximum
g
/g
est columnsg
/g
est beams349
Itwasobserved thattheγ /γest relation varied from 0.71 to 1.29, with the mean and median values obtained being less than 1.0, both for the columns and the beams. In addition, in approximately 77% of cases for the columns and 83% of cases for the beams, theγ /γestratiowasless than 1.05. Therefore, for most of the situ-ations analyzed, the magniication of irst order moments by the estimatedmagniierγest wouldproduceamaximumerroropposing tosafety of less than 5%.
Future research in the same area should analyse a greater number of buildings and structures, including larger structures or structures with geometrical irregularities, such as sudden changes of inertia and in the heights between storeys.
8. Acknowledgements
Theauthorsthank theInstitutional ResearchGrant Programfor
RecentlyContractedPhDProfessorsofthePRPq/UFMGforthe
supportprovided.
9. Bibliographical references
[01] CARMO, R.M.S. Efeitos de segunda ordem em edifícios usuais de concreto armado. São Carlos. Dissertação (Mes -trado) – Escola de Engenharia de São Carlos, Universidade de São Paulo, 1995.
[02] LIMA,J.S.; GUARDA, M.C.C. Comparaçãoentreo parâmet-roalfaeocoeicienteγzna análiseda estabilidadeglobal
deedifícios altos. In: CONGRESSO BRASILEIRO DO
CON-CRETO, 41., Salvador. Anais, 1999.
[03] OLIVEIRA, D.M. Parâmetros de instabilidade global das estruturas de concreto armado segundo a nova NBR-6118. Belo Horizonte. Dissertação (Mestrado) – Escola de Engen-haria da Universidade Federal de Minas Gerais, 2002. [04] ASSOCIAÇÃO BRASILEIRA DE NORMAS TÉCNICAS.
NBR 6118 – Projeto de estruturas de concreto – Procedi -mento. Rio de Janeiro, 2007.
[05] ASSOCIAÇÃO BRASILEIRA DE NORMAS TÉCNICAS. Projeto de revisão da NBR 6118 – Projeto de estruturas de concreto. Rio de Janeiro, 2000.
[06] FRANCO, M.; VASCONCELOS, A.C. Practical assessment of second order effects in tall buildings. In: COLOQUIUM ON THE CEB-FIP MC90, Rio de Janeiro. Proceedings, p.307-323, 1991.
[07] VASCONCELOS, A.C. Revisão da NB-1: O problema dos efei -tos de 2ª ordem. Jornal TQS News, n.3, Out., p.10-11, 1996. [08] AMERICAN INSTITUTE OF STEEL CONSTRUCTION –
AISC. Load and resistance factor design speciication for structural steel buildings. Chicago, 1999.
[09] SILVA, R.G.L. Avaliação dos efeitos de 2ª ordem em edifícios de aço utilizando métodos aproximados e análise rigorosa. Belo Horizonte. Dissertação (Mestrado) – Escola de Engen -haria da Universidade Federal de Minas Gerais, 2004. [10] OLIVEIRA, D.M. Estudo dos processos aproximados
uti-lizados para a consideração das não-linearidades física e geométrica na análise global das estruturas de concreto armado. Belo Horizonte. Tese (Doutorado) – Escola de En -genharia da Universidade Federal de Minas Gerais, 2007.
[11] ASSOCIAÇÃO BRASILEIRA DE NORMAS TÉCNICAS.
NBR 6123 – Forças devidas ao vento em ediicações. Rio
![Figure [1] represents a structure composed of three storeys of](https://thumb-eu.123doks.com/thumbv2/123dok_br/18860570.417854/3.892.454.830.271.453/figure-represents-structure-composed-storeys.webp)