Conformity control of concrete is part of a range of control and standard methods which must be employed in all construction work to assure its compliance with quality requirements. The compressive strength of the concrete is considered as a random variable that must be controlled by standardized sampling and testing in order to ensure the structural safety. Therefore, the use of a large amount of compressive strength test results of concretes with similar characteristics has been seen as an important tool in the assessment of current standard norms. This paper de-scribes an analysis based on the conformity control used in large port construction works which have recently been carried out in the Rio Grande Port, located in Rio Grande, RS, Brazil. Statistical analyses were performed and acceptance tests of the product were conducted. They were based on the acceptance criteria of different methodologies from different continents and showed the variations that can occur in the results of the conformity testing, depending on the adopted model. It is worth mentioning that the concrete used in port construction works in the region has been in accordance with current Brazilian norms.
Keywords: concrete, port structures, compressive strength conformity control.
O controle tecnológico do concreto faz parte de uma gama de controles e métodos normalizados que devem ser empregados em todas as obras para a garantia da conformidade deste produto, visto que a resistência à compressão do concreto é considerada uma variável aleatória que deve ser controlada através de amostragem e realização de ensaios padronizados, podendo assim, garantir a segurança da estrutura. Neste sentido, o uso de uma grande quantidade de resultados de controle tecnológico de concreto com características similares apresenta-se como uma im-portante ferramenta no processo de aferição das normas técnicas vigentes. O presente trabalho apresenta uma análise com base no controle tecnológico presente em grandes obras portuárias ocorridas nos últimos anos no Porto do Rio Grande, na cidade de Rio Grande - RS. Foram realizadas análises estatísticas e de aceitação do produto, com base nos critérios de aceitação de distintas metodologias de diferentes
continen-tes, mostrando as variações que podem ocorrer nos resultados dos testes de conformidade dependendo do modelo adotado. Veriicou-se que a
construção das obras portuárias em concreto na região está em conformidade com as normas brasileiras vigentes.
Palavras-chave: concreto, obras portuárias, resistência à compressão, controle tecnológico.
Statistical analysis and conformity testing of concrete
in port construction work
Análise estatística e teste de conformidade do concreto
de obras portuárias
M. C. LARROSSA a [email protected]
M. V. REAL a [email protected]
C. R. R. DIAS a [email protected]
F. C. MAGALHÃES b [email protected]
a Universidade Federal do Rio Grande – FURG; Rio Grande/RS, Brasil; b Instituto Federal do Rio Grande do Sul – IFRS, Rio Grande/RS, Brasil.
Received: 09 Jul 2013 • Accepted: 10 Mar 2014 • Available Online: 02 Jun 2014
Abstract
1. Introduction
The seaport located in Rio Grande, in Rio Grande do Sul state, is one of the busiest ports in Brazil. This seaport has eight pri-vately managed terminals that operate with containers, bulk grain commodities (mainly soybean and wheat), oil, petrochemicals and fertilizers. There are also shipyards for the construction and reno-vation of oil exploration platforms.
In order to meet market requirements, much construction work has recently been carried out in the port area to improve technical characteristics of navigability, increase its ability to receive loads, reduce time spent to load/unload containerized cargo and carry
out a diversii cation of trading activities, as well. Current
construc-tion work comprises the enlargement of the Barra do Rio Grande Breakwater and of the container terminal, besides the construction of the Rio Grande Shipyard.
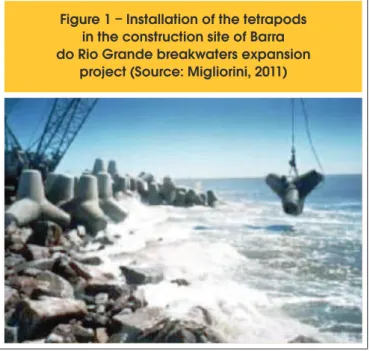
The enlargement of the Barra do Rio Grande Breakwater, with the use of tetrapods, aimed at the improvement of the technical characteristics of the access channel by deepening it; hence, the possibility of increasing the total cargo at the Rio Grande Port. The enlargement of the container terminal led to higher speed in load-ing and unloadload-ing operations. The bottom slab of the dry dock is an important part of the Rio Grande Shipyard ERG1, a major maritime installation whose main purpose is the construction, conversion and repair of offshore units for the oil industry.
The main structures of these construction projects were made of concrete. Therefore, the objective of this paper is to describe the statistical analyses of the results of the acceptance control of the concrete used for the manufacturing of tetrapods at the Barra do Rio Grande Breakwater, the concrete piles in the container termi-nal and the bottom slab in the shipyard dry dock.
Common characteristics of the concrete mixes used for these three construction projects are the compressive strength of 40 MPa at 28 days, the use of specialized concrete production plants in compli-ance with ABNT NBR 7212 (2012) and the use of rigorous quality
of specimens up to their i nal acceptance. Type A preparation
con-dition was used in all cases. The concrete of the dry dock
bot-tom slab and of the tetrapods is classii ed as exposed to class IV
of environmental aggression. The concrete used for the piles of
the container pier was considered to meet the specii cations to be classii ed as class IV in compliance with ABNT NBR 6118 (2007).
These characteristics were adopted because of the high risk of concrete deterioration since the construction sites are near the At-lantic Ocean.
1.1 The Barra do Rio Grande Breakwater
construction project
The Barra do Rio Grande Breakwater was built in order to ensure the navigability of the Rio Grande Access Channel and maintain its characteristics, especially its depth. The breakwater comprises two parallel marine structures which protect the entrance of the channel that takes to the Rio Grande Port: the west jetty is located on Cassino Beach, in Rio Grande, and the east one is located in São José do Norte.
The i rst construction project, which used irregular natural stones,
was completed in 1915. Its enlargement was carried out from 2001 to 2011, with precast concrete blocks weighing 8 and 12.5 tons, called tetrapods, besides natural stones.
Both west and east jetties have been enlarged for 350 and 700 meters, respectively, with about 1.361.000 cubic meters of rock and 12.090 units of tetrapods. The concrete blocks are formed by the intersection geometry of four truncated cones which, according to Migliorini (2011), are simply juxtaposed. They overlap and form almost regular and relatively compact structures.
Figure [1] illustrates the assembly of tetrapods during their instal-lation on site. This paper describes the statistical analyses of the data of the 8 ton concrete tetrapods with the following mix: 418 kg/ m³ cement, additive Glenium 51 ® and Metacaulim (pozzolan) in the proportion of 30 kg/m³ .
1.2 Berth III of Rio Grande Container Terminal
construction project
With the construction of the third berth section, the container ter-minal was 900 meters in length, and could handle three vessels simultaneously from 2008 on. At the same period, the installation of more equipment has made it possible to achieve the goal of reducing the time that vessels spend in the terminal by increasing
handling capacity and the l ow of containerized goods.
The pier structures were made of reinforced concrete, mostly pre-cast, divided into precast prestressed piles and precast structural elements. According to Gireli (2007), the former have hollow a cir-cular cross section, with an inner diameter of 50 cm and an outer diameter of 80 cm, and 48 meters in length. The precast pier
ele-ments have a π cross section. In this study, only the database
of precast prestressed piles will be used. The ones used in the container terminal are shown in Figure [2].
The concrete used for molding the piles had the following mix
specii cations: pozzolanic Portland cement of domestic
manufac-turing (CP-32 RS-IV) in the ratio of 400 kg/m³ and water-cement ratio of 0.40. This cement is resistant to sulfates and complies with
Figure 1 – Installation of the tetrapods
in the construction site of Barra
do Rio Grande breakwaters expansion
the specii cations of the Brazilian norms ABNT NBR 5736 (1991). Crushed stone and natural sand were used as coarse and i ne
aggregates, respectively. Superplasticizer Glenium ® 51 was also employed in the concrete mix.
1.3 Dry dock bottom slab construction project
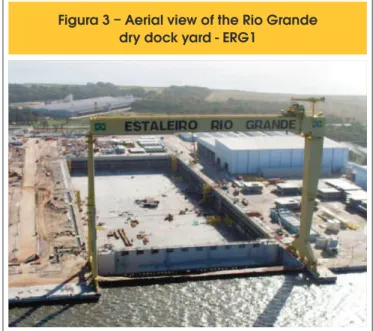
Despite the need for high investment, a dry dock is one of the main parts of a shipyard not only because it makes the addition of blocks to the vessel easy, but also because it is placed on a horizontal plane and allows docking for post-release repairs (Favarin, 2011). The dry dock of the Rio Grande Shipyard interconnects directly to the Patos Lagoon. Its base is situated 13.80 meters below the water level. The dock is drained during the activities of construction and assembly. However, when vessels need to move in or out, it is
l ooded so that they may be l oated in or out.
The dimensions of the bottom slab are 350.00 meters in length, 133.00 meters in width and from 0.56 to 1.00 meter in thickness. These dimensions demanded casting to be performed in parts. According to Larrossa et al. (2011), “ due to its large size, the concrete bottom slab was executed in stages, i. e., with concrete panels; therefore, the occurrence of construction joints, which are pre-programmed and mostly impermeable, is inevitable.”
The concrete was made with Uruguayan cement ANCAP (in the ra-tio of 380 kg/m³), strength class C40, with high similarity to the
clas-sii cation of normal cement Portland CP I, ABNT NBR 5732 (1991). The aggregates (coarse and i ne ones) came from Pelotas, RS. The
polyfunctional additive RheoTec ® 418 and silica fume were also added to the concrete mix. Figure [3] shows this structure.
1.4 Justii cation
Considered as a basic requirement in any structural design of re-inforced or prestressed concrete, the compressive strength is the most common property used as a criterion for material acceptance. However, the compressive strength of concrete is characterized as a random variable with a probability distribution that is a func-tion of material characteristics, the producfunc-tion process, placement,
and others. The inherent variation in acceptance tests of concrete, especially compressive strength, makes it fundamental to use sta-tistical methods for its proper analysis.
This paper describes analyses based on the acceptance control used in large port construction work that has been carried out at the Rio Grande Port, located in Rio Grande, RS, in recent years. Acceptance criteria of different methodologies used in different continents were tested; they show the variations that can occur in the results of compliance tests depending on the adopted model. In addition, efforts that are currently made in the construction in-dustry regarding concrete production in order to meet Brazilian norms are also described.
2. Methodology
The study of concrete quality control was carried out by statistical
Figure 2 – Piles of the pier (Source: FURG)
analysis of the compression test results of specimens at 28 days of age. According to Azevedo and Diniz (2008 ), it is a well-known fact that the compressive strength of concrete depends on the level of quality control exerted in all stages of concrete production. During the analysis, sample specimens are collected along the time of the production process in order to verify if changes and improvement are required to comply with established norms.
In this study, a statistical analysis of the concrete specimen com-pressive strength was performed by determining its mean value,
standard deviation, coeficient of variation, Shewhart control chart
and the validity of Normal and Lognormal probability distributions
by the Kolmogorov-Smirnov goodness-of-it test.
To check the concrete production quality, the acceptance criteria of the Brazilian (ABNT NBR 12655, 2006), American (ACI 318, 2011) and European norms (EN 206-1, 2000) were applied to the three construction sites.
2.1 Mean value
The mean value of the compressive strength of a concrete lot is very important since it is used to calculate the estimated strength parameter (fck) and, consequently, to verify concrete acceptance or rejection parameters. It is calculated by Equation [1].
(1)
icm
f
f
n
=
å
where: n f
cm is the mean value of the concrete compressive strength of
the lot (MPa); n f
i is the compressive strength of the test specimen, (MPa); n n is the number of test specimens.
2.2 Standard derivation
The standard deviation is a suitable measure of the dispersion of the concrete strength in relation to its mean value, playing an im-portant role in most statistical methods (WALPOLE et al., 2009). It is calculated by Equation [2].
(2)
(
)
21
1
ni cm
i
f
f
s
n
=
-=
-å
where:
n s is the standard deviation of the production lot (MPa); n f
cm is the mean value of the concrete compressive strength of
the lot (MPa); n f
i is the compressive strength of the test specimen, (MPa); n n is the number of test specimens.
2.3 Coeficient of variation
The coeficient of variation (CV) measures the degree of disper -sion in the data analysis, indicating the quality control of the pro-duction process. The lower the value of this parameter, the closer to the mean value the results will be and the better the concrete quality will be. It is obtained by Equation [3].
(3)
.100
cms
CV
f
=
Where:
n CV is the coeficient of variation (%);
n s is the standard deviation of the production lot (MPa); n f
cm is the mean value of the concrete compressive strength of
the lot (MPa).
ACI 214 (2002) provides a standardized scale to assess the quality
of the concrete based on the coeficient of variation, as shown in
Table [1].
2.4 Shewhart control charts
The Shewhart control charts were developed by physicist Walter A. Shewhart in 1924 in order to visually show the occurrence of un-usual values and trends in the results. This methodology provides information on the production process that must be interpreted for decision making, thus reducing the risk of non-compliance in
the inal product. Control limits calculated from the data and alert
thresholds based on the variation of the production process are used (HARRISSON and GIBB, 2010).
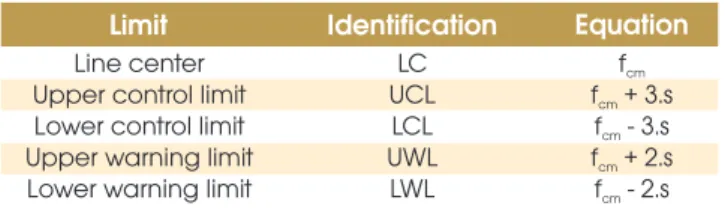
The chart consists of various horizontal lines. A center line (CL) is the reference value of the monitored characteristic. Lines that rep-resent the upper control limit (UCL), the lower control limit (LCL), the upper warning limit (UWL) and the lower warning limit (LWL) may be added. Table [2] shows the calculation of bounds.
2.5 The normal probability distribution
The normal distribution is the most important distribution in
Table 1 – Quality of the concrete according to coefficient of variation for fck > 34.5 MPa (ACI 214, 2002)
Class
Excellent Very good Good Reasonable Bad
Coefficient of variation for different control standards (%)
Test in the work
probability and statistics (WALPOLE et al., 2009). It is represented by a bell-shaped normal curve which adequately describes many phenomena that occur in nature.
According to Devore (2006), the mathematical equation for the probability distribution of the normal variable depends on two pa-rameters, mean and standard deviation. The probability density function of the normal distribution is given by Equation [4].
(4)
(
)
1
21 .2( )2; ,
.
,
2
x
f x
m s
e
s mx
ps
-
-=
-¥ < < +¥
where:
n π = 3.14159….; n e = 2.71828…; n µ = mean value; n σ = standard deviation.
2.6 The lognormal distribution
The lognormal probability distribution is the distribution of a ran-dom variable whose logarithm follows normal distribution. This model has no symmetry in relation to the mean value of the re-sults. This probability distribution has been studied as an alterna-tive to the model proposed by Gauss when it does not provide
ad-equate itness to the results. The lognormal distribution is given
by Equation [5].
(5)
f
X(x)=
1
2
πξ
x
e
-12(
lnx-λξ
)
2
, 0≤x<8
λ
=E(lnx)
ξ
= Var(lnx)
The Kolmogorov-Smirnov goodness-of-it test, for a 95% level of signiicance, was used in this study to determine which one of both distribution models, normal or lognormal, has the better it -ness to the values of compressive strength test results (MAGA-LHÃES, 2009).
2.7 Acceptance of concrete in agreement with
ABNT NBR 12655 (2006)
Brazilian norm NBR 12655:2006 specifies the tests and meth-odologies for the control and acceptance of concrete; ABNT NM 67 (1996) requires the consistency test whereas ABNT NBR 5739 (2007) recommends the compressive strength test. Lots of concrete cylinders are formed by “n” samples depend-ing on the sampldepend-ing method to be used: the partial sampldepend-ing method or the total sampling method. This lot of concrete cyl-inders will represent the concrete volume to be analyzed. The samples consist of two (02) cylinders and the highest of both values obtained by the compressive test is considered the strength of the sample. For the acceptance of the concrete lot in both methods, fck,est must be higher than the fck specified in the structural design.
2.7.1 Concrete statistical control by partial sampling (fck,est1)
The number of cylinders to be molded depends on the mini-mum requirements for the concrete class; for concrete group I (up to C50), at least six (06) pairs. The calculation equa-tions are different, depending on the number of samples, as follows.
a) if the number of samples “n” is such that 6 ≤ n <20,
the estimated characteristic strength is determined by Equation [6]
(6)
1 1 2 1
,
2
...
1
mck est
f
f
f
mf
f
m
-+ -+ -+
=
-Where: n m = n/2; n f
1, f2,..., fm are the strength values of the specimens arranged in
ascending order.
The value of fck,est must not be lower than Ψ6.f1, adopting the Ψ6
coeficient in agreement with the values shown in Table [3] and
depending on the kind of concrete preparation and the number of samples in the lot.
Equation
fcm
f + 3.scm
f - 3.scm
f + 2.scm
f - 2.scm
Table 2 – Control and warning limits for
formulation of Shewhart control charts
Limit
Line center Upper control limit Lower control limit Upper warning limit Lower warning limit
Identification
LC UCL LCL UWL LWL
Equation
fcm
f + 3.scm
f - 3.scm
f + 2.scm
f - 2.scm
Table 3 – Values of
Ψ
6 according to ABNT NBR 12655 (2006)
Condition of preparation
2 3 4 5 6 7 8 10 12 14 ≥16
Number of samples in the lot
b) When the number of elements exceeds twenty, n ≥ 20, the
estimated characteristic strength is given by Equation [7]:
(7)
1
,
1,65.
ck est cm
f
=
f
-
s
2.7.2 Concrete statistical control by total sampling (fck,est2)
Samples are taken from all concrete lots. There are two possibili-ties for the determination of the estimated characteristic strength.
a) If the number of samples is lower than twenty (n ≤ 20), the value
of the estimated characteristic strength is equal to the lowest strength of all test specimens.
b) If n > 20, test results are arranged in ascending order and the estimated value of the characteristic strength is equal to the
strength value that represents the ifth percentile.
2.8 Acceptance of concrete in agreement with
ACI 318 (2011)
American norm ACI COMMITTEE 318 (2011) speciies the rou -tine sampling and manufacturing of molded cylinders that must be cured and tested in standardized procedures. Equations [8] and [9] are used to calculate the estimated compressive strength of con-crete with fck ≥ 35 MPa. The original American notation has been changed to provide better understanding for Brazilian readers.
(8)
4
,
1,34.
cm ck est
f
=
f
+
s
(9)
4 ,
0,90.
2,33.
cm ck est
f
=
f
+
s
Where fck,est4 is the lowest value calculated by both equations.
2.9 Acceptance of concrete in agreement with
EN 206-1 (2000)
European norms recommend the use of compressive tests and require the analysis of the results collected from individuals or from
the average of test results of two or more specimens of a sample produced and tested at the same age. The acceptance of concrete is evaluated by two criteria in the test specimens at the same age: a) Groups of “n” results of consecutive tests of mean compressive
strength of concrete (fcm), with or without overlapping (Criterion 1); b) Each individual test result of concrete compressive strength (fci)
(Criterion 2).
The fck,est5 is calculated in accordance with the criteria adopted in
Table [4].
3. Results and discussion
3.1 Data base
In the case of the concrete used in the 8 ton tetrapods, divided into 14 lots, test results were compiled from 05/24/2008 to 12/26/2008, as shown in Table [5 (b)].
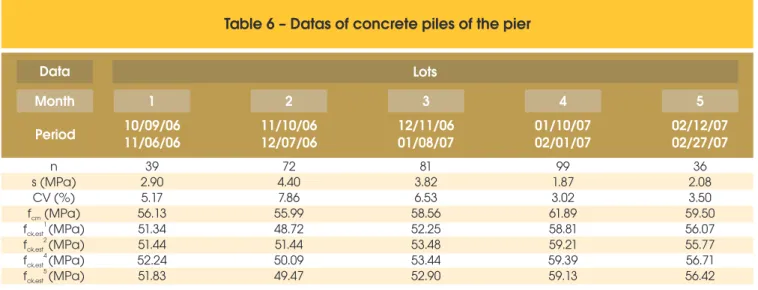
The concrete used in the piles of the pier was produced from
06/09/2006 to 02/27/2007; data were grouped into ive lots for
analysis, as shown in Table [6].
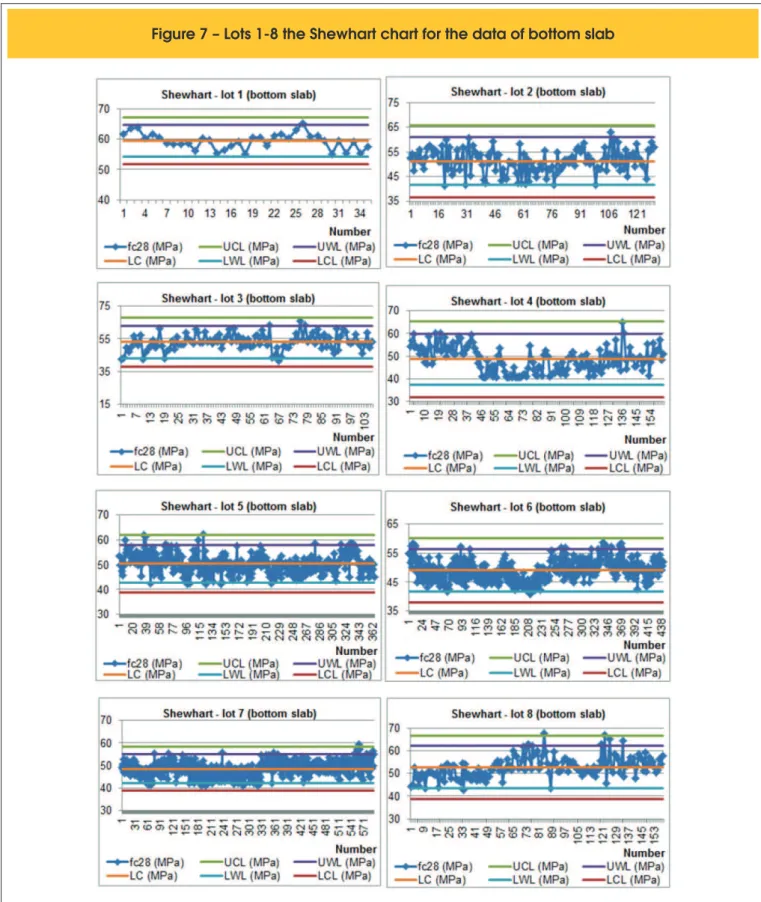
In the case of the concrete of the bottom slab, specimens were molded from 11/27/2008 to 10/11/2009 and tests were carried out from December 2008 to December 2009. The data were organized into thirteen lots, as shown in Table [7 (b)].
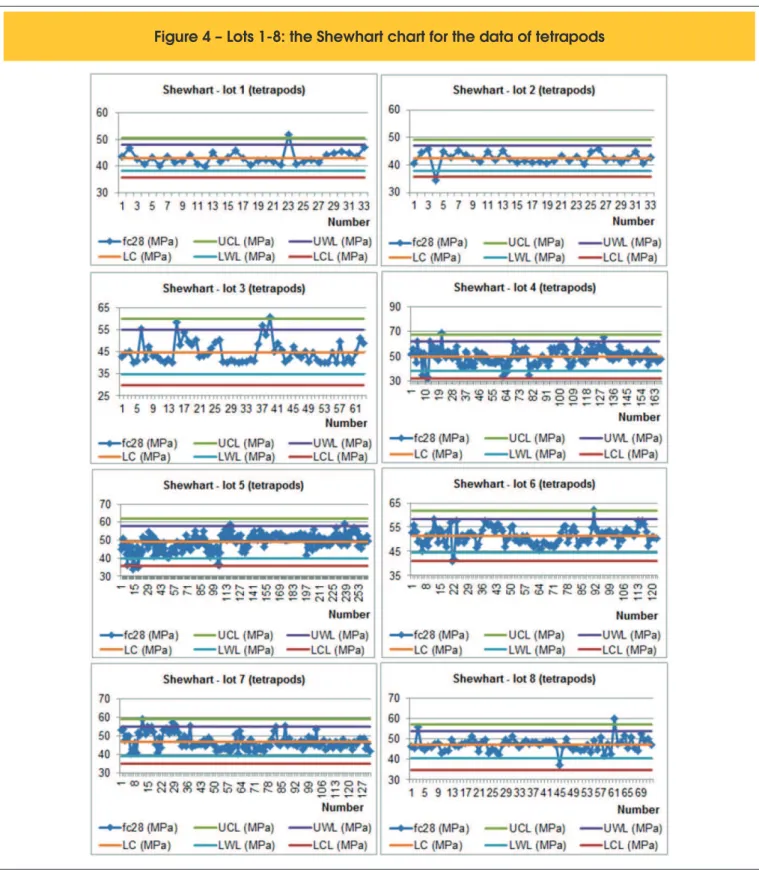
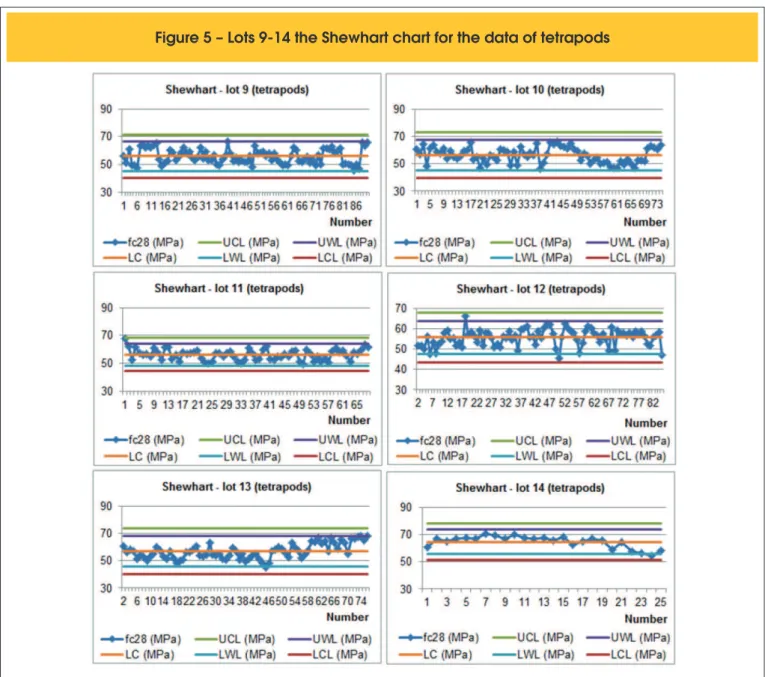
3.2 Statistical analysis
Following the classiication of ACI-214 (2002), the coeficients of variation of concrete are mostly classiied into excellent, very
good or good whereas a few lots are considered reasonable. The analysis which employed Shewhart charts shows points out of the warning limits, although there are some points outside the control limits in the three data groups. The last six lots (lots 9-14) of the tet-rapod concrete had the highest mean values, i.e., higher values for the central parameter of the graphs, resulting in higher values for the control and warning limits. Lot 10 was the only set of samples that did not exceed any limit. Control limits were exceeded in eight
cases by 1.299, about 0.62 %, while the alert limits were exceeded by 38 points, resulting in 2.93 %.
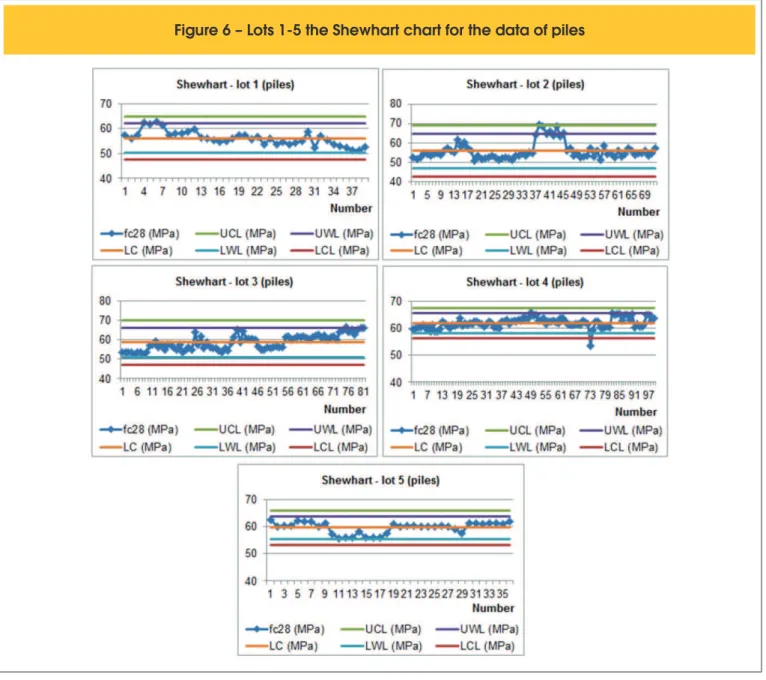
The concrete of the piles of the container terminal showed two
cases of 327 points, about 0.61%, beyond the control limits, while
the upper warning limit was surpassed by eleven points, resulting
in 3.36%. Lot 5 did not have values above or below the limits, while
the others had different characteristics; lot 4 surpassed the lower control limit and lot 2 surpassed the higher control limit.
Regarding the compressive test results of specimens of the dry dock bottom slab, totaling 4871 samples, seven points exceeded
the upper limit in ive lots (one point in lots 4, 7 and 10; two points
Table 4 – Acceptance of concrete according to EN 206-1 (2000)
Production
Average of “n” results (f ) MPacm Any individual test result (f )MPaci Number “n” of test results of
compressive strength in the group Criteria 1 Criteria 2
Initial
Continuous ≥153 ≥ f + 1.48.s≥ f + 4ckck
≥ f – 4.00ck
Table 5 (a e b) – Datas of concrete tetrapods (a – lots 1 ao 7 e b – lots 8 ao 14)
Period Period 05/24/08 06/08/08 09/13/08 09/28/08 06/09/08 06/24/08 09/29/08 10/14/08 06/25/08 07/10/08 10/15/08 10/30/08 07/11/08 07/26/08 10/31/08 11/15/08 07/27/08 08/11/08 11/16/08 12/01/08 08/12/08 08/27/08 12/02/08 12/17/08 08/28/08 09/12/08 12/18/08 12/26/08 Data Data Lots Lots Fortnight Fortnight 1 8 2 9 3 10 4 11 5 12 6 13 7 14 a b n s (MPa) CV (%) f (MPa)cm1 fck,est(MPa)
2 fck,est(MPa)
4 fck,est(MPa)
5 fck,est(MPa)
n s (MPa) CV (%) f (MPa)cm
1 fck,est(MPa)
2 fck,est(MPa)
4 fck,est(MPa)
5 fck,est(MPa)
33 2.50 5.79 43.09 38.97 40.00 39.74 39.39 72 3.23 6.85 47.14 41.82 42.65 42.82 42.37 33 2.26 5.32 42.47 38.74 40.20 39.44 39.12 90 5.26 9.42 55.83 47.15 48.89 48.42 48.05 63 5.04 11.26 44.76 36.45 40.00 36.69 37.31 74 5.56 9.89 56.23 47.06 46.98 48.08 48.00 167 5.94 11.97 49.63 39.83 41.37 39.77 40.84 68 3.95 7.02 56.25 49.73 50.51 50.95 50.40 262 4.42 9.05 48.84 41.55 41.25 42.83 42.30 84 4.08 7.33 55.59 48.87 48.10 50.13 49.56 122 3.48 6.79 51.32 45.57 46.73 46.65 46.16 75 5.51 9.70 56.84 47.74 48.38 48.88 48.68 131 4.02 8.59 46.84 40.20 41.63 41.45 40.89 25 4.42 6.84 64.55 57.27 56.30 58.64 58.02
Table 6 – Datas of concrete piles of the pier
Period 10/09/0611/06/06 11/10/0612/07/06 12/11/0601/08/07 01/10/0702/01/07 02/12/0702/27/07
Data Lots
Month 1 2 3 4 5
n s (MPa) CV (%) f (MPa)cm
1
fck,est(MPa)
2
fck,est(MPa)
4
fck,est(MPa)
5
fck,est(MPa)
Table 7 (a e b) – Datas of concrete bottom slab (a – lots 1 ao 7 e b – lots 8 ao 13)
Period
Period
dec/08 jan/09 feb/09 mar/09 apr/09 may/09 jun/09
Data Data Lots Lots Month Month
1 2 3 4 5 6 7
a
b
n s (MPa) CV (%) f (MPa)cm
1
fck,est(MPa)
2
fck,est(MPa)
4
fck,est(MPa)
5
fck,est(MPa)
n s (MPa) CV (%) f (MPa)cm
1
fck,est(MPa)
2
fck,est(MPa)
4
fck,est(MPa)
5
fck,est(MPa)
35 2.58 4.34 59.45 55.19 55.20 56.00 55.63 130 4.88 9.50 51.33 43.28 42.20 44.40 44.11 106 5.00 9.42 53.03 44.79 43.50 45.99 45.64 162 5.53 11.39 48.55 39.42 40.80 39.62 40.36 364 3.82 7.59 50.39 44.08 44.70 45.27 44.73 441 3.69 7.53 49.07 42.98 43.30 44.12 43.61
jul/09 aug/09 sep/09 oct/09 nov/09 dec/09
8 9 10 11 12 13
158 4.66 8.84 52.79 45.09 45.70 46.54 45.89 414 3.93 7.48 52.52 46.04 44.80 47.25 46.70 609 4.35 8.83 49.26 42.08 42.20 43.43 42.82 892 3.40 7.10 47.98 42.36 42.10 43.42 42.94 807 3.76 7.84 47.95 41.75 42.00 42.91 42.39 160 4.09 8.88 46.02 39.27 40.60 40.54 39.97 593 3.25 6.70 48.52 43.16 42.80 44.16 43.71
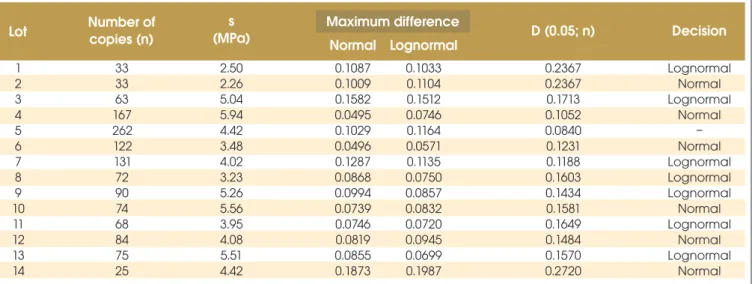
Table 8 – Results of Kolmogorov-Smirnov test for concrete tetrapods
Lot
Normal Lognormal Number of
copies (n)
s
(MPa) Maximum difference D (0.05; n) Decision
in lots 5 and 8) and one point was beyond the lowest limit (lot
13), representing 0.14%. The alert limits were surpassed by ap-proximately 3.16% of the specimens. Figures [4], [5], [6], [7] and
[8] show the Shewhart charts for the lots of concrete under study. In general, both normal and lognormal distributions have shown
good i tness to the values of the concrete compressive strength. The data had a few lots that did not i t satisfactorily into any of
the distributions, but, when the probability distribution failed in the
goodness-of-i t test, the other got the same result. Therefore, both
models could represent the data properly. In the case of most of
D (0.05, n). Tables [8], [9] and [10] show the results of the
good-ness-of-i t test to the concrete tests for the tetrapods, the piles of
the container pier and the dry dock bottom slab, respectively.
3.3 Analysis of the acceptance criteria
As specii ed by the Brazilian norms, the construction projects
un-der study had strict quality control in their construction stages. Dur-ing the construction of the tetrapods and the dry dock bottom slab, total sampling control was applied, while for the concrete used in the container pier piles, partial sampling was used, in agreement with ABNT NBR 12655:2006, for the concrete at 28 days. Regarding the acceptance criterion of Brazilian, North American and European norms, data showed that, for the bottom slab, two of the lots would not comply. Lot 4 would comply neither with ABNT NBR
(2011) whereas Lot 13 would comply neither with ABNT NBR 12655 (2006), the criterion for partial sampling, nor with EN 206-1 (2000). Concerning data on tetrapods, Brazilian (method of partial sam-pling), North American and European norms would show non-conformities in four lots. Lots 1, 2, 3 and 4 would comply neither with ABNT NBR 12655 (2006) (partial sampling) nor with ACI 318 (2011). Lots 1, 2 and 3 would not comply with recommendations issued by EN 206-1 (2000).
The concrete lots of the container terminal piles complied with the three norms under analysis with good margin of safety.
Figures [9], [10] and [11] show that the strength values estimated by ACI 318 (2011) resulted in higher values than the ones issued by other norms, followed by EN 206-1 (2000) and, then, by ABNT NBR 12655 (2006), when the total sampling method is used. It can be explained by the fact that this methodology shows differences in
the dei nition of fck,, by comparison with the Brazilian and European models. For the composition of the equations of ACI 318 (2011), 9
% of the values may be lower than the value of fck,, unlikely other
norms that consider lower values of 7% and 5 % for EN 206-1
(2000) and ABNT NBR 12655 (2006), respectively.
The statistical analysis showed that all the concretes under study, the dry dock bottom slab, the tetrapods, the container terminal piles met the quality requirements for the compressive strength recom-mended by Brazilian norms at all stages of the production process.
4. Conclusions
The analyses of the coefi cient of variation of the concrete lots
show that good quality control was adopted during the production process and that all lots were accepted.
The application of the Shewhart control charts clearly showed the
sensitivity of this methodology to detect small changes in the re-sults during the production process . Due to the simplicity of its implementation, this type of control chart can be used not only to
control many processes but also to help i nd changes in product
characteristics and verify non-conformities .
To check the acceptance criteria of the norms under study, all 32 lots in three construction projects complied with ABNT NBR 12655 (2006), total sampling criteria , fck ,est2. The i ve lots of concrete of
the container terminal piles were also completely accepted for the criterion of partial sampling fck,est1, the criterion actually used during
the manufacturing process of the concrete.
The criterion for partial sampling by ABNT NBR 12655 (2006) proved to be the strictest one, leading to the rejection of some lots used in the concrete bottom slab and tetrapods whereas ACI 318 (2011) was less strict than the other norms. The crite-ria of the European norm are at an intermediate level between the
Figure 8 – Lots 9-13 the Shewhart chart for the data of bottom slab
Figure 9 – Strength values estimated by
ANBT NBR 12655 (2006), ACI 318 (2011)
e EN 206-1 (2000) of concrete bottom slab
Table 9 – Results of Kolmogorov-Smirnov test for piles of the pier
Lot Normal Lognormal Number of copies (n) s(MPa) Maximum difference D (0.05; n) Decision
1 2 3 4 5 39 72 81 99 36 2.90 4.40 3.82 1.87 2.08 0.2178 0.1603 0.1511 0.1367 0.2267 Lognormal – Lognormal Lognormal – 0.1123 0.2195 0.1220 0.1025 0.2310 0.1032 0.2041 0.1152 0.0995 0.2366
Table 10 – Results of Kolmogorov-Smirnov test of concrete bottom slab
Lot
Normal Lognormal Number of
copies (n)
s
(MPa) Maximum difference D (0.05; n) Decision
1 2 3 4 5 6 7 8 9 10 11 12 13 35 130 106 162 364 441 593 158 414 609 892 807 160 2.58 4.88 5.00 5.53 3.82 3.69 3.25 4.66 3.93 4.35 3.40 3.76 4.09 0.2299 0.1193 0.1321 0.1069 0.0713 0.0648 0.0558 0.1082 0.0668 0.0551 0.0455 0.0479 0.1075 Normal Normal Lognormal Lognormal Lognormal Lognormal Normal Lognormal – Normal – – Normal 0.0801 0.0387 0.0568 0.0671 0.0617 0.0402 0.0384 0.0739 0.0696 0.0261 0.0504 0.0541 0.0582 0.0838 0.0458 0.0556 0.0668 0.0474 0.0370 0.0517 0.0578 0.0722 0.0279 0.0531 0.0540 0.0627
American and Brazilian norms. Even though the application of the European and the American acceptance criteria resulted in the re-jection of some lots, the other values obtained for the estimated concrete compressive strength were higher than those estimated by the criteria of the Brazilian norm.
This study showed the strict control of the concrete produced and used in the structures of the dry dock bottom slab at the Rio Grande Shipyard ERG1, tetrapods used to enlarge the Barra do Rio Grande Breakwater and the piles of third berth on the pier of the Rio Grande Container Terminal. This control contributed to the acceptance of these structures, not only assuring reliability and safety but also generating a database with a large number of ex-perimental results to prove the potential compressive strength of the concrete of these construction projects.
5. References
[01] ACI COMMITTEE 214. Evaluation of Strength Test Results of Concrete (ACI 214R-02). American Concrete Institute, 2002.
[02] ACI COMMITTEE 318. Building Code Requirements for Structural Concrete and Commentary (ACI 318-11). Ameri-can Concrete Institute, 2011.
[03] ASSOCIAÇÃO BRASILEIRA DE NORMAS TÉCNICAS. Ci-mento Portland Comum. NBR 5732. Rio de Janeiro, 1991. [04] ASSOCIAÇÃO BRASILEIRA DE NORMAS TÉCNICAS.
Cimento Portland Pozolânico. NBR 5736. Rio de Janeiro, 1991.
[05] ASSOCIAÇÃO BRASILEIRA DE NORMAS TÉCNICAS.
Figure 11 – Strength values estimated by ANBT
Concreto - Ensaios de compressão de corpos de prova cilín-dricos. NBR 5739. Rio de Janeiro, 2007.
[06] ASSOCIAÇÃO BRASILEIRA DE NORMAS TÉCNICAS. Projeto de estruturas de concreto – Procedimento. NBR 6118. Rio de Janeiro, 2007.
[07] ASSOCIAÇÃO BRASILEIRA DE NORMAS TÉCNICAS. Ex-ecução de concreto dosado em central. NBR 7212. Rio de Janeiro, 2012
[08] ASSOCIAÇÃO BRASILEIRA DE NORMAS TÉCNICAS. Concreto de cimento Portland – Preparo, controle e recebi-mento – Procedirecebi-mento. NBR 12655. Rio de Janeiro, 2006. [09] ASSOCIAÇÃO BRASILEIRA DE NORMAS TÉCNICAS.
Concreto – Determinação da consistência pelo abatimento do tronco de cone. NBR NM 67. Rio de Janeiro, 1996. [10] AZEVEDO, C. P. B.; DINIZ, S. M. C. Estudo probabilístico da
resistência à compressão de concretos utilizados em funda-ções. In: 50º Congresso Brasileiro do Concreto, Anais..., Salvador – BA, 2008.
[11] DEVORE, Jay L. Probabilidade e estatística: para engenhar-ia e ciêncengenhar-ias. Tradução: Joaquim Pinheiro Nunes da Silva. E. Pioneira Thomson Learning. São Paulo, 2006.
[12] EN 206-1. Concrete - Part 1: Speciication, performance,
production and conformity. European Committee for Stan-dardization. 2000.
[13] FARIA, Regina H. Y.; REAL, Mauro V.; DIAS, Claudio R.
R. Trabalho da disciplina de Coniabilidade em Engenharia
Oceânica. 2010. Universidade Federal do Rio Grande. [14] FAVARIN, J. V. R. Metodologia de formulação de
estraté-gia de produção para estaleiros brasileiros. Dissertação de mestrado apresentada à Escola Politécnica da Universidade de São Paulo. Ed. Rev. São Paulo, 2011. Departamento de Engenharia Naval e Oceânica.
[15] GIBB Ian; HARRISON Ton. Use of control charts in the production of concrete. Ed. Rev. MPA/BRMCA – ERMCO. 2010.
[16] GIRELI, Everton Luiz. Concretos pré-fabricados de elevado desempenho da obra do terminal de contêineres do Porto de Rio Grande – Controle de qualidade e os métodos es-tatísticos. Trabalho de conclusão do curso da Engenharia Civil. Departamento de Materiais e Construção da FURG. Rio Grande, 2007.
[17] MAGALHÃES, Fabio Costa. Estudo probabilístico da
re-sistência à compressão e da rere-sistência à tração na lexão
dos concretos utilizados na construção do dique seco do es-taleiro rio grande, no Superporto, em Rio Grande – RS. Dis-sertação de mestrado apresentada à Universidade Federal do Rio Grande. Ed. Rev. Rio Grande, 2009. Programa de Pós-Graduação em Engenharia Oceânica.
[18] LARROSSA, M. C.; MAGALHÃES, F. C.; REAL, M. V. Concreto da laje de fundo do dique seco do Polo Naval do Rio Grande: análise estatística básica. In: 53º Congresso Brasileiro do Concreto, 2011, Florianópolis. Anais. São Pau-lo: IBRACON, 2011. v. 1. p. 1-16.
[19] MIGLIORINI, A. V. Estudo de ibras de aço em blocos de
concreto para a possível utilização em carapaça de molhes. Dissertação de mestrado apresentada à Universidade Fed-eral do Rio Grande. Ed. Rev. Rio Grande, 2011. Programa de Pós-Graduação em Engenharia Oceânica.