ACPD
9, 13235–13269, 2009SVOCs in Singapore’s coastal
environment
J. He and R. Balasubramanian
Title Page
Abstract Introduction
Conclusions References
Tables Figures
◭ ◮
◭ ◮
Back Close
Full Screen / Esc
Printer-friendly Version
Interactive Discussion
Atmos. Chem. Phys. Discuss., 9, 13235–13269, 2009 www.atmos-chem-phys-discuss.net/9/13235/2009/ © Author(s) 2009. This work is distributed under the Creative Commons Attribution 3.0 License.
Atmospheric Chemistry and Physics Discussions
This discussion paper is/has been under review for the journalAtmospheric Chemistry and Physics (ACP). Please refer to the corresponding final paper inACPif available.
The exchange of SVOCs across the
air-sea interface in Singapore’s coastal
environment
J. He and R. Balasubramanian
Division of Environmental Science and Engineering, National University of Singapore, Engineering Drive 4, 117576, Singapore
Received: 17 May 2009 – Accepted: 1 June 2009 – Published: 16 June 2009
Correspondence to: R. Balasubramanian (eserbala@nus.edu.sg)
ACPD
9, 13235–13269, 2009SVOCs in Singapore’s coastal
environment
J. He and R. Balasubramanian
Title Page
Abstract Introduction
Conclusions References
Tables Figures
◭ ◮
◭ ◮
Back Close
Full Screen / Esc
Printer-friendly Version
Interactive Discussion Abstract
Coastal areas are vulnerable to the accumulation of semi-volatile organic com-pounds such as PAHs, OCPs and PCBs from atmospheric inputs. Dry particu-late and wet depositions, and air-water diffusive exchange in the Singapore’s south coastal area, where most of chemical and oil refinery industries are situated in,
5
were estimated. Based on a yearly dataset, the mean annual dry particulate depo-sition fluxes of P
16PAHs,
P
7OCPs and
P
21 PCBs were 1328.8±961.1µg m
−2
y−1, 5421.4±3426.7 ng m−2y−1 and 811.8±578.3 ng m−2y−1, and the wet deposition of P
16PAHs and
P
7OCPs were 6667.1±1745.2 and 115.4±98.3µg m
−2
y−1, respectively. Seasonal variation of atmospheric depositions was influenced by meteorological
condi-10
tions. Air-water gas exchange fluxes had negative values for PAHs, HCHs and DDXs, indicating Singapore’s south coast as a sink for the above-mentioned SVOCs. The relative contribution of each depositional process to the total atmospheric input was assessed by annual fluxes. The profile of dry particulate deposition, wet deposition and gas exchange fluxes seemed to be correlated with individual pollutant’s properties
15
such as molecular weight and Henry’s law constant, etc. For the water column par-titioning, the organic carbon-normalized partition coefficients between particulate and dissolved phases (KOC) for both PAHs and OCPs were obtained. The relationships be-tween KOC of PAHs and OCPs and their respective octanol-water partition coefficient (KOW) were examined. In addition, both adsorption onto combustion-derived soot
car-20
bon and absorption into natural organic matter for PAHs in marine water column were investigated. Enrichment factors in the sea-surface microlayer (SML) of the particulate phase were 1.2∼7.1 and 3.0∼4.9 for PAHs and OCPs, and those of dissolved phase were 1.1∼4.9 and 1.6∼4.2 for PAHs and OCPs, respectively. These enrichment factors are relatively higher than those reported for nearby coastal areas, which are most likely
25
ACPD
9, 13235–13269, 2009SVOCs in Singapore’s coastal
environment
J. He and R. Balasubramanian
Title Page
Abstract Introduction
Conclusions References
Tables Figures
◭ ◮
◭ ◮
Back Close
Full Screen / Esc
Printer-friendly Version
Interactive Discussion 1 Introduction
Semi-volatile organic compounds (SVOCs) such as polycyclic aromatic hydrocarbons (PAHs), organo-chlorine pesticides (OCPs) and polychlorinated biphenyls (PCBs) can be transported widely from their original sources. These three groups of pollutants, PAHs, OCPs and PCBs, have been studied for decades due to their inherent toxicity,
5
persistence and ability to disperse in the environment (Iwata et al., 1993; Jones and De Voogt, 1999; Oskam et al., 2004). These compounds can be introduced into the envi-ronment via the atmosphere, for example, in the emissions of incomplete combustion of fossil fuels (e.g. PAHs), out-gassing from pollutant-containing media such as paints, transformers and capacitors etc. (e.g. PCBs) and by spraying onto soils and vegetation
10
(e.g. OCPs). Major urban and industrial centers increase loadings of SVOCs to pro-ximate sea waters through riverine transport, atmospheric deposition via dry particle deposition, wet deposition, and air-sea gas exchange (McVeety and Hites, 1988; Bidle-man et al., 1995; Park et al., 2002; Fang et al., 2008). In addition to acting as sinks for SVOCs, oceans can act as sources of SVOCs to coastal atmospheres and play
impor-15
tant roles in the global biogeochemistry of SVOCs (Hinckley et al., 1991; Dachs et al., 1999, 2002). Particle-sorbed SVOCs can settle to the ocean surface by dry particle de-position, a uni-directional advective transport process from the atmosphere to the wa-ter, the removal rate by which is a function of the physical and chemical properties of the aerosols and bound pollutants, meteorological conditions and surface characteristics
20
(Wania et al., 1998; Odabasi et al., 1999). In addition, SVOCs are removed from the atmosphere and transported to the waters by precipitation scavenging of atmospheric vapors and particles, which are incorporated into the rain within or below the clouds. After SVOCs are deposited into the bulk seawater, water-column partitioning can affect the distribution of pollutants between the dissolved aqueous and the solid phases and
25
ACPD
9, 13235–13269, 2009SVOCs in Singapore’s coastal
environment
J. He and R. Balasubramanian
Title Page
Abstract Introduction
Conclusions References
Tables Figures
◭ ◮
◭ ◮
Back Close
Full Screen / Esc
Printer-friendly Version
Interactive Discussion
at the air-sea boundary defined operationally as the upper millimeter (1∼1000µm) of the sea surface, has large storage capacity to delay the transport of SVOCs across the interface. This interfacial effect has been reported as the enrichment of contaminants with different physicochemical properties (Hardy, 1982; Chernyak et al., 1996; Wurl et al., 2006a, c).
5
Although a considerable number of studies as mentioned above have been con-ducted to assess the SVOCs exchange between air-sea interface across wide geo-graphical areas, little work has been done to determine the significance of these fate and transfer processes of SVOCs in Southeast Asia. The tropical regions of Asia are considered to be an important source of many SVOCs (Iwata et al., 1994). Those
10
SVOCs with a log KOA of around 8 and a logKOW of around −2 such as PCBs and
OCPs can be classified as “multi-hoppers”, which can volatilize effectively after deposi-tion to either soils and waters and thus undergo “multiple hops” to migrate from tropical to temperate and even polar regions (Wania, 2003). In Southeast Asia, Basheer et al. (2003) have characterized persistent organic pollutants (PAHs, OCPs and PCBs) in
15
Singapore’s northeastern and southwestern coastlines surface seawater, but have not investigated any air-sea exchange processes mentioned above. Wurl et al. (2006a) have studied the distribution of organochlorine compounds (OCs, including OCPs and PCBs) in the SML and subsurface water (SSW) in Hong Kong. Wurl and Ob-bard (2006b) have also determined the occurrence of OCs in the water column of
20
shallow Johor Strait, between Malaysia and northeastern Singapore, by short-term measurements; in addition, Wurl et al. (2006c) have investigated the role of the SML in air-sea gas exchange of OCs by snapshot sampling in the same sites of Johor Straits. However, the latter work by Wurl et al. (2006c) was just focused on diffusive exchange, one of the air-sea exchange processes only.
25
ACPD
9, 13235–13269, 2009SVOCs in Singapore’s coastal
environment
J. He and R. Balasubramanian
Title Page
Abstract Introduction
Conclusions References
Tables Figures
◭ ◮
◭ ◮
Back Close
Full Screen / Esc
Printer-friendly Version
Interactive Discussion
which are predominantly land-based. Singapore, a representative country of South-east Asia, is a small but highly developed island with dense industrial parks in the Southwestern part, where the terrestrial sources affect the surrounding coasts. In this study, Singapore’s Southern coastline was chosen during the Northeast monsoon sea-son to evaluate if this coastal area is a sink or source for selected SVOCs via air-sea
5
diffusive exchange as well as to investigate the SML enrichment effect. Furthermore, the water-column partitioning was assessed by a short-term measurement on different aquatic particulate matrices in the ocean.
2 Theoretical approach
Atmospheric sampling was conducted in this study for each event in a consistent
man-10
ner (24 h at 250 L min−1); weekly concentrations of SVOCs in the atmosphere were computed as arithmetic mean values. In the case of rainwater, the rainfall amount for each event varied. Hence, those concentrations were calculated as volume-weighted mean (VWM) values.
Dry particulate and wet deposition flux can be calculated according to
15
Fdry(µg m
−2
yr−1
)= 12
X
i=1
(CAi ×Vd ×2592) (1)
Fwet(µg m
−2
yr−1
)= 12
X
i=1
(CiVWM×Pi
W ×10
−3
) (2)
whereCiA,CVWMi are the monthly particulate concentration of pollutant in air (ng m−3) and monthly total (dissolved plus particulate) concentration of pollutant in rain (ng L−1), respectively;Vd is the deposition velocity (ms−1) and PWi is the rainfall (mm) for
sam-20
ACPD
9, 13235–13269, 2009SVOCs in Singapore’s coastal
environment
J. He and R. Balasubramanian
Title Page
Abstract Introduction
Conclusions References
Tables Figures
◭ ◮
◭ ◮
Back Close
Full Screen / Esc
Printer-friendly Version
Interactive Discussion
of a number of resistances (Seinfeld and Pandis, 2006) using the following equation.
Vd = 1
Ra+Rb+RaRbvs +vs (3)
wherevs is the gravitational settling velocity (a function of particle size, density, and viscosity),Ra is aerodynamic resistance refers to turbulent transport from the free at-mosphere down to the receptor surface (Ra=9/[uσθ2], which is a function of wind speed,
5
uand standard deviation of wind speed,σθ(Turner, 1986) andRbis quasi laminar layer resistance, which is a function of particle size, Brownian diffusion, interception and im-paction; Rb on water surface is given by van den Berg et al. (2000). Each of Ra and Rbis site specific and determined to a large extent by atmospheric properties. Mete-orological parameters such as ambient temperature (K) of 299.6∼303.2, wind speed
10
(m s−1) of 1.1∼3.6, and standard deviation of wind directionσθ (rad) of 0.13∼0.78 were
observed during the sampling period. In SEA air, a majority of aerosols observed in the size range of 0.1–20µm by the optical counter were in the fine mode (less than 1µm) (Kondo et al., 2004).
SVOCs in the water column partition into three phases: the truly dissolved phase,
15
the particulate phase and the colloidal organic material (Totten et al., 2001). The truly dissolved and colloidal phases can be categorized as apparent dissolved phase, which refers to the non-filter retained fraction. The partitioning of SVOCs onto particulate and colloidal phases results in the removal of SVOCs from surface layers via gravitational settling and consequently reduces their volatilization rates (Wania et al., 1998). Based
20
on the empirical estimation of sorption of hydrophobic pollutants onto natural sediments and soils (Karickhoff, 1981) and its application into water-column by Totten et al. (2001), the relationship between partition coefficientKOC andKOW can be derived as follows:
logKOC=log(KP
fOC)=alogKOW +b (4)
whereKOCequals partition coefficientKP normalized by organic carbon fraction (fOC) in
25
appar-ACPD
9, 13235–13269, 2009SVOCs in Singapore’s coastal
environment
J. He and R. Balasubramanian
Title Page
Abstract Introduction
Conclusions References
Tables Figures
◭ ◮
◭ ◮
Back Close
Full Screen / Esc
Printer-friendly Version
Interactive Discussion
ent dissolved and particulate phase (Totten et al., 2001), calculated asCP/(Cd ,a×TSM)
(CP: the concentration of SVOCs associated with the particulate phase;Cd ,a: the
con-centration in the apparent dissolved phase; and TSM: the concon-centration of total sus-pended matter). KOW (L kg
−1
) was obtained from the best available experimental data and predictive models with careful evaluations (de Lima Ribeiro and Ferreira, 2003;
5
Xiao et al., 2004; Shen and Wania, 2005; Zhou and Zhu, 2005; L ¨u et al., 2007). Since the temperature dependence ofKOW for selected SVOCs is not significant (Bahadur et al., 1997; Lei et al., 2000) and the temperature of the seawater varied by no more than 4◦C in this study,KOW has not been corrected for temperature.
To accommodate additional sorption to soot phase, Accardi-dey and Gschwend
10
(Accardi-dey and Gschwend, 2002) modified Gustafsson’s model (Gustafsson et al., 1997) to yield a dual OC/BC model:
KP =fOCKOC+fSCKSCCn−1
d , a (5)
where fSC, KSC are soot carbon fraction in particulate phase of seawater and soot-water partition coefficient, respectively, andnis Freundlich constant. Ifn=1, this model
15
assumes that soot-water partition was a linear isotherm, otherwise it is a nonlinear process. This model has been applied to multi media and especially the sediment-water (poresediment-water) partitioning (Gustafsson et al., 1997; Cornelissen and Gustafsson, 2005; Prevedouros et al., 2008). Considering the similarity of distribution between sediment/water and between particulate/water in sea water column, Eq. (5) can be
20
reasonably applied to the latter process.
The apparent dissolved concentrations of SVOCs (Cd ,a) is the sum of the truly dis-solved (Ctruly) and colloidal(CDOC, DOC-dissolved organic carbon, mg L
−1
) phases, onto both of which the fractions of SVOCs partitioned can be estimated as described in Eq. (6) by Totten et al. (2001) and Wurl et al. (2006a)
25
Cd ,a=Ctruly+CDOC=Ctruly(1+KOW ×DOC×10
−7) (6)
ACPD
9, 13235–13269, 2009SVOCs in Singapore’s coastal
environment
J. He and R. Balasubramanian
Title Page
Abstract Introduction
Conclusions References
Tables Figures
◭ ◮
◭ ◮
Back Close
Full Screen / Esc
Printer-friendly Version
Interactive Discussion
rate of gas transfer is controlled by the pollutant’s ability to diffuse across the air layer and sea surface water on either side of the air-water interface. The molecular diffusivity of the pollutant, dependent on the amount of resistance encountered in the liquid and gas films, describes the rate of transfer while the concentration gradient drives the direction of transfer (Totten et al., 2001). The fluxF (ng m−2day−1) is calculated by
5
F =KOL(Ctruly− Ca
H′) (7)
whereKOL(m day−1) is the overall mass transfer coefficient, and (Ctruly− Ca
H′) describes
the concentration gradient (ng m−3) where Ca is the gas-phase concentration of the
compound in air that is divided by the dimensionless Henry’s law constant (H) with H=H/RT whereR is the universal gas constant (8.315 Pa m3K−1mol−1),H is Henry’s
10
law constant (Pa m3mol−1) corrected by the temperature and salinity, and T is the temperature at the air-water interface (K). A positive flux indicates net volatilization out of the seawater and a negative flux indicates net absorption into the seawater. The overall mass transfer coefficient (KOL) comprises resistances to mass transfer across
the air layer and the water layer.
15
1
KOL =
1
KW +
1
KaH′ (8)
whereKaandKw (m day−1) are the mass transfer coefficients across the air layer and water layer, respectively. The mass transfer coefficientKa,comp(cm s
−1
) for a compound in air was calculated using the following equation (Schwarzenbach et al., 2003):
Ka,comp=Ka,H2O( MH2O Mcomp
)−0.5×0.67 (9)
20
whereKa,H2O=0.2×u10+0.3 and M (g mol
−1
ACPD
9, 13235–13269, 2009SVOCs in Singapore’s coastal
environment
J. He and R. Balasubramanian
Title Page
Abstract Introduction
Conclusions References
Tables Figures
◭ ◮
◭ ◮
Back Close
Full Screen / Esc
Printer-friendly Version
Interactive Discussion
has been applied in a number of studies (Totten et al., 2001; Wanninkhof et al., 2004; Wurl et al., 2006a), but this relationship was a semi-empirical estimation with low cor-relation (r2=0.66) only at steady winds. A more robust model was thus used in this study to calculateKw,comp (cm s−1) for compounds of interest (Schwarzenbach et al., 2003):
5
Kw,comp=
0.65×10⁻³Sccomp
600
−0.67
for u10≤4.2m s−1(smooth surface regime) (0.79u10−2.68)×10−3Sccomp
600
−0.5
for 4.2<u10≤13 m s−1(rough surface regime) (1.64u10−13.69)×10−3Sccomp
600
−0.5
for u10>13 m s−1(breaking wave regime)
(10)
where the Schmidt number, Sc, is the ratio of kinematic viscosity νkin (cm 2
s−1) and diffusivity D (cm2s−1) by Sc=νkin/D. The kinematic viscosity of seawater is obtained
using the method recommended by Chen et al. (1973). The diffusivities of compounds of interest in seawater were calculated using the Eq. (10) developed by Wilke and
10
Chang (1955).
D=7.4×10⁻⁸(2.6Mcomp) 0.5
T
ηVcomp0.6
(11)
whereT is the average temperature during each sampling event, Vcomp is the molar
volume of compound investigated (Mackay et al., 1992, 1996) and η is equal to the kinematic viscosity of solution (here referring to seawater). The important parameters
15
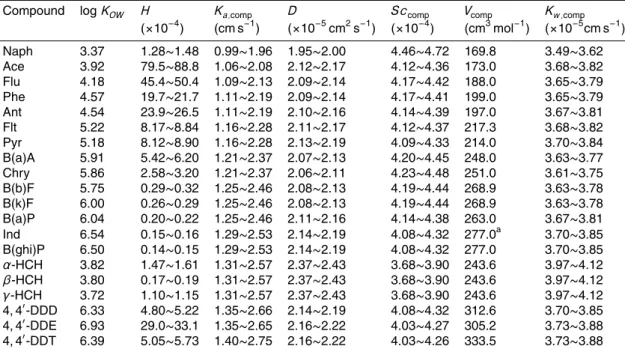
involved in the abovementioned equations are listed in Table 1.
3 Experimental
3.1 Sampling
Dry and wet deposition sampling. For the study of depositional fluxes of selected SVOCs, both the atmospheric and precipitation samples were collected
simultane-20
ACPD
9, 13235–13269, 2009SVOCs in Singapore’s coastal
environment
J. He and R. Balasubramanian
Title Page
Abstract Introduction
Conclusions References
Tables Figures
◭ ◮
◭ ◮
Back Close
Full Screen / Esc
Printer-friendly Version
Interactive Discussion
Altogether, 37 atmospheric particulate samples and 32 rainwater samples were col-lected under different weather conditions between June 2007 and May 2008. The sampling site was located 67 m a.s.l. and was approximately 1 km away from the open sea. Details about the sampling instrument and the geography of the area are reported elsewhere (He and Balasubramanian, 2009a).
5
SSW and SML Sampling. The SSW samples were collected at the depth of 1 m at a southern coastal area of Singapore with a 2 L glass amber bottle inserted in a stainless-steel sampling device. The SML samples (approximately 1 L) were collected simultaneously using the glass plate technique (Harvey and Burzell, 1972) and stored in a amber glass container. Eight samples were collected for SSW and SML,
respec-10
tively.
Air Sampling. Atmospheric samples were collected simultaneously with SSW by a high volume sampler (Model: TE-1000PUF, Tisch Environmental, Inc., USA) with quartz microfiber filters (Whatman, Tisch Environmental, Inc., USA) to capture parti-cles and polyurethane foam plugs (PUF, TE-1012, Tisch Environmental, Inc., USA) in
15
series (7.62 cm) at ca. 250 L min−1to collect gaseous phase. Particles were collected by a pre-combusted (at 450◦C for 24 h) circular quartz filter of 4′′diameter, followed by a combination of 3 PUF plugs connected in series (7.62 cm) to trap gas phase com-pounds. Eight paired samples (SSW+atmospheric gas) were collected.
Meteorological Conditions. The relevant meteorological parameters (air
tempera-20
ture, rainfall, wind speed, etc.) were obtained from an automated NUS weather station located in the same building where the atmospheric station is located. This meteo-rological station has been in operation to provide real-time meteometeo-rological data to the NUS community.
After collection, all water samples were filtered with pre-cleaned (heated at 450◦C
25
ACPD
9, 13235–13269, 2009SVOCs in Singapore’s coastal
environment
J. He and R. Balasubramanian
Title Page
Abstract Introduction
Conclusions References
Tables Figures
◭ ◮
◭ ◮
Back Close
Full Screen / Esc
Printer-friendly Version
Interactive Discussion 3.2 Materials
All solvents used for this study were of pesticide grade: n-hexane (HEX), ace-tone (ACE), dichloromethane (DCM) and methanol (METH) (Tedia, USA). The stan-dard mixture USEPA 610 including 16 priority PAHs (naphthalene (Naph), ace-naphthylene (Acy), acenaphthene (Ace), fluorene (Flu), phenanthrene (Phe),
an-5
thracene (Ant), fluoranthene (Flt), pyrene (Pyr), benz[a]anthracene (B(a)A), chrysene (Chry), benzo[b]fluoranthene (B(b)F), benzo[k]fluoranthene (B(k)F), benzo[a]pyrene (B(a)P), indeno[1,2,3-cd]pyrene (Ind), dibenz[a, h]anthracene (DB(ah)A) and benzo[ghi]perylene (B(ghi)P)), in methanol: methylene chloride and the standard mixture of OCPs included in Kit 608-S were purchased from Supelco (USA);
stan-10
dard for PCBs (C-QME-01) was obtained from AccuStandard (New Haven, USA). Surrogate standards were used as follows: anthracene-d10, fluoranthene-d10 and
benzo[e]pyrene-d12 (Sigma-Aldrich, St. Louis, MO, USA) for PAHs; 13C12-PCB 8 and 13C6-Hexachlorobenzene (Cambridge Isotope Laboratories, MA, USA) for OCPs;
13C12-PCBs congeners CB 77, 101, 141, 178 (Cambridge Isotope Laboratories, MA,
15
USA) for PCBs. In addition, internal standards were applied as below: phenanthrene-d10, pyrene-d10and benzo[a]pyrene-d12(Sigma-Aldrich, St. Louis, MO, USA) for PAHs;
13C6-Tetrachlorobenzene and 13C12-4, 4
′
-DDT (Cambridge Isotope Laboratories, MA, USA) for OCPs; and 13C12-PCBs congeners CB 8 and 206 (Cambridge Isotope Lab-oratories, MA, USA) for PCBs. Silica gel and florisil, obtained from Merck (Germany),
20
were heated at 600◦C for 24 h to remove any organic contamination.
3.3 Sample preparation and analysis
Sample Extraction and GC-MS Analysis. Prior to extraction, surrogate compounds were added to all samples. Water filters, aerosol filters and PUF samples were ex-tracted separately by Dionex ASE 200. All filtered water samples were exex-tracted on
25
ACPD
9, 13235–13269, 2009SVOCs in Singapore’s coastal
environment
J. He and R. Balasubramanian
Title Page
Abstract Introduction
Conclusions References
Tables Figures
◭ ◮
◭ ◮
Back Close
Full Screen / Esc
Printer-friendly Version
Interactive Discussion
water samples and purification have been reported somewhere (He and Balasubrama-nian, 2009c). All extracts were finally blown by gentle nitrogen stream and reduced to 50µL with internal standards, and kept in sealed vials at −20◦C prior to GC-MS analysis.
Chemical analysis was performed using a QP2010 GC-MS equipped with a
Shi-5
madzu AOC-5000 auto injector and a DB-5 fused silica capillary column (30 m length and 0.25 mm I.D.; film thickness 0.25µm) with purified helium as carrier gas. 4µL of the sample was injected into the GC-MS in splitless mode with a sampling time of 1.5 min using high-pressure injection mode (pressure 2.47 atm maintained for 2.0 min, initial column flow 3.17 mL min−1) as recommended in the GC-MS manual (Shimadzu).
10
PAHs, OCPs and PCBs standards as well as extracted samples were measured sep-arately in selective ion monitoring mode (SIM) with a detector voltage 700 V. The most abundant ions were selected for quantification, and then one to four reference ions were used for confirmation of each analyte in SIM mode.
Measurement of OC and EC. Organic carbon (OC) and elemental carbon (EC) were
15
determined by using a laboratory two-step thermal procedure (He and Balasubrama-nian, 2009b). Carbon contents were obtained by means of the 2400 series II CHNS/O analyzer (Perkin-Elmer Life and Analytical Sciences Inc.), which was operated in CHN mode with acetanilide (71.09% C, 6.71% H, 10.36% H) as a calibration standard and with helium plus 8% oxygen as carrier gas. When the combustion furnace temperature
20
was set at 450◦C, the content of OC in a sample aliquot put in a combustion boat could be determined directly; when the combustion temperature is set as high as 950◦C, the total of OC and EC was determined. Prior to analysis, carbonates are removed by adding diluted HCl. The EC content can then be obtained by subtracting OC from the total of OC and EC.
25
3.4 Quality control
ACPD
9, 13235–13269, 2009SVOCs in Singapore’s coastal
environment
J. He and R. Balasubramanian
Title Page
Abstract Introduction
Conclusions References
Tables Figures
◭ ◮
◭ ◮
Back Close
Full Screen / Esc
Printer-friendly Version
Interactive Discussion
extractions, the field blanks (filter and PUF plugs) were included and the mean blank value was subtracted from the measured levels. The reliability of the whole analytical procedure was assessed by using surrogate standards for PAHs, OCPs and PCBs. The mean recoveries obtained per sample were greater than 80% and concentrations of all real-world samples were corrected accordingly. The linearity of calibration
stan-5
dards was calculated by regression analysis with values ranging from 0.99–1.00 (r2) for SVOCs. Breakthrough was evaluated under field conditions by connecting three one-inch plugs in series and analyzing them separately. For 24 h air samples, mea-sured organic compounds at the third plug were in the range of blank values. Three one-inch plugs used in series with the hi-volume PUF sampler could therefore trap
gas-10
phase target compounds effectively. Control calibration standards spiked with internal standards were measured regularly to check instrument performance during analysis.
4 Results and discussion
4.1 Dry and wet depositions of SVOCs
By Eqs. (1) and (2), both dry and wet depositions were estimated on an annual basis
15
based on the monthly concentrations of SVOCs as shown in Fig. 1. Vd(0.003 m s
−1
) was not derived from sampling with dry deposition plates in this study but calculated by Eq. (3), which is also in the range of 0.001–0.01 m s−1for PAHs, OCPs and PCBs as reported in the literature (Eisenreich et al., 1981; McVeety and Hites, 1988; Hoff et al., 1996). Concentrations of PCBs in both dissolved and particulate phases of all
20
rainwater samples were below the limits of detection in this study.
In Singapore’s coastal area, the monthly dry deposition fluxes for PAHs, OCPs and PCBs were in the range of 46.0∼275.6µg m−2month−1, 60.7∼906.1 ng m−2month−1 and 3.1∼93.1 ng m−2month−1, respectively. A significant increase in the dry deposi-tion fluxes of most investigated pollutants was observed during the pre-NE monsoon
25
mon-ACPD
9, 13235–13269, 2009SVOCs in Singapore’s coastal
environment
J. He and R. Balasubramanian
Title Page
Abstract Introduction
Conclusions References
Tables Figures
◭ ◮
◭ ◮
Back Close
Full Screen / Esc
Printer-friendly Version
Interactive Discussion
soon winds could assist in dispersing aerosol particles during NE and SW monsoon seasons; the lighter winds during the pre-monsoon seasons (April–May and October– November) might strengthen the accumulation of particulate SVOCs. The monthly wet deposition flux for PAHs and OCPs ranged from 70.0∼363.5µg m−2month−1 and 4.7∼39.9µg m−2month−1, respectively. High wet deposition fluxes were observed from
5
December 2007 to March 2008 for both PAHs and OCPs (Fig. 1a in sharp contrast to the low dry deposition fluxes during the same period (Fig. 1b). The rainy season that took place from December 2007 to March 2008 might have contributed to pronounced wet scavenging of aerosols containing SVOCs from the atmosphere. On the other hand, the peak in the dry deposition flux observed during Oct and Nov 2007 could
10
likely be due to the typical low wind speeds during pre-monsoon seasons and the rel-atively less rainfall.
The mean annual atmospheric fluxes of selected SVOCs are summarized in Ta-ble 2. Particulate dry deposition fluxes of P
16PAHs,
P
7OCPs and
P
21 PCBs were
1328.8±961.1µg m−2y−1, 5421.4±3426.7 ng m−2y−1and 811.8±578.3 ng m−2y−1,
re-15
spectively. The dry particulate deposition fluxes ofP
7OCPs and
P
21PCBs were much
lower than that ofP
16-PAHs, most likely due to the local heavy PAH emissions into the
atmosphere. In addition, the wet deposition fluxes of P
16PAHs and
P
7OCPs were
6667.1±1745.2 and 87.5±72.1µg m−2y−1, respectively, which were much more dom-inant over their dry particulate deposition fluxes. However, it has to be noted that only
20
particles were considered for dry deposition, but both particulate and dissolved phases were included for wet deposition in this study.
The profile of particulate P
16PAHs fluxes was dominated by B(ghi)P (12.8%), Ind
(11.4%), Pyr (10.7%), Phe (10.0%) and Chry (9.3%) on an annual basis; and in wet pre-cipitation, the dominant pollutants were Naph, Phe, Flt and Pyr, accounting for 12.8%,
25
8.3%, 2.5% and 2.4% of theP
16PAHs fluxes, respectively. Previous studies indicated
ACPD
9, 13235–13269, 2009SVOCs in Singapore’s coastal
environment
J. He and R. Balasubramanian
Title Page
Abstract Introduction
Conclusions References
Tables Figures
◭ ◮
◭ ◮
Back Close
Full Screen / Esc
Printer-friendly Version
Interactive Discussion
can see in Table 2 that the dry deposition fluxes of high molecular weight (HMW) PAHs are comparable to those of low molecular weight (LMW) PAHs. HMW PAHs have been reported to contribute more to the dry deposition (Gigliotti et al., 2002). This anomaly in the present study may be because the particulate fractions of LMW PAHs in aerosols which prefer to be in coarse-mode readily settled. Table 2 clearly shows that the
con-5
tribution of the LMW PAH pollutants in wet deposition was increased as compared to those in dry deposition. The main processes contributing to wet deposition fluxes of SVOCs are precipitation scavenging of particle-sorbed and gaseous chemicals, but particle scavenging, rather than the gas scavenging, is the dominant removal mech-anism (Offenberg and Baker, 2002; Sahu et al., 2004). The below-cloud scavenging
10
rates increase with particle size because the collision efficiency of particle-droplet en-counter increases with increasing particle diameters (Calder ´on et al., 2008). In this study, it is understandable that the washout of those volatile pollutants attached with coarse particles dominated the wet depositional flux of SVOCs such as LMW PAHs and HCHs, considering the high rainfall amount and precipitation intensities in Singapore.
15
However, scavenging of fine particles needs to be considered and could contribute as well via nucleation, Brownian diffusion, etc (Perry and Hobbs, 1994; Chate, 2005).
4.2 Water column partitioning
In sea subsurface water (SSW), the apparent dissolved and particulate occurrence levels of SVOCs are reported in Table 3. The mean concentrations of PAHs were
20
43.9±35.8 and 131.4±101.8 ng L−1 for both phases, respectively, showing a 3-fold enrichment of PAHs in the suspended particulate-phase in this marine environ-ment. For HCHs and DDXs, the total mean concentrations were 1147.8±898.5 and 361.9±271.8 pg L−1in the dissolved phase, and 728.9±622.0 and 560.3±501.5 pg L−1 in the particulate phase, respectively. The levels of both HCHs and DDXs were
com-25
ACPD
9, 13235–13269, 2009SVOCs in Singapore’s coastal
environment
J. He and R. Balasubramanian
Title Page
Abstract Introduction
Conclusions References
Tables Figures
◭ ◮
◭ ◮
Back Close
Full Screen / Esc
Printer-friendly Version
Interactive Discussion 4.2.1 Relationship betweenKOCandKOW
The organic carbon-normalized partition coefficients between particulate and dissolved phases (KOC) for both PAHs and OCPs were obtained based on the data obtained
from field measurements. The relationships between KOC of PAHs and OCPs and their respectiveKOW were investigated with the inclusion of predicted KOC values by
5
Karickhoff’s model (Karickhoff, 1981) as in Fig. 2. In Fig. 2a, the observed KOC
val-ues, especially for those PAHs with smaller KOW, are much larger than predictions and the log KOC is poorly correlated with log KOW with low slope of 0.13 only. It has been suggested that the slope of the log KOC/log KOW relation should be equal to
1 when partitioning is in equilibrium (Chiou et al., 1983; Gschwend and Wu, 1985).
10
Researchers initially hypothesized that the significant deviation from 1 May mainly be due to the non-equilibrium or the sorption of compounds to colloids but not particulate phase (Gschwend and Wu, 1985). Till now, a number of studies have reported that the field measuredKOC values were higher than the theoretically predicted ones in many different settings such as lake, sediments, and rain water (Baker et al., 1991; Poster
15
and Baker, 1996; Accardi-dey and Gschwend, 2002). These results suggest the pres-ence of particulate phase like soot (black carbon), to which the parent PAHs are more strongly associated than with natural organic matter/carbon. In contrast, field-obtained
KOC values for OCPs are correlated better with KOW with a slope of 0.79 closer to theoretical value and greaterR2=0.66 (Fig. 2b). In addition, theseKOC for OCPs are
20
ACPD
9, 13235–13269, 2009SVOCs in Singapore’s coastal
environment
J. He and R. Balasubramanian
Title Page
Abstract Introduction
Conclusions References
Tables Figures
◭ ◮
◭ ◮
Back Close
Full Screen / Esc
Printer-friendly Version
Interactive Discussion 4.2.2 Sorption of PAHs to soot carbon
The observed partition coefficients (KP) between particulate and dissolved phases are compared with predicted values by Eq. (5) as shown in Fig. 3 for lower molecular weight (LMW) PAHs such as Flu, Phe, Ant, and Pyr and higher molecular weight (HMW) PAHs such as B(a)A, Chry, B(b)F, B(k)F, B(a)P, and B(ghi)P. The use of
Fre-5
undlich exponent n=0.62, which was derived for pyrene in sediment by Accardi-dey and Gschwend (2002), over-estimates the sorption of both LMW (Fig. 3a) and HMW (the predicted line not shown in Fig. 3b) to the particulates in Singapore’s coastal sub-surface seawater using the measured fOC and fSC values, indicating the sorp-tion dynamics may be different due to variations in specific surface areas and surface
10
chemistries of soot carbons of various origins. Freundlich exponent nwas varied to achieve the best fit atn=0.80 for LMW PAHs and atn=1.2 for HMW compounds. Both optimized Freundlich exponents are not equal to one, implying thatKBC is dependent
on sorbate levels and the sorption of PAHs to soot carbon is a nonlinear process. For LMW PAHs such as Phe, Ant, Pyr,n<1 has been reported (Cornelissen and
Gustafs-15
son, 2005; Prevedouros et al., 2008), but for HMW compounds such as B(a)P,KP was
over-predicted by a factor of 2∼5 by using n<1 (Prevedouros et al., 2008). For the op-timum Freundlich exponents,KP values increased by 1.4∼1.6 log units and 0.7∼1.3 log units for LMW and HMW PAHs, respectively. Soot carbon was the dominant sorbent here since its sorption contributed ∼90% of the total partition coefficients, while the
20
OC fraction was still an important sorbent and contributed to ∼10% of the overall KP
values. It is hypothesized that sorptions onto both combustion-derived soot carbon and natural organic matter act in parallel to bind PAHs to particulate phase in marine water column. Additionally, it can be seen that the inclusion of soot carbon sorption reduced the dissolved water concentrations and increase the particulate enrichment of PAHs.
25
ACPD
9, 13235–13269, 2009SVOCs in Singapore’s coastal
environment
J. He and R. Balasubramanian
Title Page
Abstract Introduction
Conclusions References
Tables Figures
◭ ◮
◭ ◮
Back Close
Full Screen / Esc
Printer-friendly Version
Interactive Discussion 4.3 Air-water diffusive exchange
4.3.1 Truly dissolved SVOCs
Those SVOCs sorbed onto colloidal matter (DOC) are not available for air-water ex-change. The partitioning between truly dissolved and colloidal phases has to be inves-tigated in order to obtain the truly dissolved concentrations of SVOCs. In this study,
5
DOC concentrations are in the range of 0.6∼7.8 mg L−1. The predicted mean fractions adsorbed to DOC for individual PAH varied in the range of 0.1∼40% as can be seen from Table 3. It clearly showed that HMW PAHs are more readily adsorbed to DOC (10∼50%) than those LMW compounds (below 10%). α-, β-, and γ-HCH were ad-sorbed to DOC at a mean fraction of 0.26, 0.25 and 0.20%, consistent with the values
10
(∼0.4%) reported by Wurl et al. (2006b), while FDOC,C(%) for DDXs was much higher in the range of 30∼40%. This distribution pattern suggests that the sorption of SVOCs onto DOC in the seawater is correlated with the chemical’s KOW, namely, pollutants
with higherKOW are more easily sorbed onto DOC.
4.3.2 Air-water gas exchange flux
15
Atmospheric gas-phase mean concentrations of P
PAHs, P
HCHs and P DDXs during November and December 2007 (Table 3) were 187.5±138.3 ng m−3, 958.9±336.7 pg m−3 and 39.5±7.7 pg m−3, respectively, which were in the range of levels reported previously (He et al., 2009). The mean annual fluxes of SVOCs across the air-water interface were estimated and are summarized in Table 2.
20
The fluxes of the individual PAH compound were in the range of −21.7±20.2∼−1608.4±869.6 ng m−2day−1 and P
PAH flux reached up to −5884.0±4040.7 ng m−2day−1. All PAHs showed negative fluxes indicating the tendency to transfer these contaminants from air to water (net absorption). The magnitude and direction of PAH fluxes varied widely on temporal and spatial scales all
25
ACPD
9, 13235–13269, 2009SVOCs in Singapore’s coastal
environment
J. He and R. Balasubramanian
Title Page
Abstract Introduction
Conclusions References
Tables Figures
◭ ◮
◭ ◮
Back Close
Full Screen / Esc
Printer-friendly Version
Interactive Discussion
net volatilization of Flu to 11 400 ng m−2day−1 net absorption of Phe on different sampling events (Bamford et al., 1999). Both New York harbor and Raritan Bay systems exhibited net volatilization fluxes for the majority of PAHs (Gigliotti et al., 2002), while LMW PAHs showed positive fluxes and HMW PAHs showed negative values in Mumbai harbor of India (Pandit et al., 2006). The magnitudes of net PAH
5
fluxes are comparable to the reported values (−0.01∼−21.2µg m−2day−1) in an urban lake in Guangzhou of China (Li et al., 2009). The large net absorption fluxes in this island were likely a result of high gaseous concentrations of PAHs, attributed to the highly uniform ambient temperature and the strong terrestrial sources such as island-wide vehicular traffic, chemical industries, major power plants and oil refineries.
10
Air-water gas exchange fluxes were estimated in the range of −44.4±37.8∼−73.7±31.3 ng m−2day−1 and −0.74±0.67∼−2.9±1.8 ng m−2day−1 for HCHs and DDXs, respectively (Table 2), indicating Singapore’s south coastal line as a sink for both HCHs and DDXs. The fluxes estimated here were compa-rable to those for the Johor strait located between Singapore and Malaysia with
15
−8.2∼−66.8 ng m−2day−1 (Wurl et al., 2006). It has been reported that air-water gas exchange of SVOCs is a dynamic process that is especially sensitive to fluctuations in concentrations of both air and water phases (Wilkinson et al., 2005). Even though the Henry’s law constants of DDXs are larger than those of HCHs, their net absorption was still much lower than that of HCHs, most likely due to much higher occurrence
20
levels of gaseous HCHs, driving more HCHs transferred across the air-sea interface. Annual air-sea gas exchange fluxes were calculated by multiplying the average daily fluxes by 365 days and the relative contribution of each depositional process to the total atmospheric deposition is shown in Fig. 4. For OCPs, most contribution to total OCP inputs was from wet deposition and air-sea exchange gas fluxes, while the dry
25
ACPD
9, 13235–13269, 2009SVOCs in Singapore’s coastal
environment
J. He and R. Balasubramanian
Title Page
Abstract Introduction
Conclusions References
Tables Figures
◭ ◮
◭ ◮
Back Close
Full Screen / Esc
Printer-friendly Version
Interactive Discussion
Naph to Phe, and the profile of wet deposition contribution to total PAH inputs (Fig. 4) was similar to that of wet deposition fluxes for individual PAH compounds (Table 2). The contribution of air-sea gas absorption has been reported to decrease with the increasing of molecular weight (Gigliotti et al., 2002). However, in this study, it mostly prevailed for medium molecular weight compounds from Ant to B(a)A, but not for LMW
5
PAHs. This may be because the volatile degassing of these LMW compounds from the seawater to air under this tropical climate offsets their transfer from gas to seawater and led to the low net absorption fluxes observed here.
4.4 Sea-surface microlayer enrichment
SML has an enrichment effect of SVOCs, most likely due to their hydrophobic
charac-10
ter and great affinity for surfactants collected at the air-water interface (Hardy, 1982; Chernyak et al., 1996; Wurl et al., 2006a). This effect can be quantified by the enrich-ment factor EF, calculated as the ratio between SML and SSW concentrations (Man-odori et al., 2006) as shown in Fig. 5. EFs in the SML of particulate phase were 1.2∼7.1 and 3.0∼4.9 for PAHs and OCPs, and those of dissolved phase were 1.1∼4.9 and
15
1.6∼4.2 for PAHs and OCPs, respectively. EFs in the SML for HCHs found in this study were relatively higher than those reported for the Johor Strait between Malaysia and Singapore (EF=1.1∼1.4 for particulate phase and EF=3.3∼4.4 for dissolved phase) by Wurl and Obbard (2006b). Similar profiles were found in the SML that EFs gener-ally increased with an increase in molecular weight for both particulate and dissolved
20
phases. In addition, the individual components exhibited similar trends in both phases, with relatively higher enrichments for particulate than for dissolved SVOCs. It is known that the major harbor, one of the busiest harbors in the world, is in the south coastal line of Singapore, and chemical industries as well as oil refineries situated in a group of small islands on the southwest coast of the Singapore Island. It is understandable
25
ACPD
9, 13235–13269, 2009SVOCs in Singapore’s coastal
environment
J. He and R. Balasubramanian
Title Page
Abstract Introduction
Conclusions References
Tables Figures
◭ ◮
◭ ◮
Back Close
Full Screen / Esc
Printer-friendly Version
Interactive Discussion
to delay the transport of SVOCs across the interface to SSW. In addition, the SML is a relatively dynamic compartment, highly influenced by changes of the meteorological and hydrographical conditions (Guitart et al., 2007). This may be the reason for high variation of EFs obtained in this study.
5 Conclusions
5
Both dry and wet depositions were estimated on the basis of the monthly concen-trations of SVOCs. The dry particulate deposition showed lower fluxes during the monsoon seasons but a significant increase within the pre-NE monsoon. It was also observed that the high wet deposition fluxes took place during the rainy season (De-cember 2007∼March 2008) in sharp contrast to the low dry deposition fluxes
dur-10
ing the same period. It has to be noted that the deposition profile was significantly influenced by meteorological/atmospheric conditions in this study. In SSW, the ob-served organic carbon-normalized partition coefficients between particulate and dis-solved phases (KOC) values for PAHs were much larger than predictions and the log KOC is poorly correlated with log KOW, while the field-obtained KOC values for OCPs
15
are correlated better withKOW. The study of sorption of PAHs to soot carbon showed that soot carbon was the dominant sorbent for PAHs since its sorption contributed ∼90% of the total partition coefficients, indicating soot carbon sorption reduced the dissolved water concentrations and possibly lowered the bio-availability of these pollu-tants in the sea water column. Other than the soot sorbent, colloidal matter (DOC) also
20
played an important role in the partitioning of SVOCs in the water column, and reduced the availability of SVOCs for air-water exchange. In the air-water exchange study, all mean negative gas exchange fluxes showed net absorption of SVOCs onto the Sin-gapore’s south coastal sea-surface. The contribution of this process mostly prevailed for medium molecular weight compounds from Ant to B(a)A, but not for LMW PAHs as
25
ACPD
9, 13235–13269, 2009SVOCs in Singapore’s coastal
environment
J. He and R. Balasubramanian
Title Page
Abstract Introduction
Conclusions References
Tables Figures
◭ ◮
◭ ◮
Back Close
Full Screen / Esc
Printer-friendly Version
Interactive Discussion
was found with an increase in molecular weight and the individual components had relatively higher enrichments for particulate than for dissolved SVOCs. In addition, this study also implied that SML may have the large storage capacity to delay the transport of SVOCs across the interface to SSW.
Acknowledgements. The authors gratefully acknowledge the financial support of this research 5
project by the National University of Singapore.
References
Accardi-dey, A. and Gschwend, P. M.: Assessing the combined roles of natural organic matter and black carbon as sorbents in sediments, Environ. Sci. Technol., 36, 21–29, 2002.
Achman, D. R., Hornbuckle, K. C., and Eisenreich, S. J.: Volatilization of polychlorinated 10
biphenyls from Green Bay, Lake Michigan, Environ. Sci. Technol., 27, 75–87, 1993.
Bahadur, N. P., Shiu, W. Y., Boocock, D. G. B., and Mackay, D.: Temperature dependence of octanol-water partition coefficient for selected chlorobenzenes, J. Chem. Eng. Data, 42, 685–688, 1997.
Baker, J. E., Eisenreich, S. J., and Eadie, B. J.: Sediment trap fluxes and benthic recycling 15
of organic carbon, polycyclic aromatic hydrocarbons, and polychlorobiphenyl congeners in Lake Superior, Environ. Sci. Technol., 25, 500–509, 1991.
Bamford, H. A., Offenberg, J. H., Larsen, R. K., Ko, F. C., and Baker, J. E.: Diffusive exchange of polychclic aromatic hydrocarbons across the air-water interface of the Patapsco river, an urbanized subestuary of the Chesapeake Bay, Environ. Sci. Technol., 33, 2138–2144, 1999. 20
Basheer, C., Obbard, J. P., and Lee, H. K.: Persistent organic pollutants in Singapore’s coastal marine environment: part I, seawater, Water Air Soil Poll., 149, 295–313, 2003.
Bidleman, T. F., Jantunen, L. M., Falconer, R. L., Barrie, L. A., and Fellin, P.: Decline of hex-achlorocyclohexane in the Arctic atmosphere and reversal of air-sea gas exchange, Geo-phys. Res. Lett., 22, 219–222, 1995.
25
ACPD
9, 13235–13269, 2009SVOCs in Singapore’s coastal
environment
J. He and R. Balasubramanian
Title Page
Abstract Introduction
Conclusions References
Tables Figures
◭ ◮
◭ ◮
Back Close
Full Screen / Esc
Printer-friendly Version
Interactive Discussion Chate, D. M.: Study of scavenging of submicron-sized aerosol particles by thunderstorm rain
events, Atmos. Environ., 39, 6608–6619, 2005.
Chen, S. F., Chan, R. C., Read, S. M., and Bromley, L. A.: Viscosity of sea water solutions, Desalination, 13, 37–51, 1973.
Chernyak, S. M., Rice, C. P., and McConnell, L. L.: Evidence of currently-used pesticides in air, 5
ice, fog, seawater and surface microlayer in the Bering and Chukchi Seas, Mar. Pollut. Bull., 32, 410–419, 1996.
Chiou, C. T., Porter, P. E., and Schmedding, D. W.: Partition equilibria of non-ionic organic-compounds between soil organic-matter and water, Envrion. Sci. Technol., 17, 227–231, 1983.
10
Cornelissen, G. and Gustafsson, ¨O.: Prediction of large variation in biota to sediment accumu-lation factors due to concentration-dependent black carbon adsorption of planar hydrophobic organic compounds, Environ. Toxicol. Chem., 24, 495–498, 2005.
Dachs, J., Lohmann, R., Ockenden, W. A., Mejanelle, L., Eisenreich, S. J., and Jones, K. C.: Oceanic biogeochemical controls on global dynamics of persistent organic pollutants, 15
Environ. Sci. Technol., 36, 4229–4237, 2002.
Dachs, J., Van Ry, D. A., and Eisenreich, S. J.: Occurrence of estrogenic nonylphenols in the urban and coastal atmosphere of the lower Hudson River estuary, Environ. Sci. Technol., 33, 2676–2679, 1999.
de Lima Ribeiro, F. A. and Ferreira, M. M. C.: QSPR models of boiling point, octanol-water 20
partition coefficient and retention time index of polycyclic aromatic hydrocarbons, J. Mol. Struct., 663, 109–126, 2003.
Eisenreich, S. J., Looney, B. B., and Thornton, J. D.: Airborne organic contaminants in the Great Lakes ecosystem, Environ. Sic. Technol., 15, 30–38, 1981.
Fang, M., Ko, F., Baker, J. E., and Lee, C.: Seasonality of diffusive exchange of polychlorinated 25
biphenyls and hexachlorobenzene across the air-sea interface of Kaohsung Harbor, Taiwan, Sci. Total Environ., 407, 548–565, 2008.
Gigliotti, C. L., Brunciak, P. A., Dachs, J., Glenn, T. R., and Nelson, E. D.: Air-water exchange of polycyclic aromatic hydrocarbons in the New York – New Jersey, USA, harbor estuary, Environ. Toxicol. Chem., 21, 235–244, 2002.
30
Gschwend, P. M. and Wu, S. C.: On the constancy of sediment water partition-coefficients of hydrophobic organic pollutants, Environ. Sci. Technol., 19, 90–96, 1985.
ACPD
9, 13235–13269, 2009SVOCs in Singapore’s coastal
environment
J. He and R. Balasubramanian
Title Page
Abstract Introduction
Conclusions References
Tables Figures
◭ ◮
◭ ◮
Back Close
Full Screen / Esc
Printer-friendly Version
Interactive Discussion aromatic hydrocarbons in the coastal surface microlayer, Mar. Pollut. Bull., 54, 186–194,
2007.
Gustafsson, ¨O., Haghseta, F., Chan, C. H., MacFarlane, J., and Gschwend, P. M.: Quantifica-tion of the dilute sedimentary soot phase: ImplicaQuantifica-tions for PAH speciaQuantifica-tion and bioavailability, Environ. Sci. Technol., 31, 3341–3347, 1997.
5
Hardy, J. T.: The sea surface microlayer: biology, chemistry and anthropogenic enrichment, Prog. Oceanogr., 11, 307–328, 1982.
Harvey, G. W. and Burzell, L. A.: A simple microlayer method for small samples, Limnol. Oceanogr., 17, 156–157, 1972.
He, J. and Balasubramanian, R.: Rain-aerosol coupling in the tropical atmosphere of Southeast 10
Asia: distribution and scavenging ratios of major ionic species, J. Atmos. Chem., 60, 205– 220, 2009a.
He, J. and Balasubramanian, R.: A study of gas/particle partitioning of SVOCs in the tropical atmosphere of Southeast Asia, Atmos. Environ., in press, 2009b.
He, J. and Balasubramanian, R.: A study of precipitation scavenging of semi-volatile organic 15
compounds (SVOCs) in a tropical area, J. Geophys. Res., doi:10.1029/2008JD011685, in press, 2009c.
He, J., Balasubramanian, R., Karthikeyan, S., and Joshi, U. M.: Determination of semi-volatile organochlorine compounds in the atmosphere of Singapore using accelerated solvent ex-traction, Chemosphere, 75(5), 640–648, 2009.
20
Hinckley, D. A., Bidleman, T. F., and Rice, C. P.: Atmospheric organochlorine pollutants and air-sea exchange of hexachlorocyclohexane in the Bering and Chukchi Seas, J. Geophys. Res., 96, 7201–7213, 1991.
Hoff, R. M., Strachan, W. M. J., Sweet, C. W., Chan, C. H., Shackleton, M., Bidleman, T. F., Brice, K. A., Burniston, D. A., Cussion, S., Gatz, D. F., Harlin, K., and Schroeder, W. H.: 25
Atmospheric deposition of toxic chemicals to the Great Lakes: a review of data through 1994, Atmos. Environ., 30, 3505–3527, 1996.
Iwata, H., Tanabe, S., Sakai, N., Nishimura, A., and Tatsukawa, R.: Geographical distribution of persistent organochlorines in air, water and sediments from Asia and Oceania, and their implications for global redistribution from lower latitudes, Environ. Pollut., 85, 15–33, 1994. 30
ACPD
9, 13235–13269, 2009SVOCs in Singapore’s coastal
environment
J. He and R. Balasubramanian
Title Page
Abstract Introduction
Conclusions References
Tables Figures
◭ ◮
◭ ◮
Back Close
Full Screen / Esc
Printer-friendly Version
Interactive Discussion Jones, K. C. and De Voogt, P.: Persistent organic pollutants (POPs): state of science, Environ.
Pollut., 100, 209–221, 1999.
Karickhoff, S. W.: Semi-empirical estimation of sorption of hydrophobic pollutants on natural sediments and soils, Chemosphere, 10, 833–846, 1981.
Kondo, Y., Morino, Y., Takegawa, N., et al.: Impacts of biomass burning in Southeast Asia 5
on ozone and reactive nitrogen over the western Pacific in spring, J. Geophys. Res., 109, D15S12, doi:10.1029/2003JD004203, 2004.
L ¨u, W., Chen, Y., Liu, M., Chen, X., and Hu, Z.: OSPR prediction of n-octanol/water partition coefficient for polychlorinated biphenyls, Chemosphere, 69, 469–478, 2007.
Lei, Y. D., Wania, F., Shiu, W. Y., and Boocock, D. G. B.: HPLC-based method for estimating 10
the temperature dependence of n-octanol-water partition coefficient, J. Chem. Eng. Data, 45, 738–742, 2000.
Li, J., Cheng, H., Zhang, G., Qi, S., and Li, X.: Polycyclic aromatic hydrocarbon (PAH) deposi-tion to and exchange at the air-water interface of Luhu, an urban lake in Guangzhou, China, Environ. Pollut., 157, 273–279, 2009.
15
Luo, X., Mai, B., Yang, Q., Fu, J., Sheng, G., and Wang, Z.: Polycyclic aromatic hydrocarbons (PAHs) and organochlorine pesticides in water columns from the Pearl River and the Macao harbor in the Pearl River Delta in South China, Mar. Pollut. Bull., 48, 1102–1115, 2004. Mackay, D., Shiu, W. Y., and Ma, K. C. (Eds.): Illustrated Handbook of Physical-Chemical
Properties and Environmental Fate for Organic Chemicals, Lewis Publisher, Boca Raton, FL, 20
1992.
Mackay, D., Shiu, W. Y., and Ma, K. C. (Eds.): Illustrated Handbook of Physical-Chemical Properties and Environmental Fate for Organic Chemicals Lewis Publishers, Boca Raton, FL, 1996.
Manodori, L., Gambaro, A., Piazza, R., Ferrari, S., Stortini, A. M., Moret, I., and Capodaglio, 25
G.: PCBs and PAhs in sea-surface microlayer and sub-surface water samples of the Venice Lagoon (Italy), Mar. Pollut. Bull., 52, 184–192, 2006.
McGroddy, S. E., farrington, J. W., and Gschwend, P. M.: Comparison of the in situ and des-orption sediment-water partitioning of polycyclic aromatic hydrocarbons and polychlorinated biphenyls, Environ. Sci. Technol., 30, 172–177, 1996.
30
McVeety, B. D. and Hites, R. A.: Atmospheric deposition of polycyclic aromatic hydrocarbons to water surfaces: a mass balance approach, Atmos. Environ., 22, 511–536, 1988.
ACPD
9, 13235–13269, 2009SVOCs in Singapore’s coastal
environment
J. He and R. Balasubramanian
Title Page
Abstract Introduction
Conclusions References
Tables Figures
◭ ◮
◭ ◮
Back Close
Full Screen / Esc
Printer-friendly Version
Interactive Discussion and air-water exchange of polycyclic aromatic hydrocarbons with the water surface sampler,
Environ. Sci. Technol., 33, 426–434, 1999.
Offenberg, J. H. and Baker, J. E.: Precipitation scavenging of polychlorinated biphenyls and polycyclic aromatic hydrocarbons along an urban to over-water transect, Environ. Sci. Tech-nol., 36, 3763–3771, 2002.
5
Oskam, I. C., Ropstad, E., Lie, E., Derocher, A. E., Wiig, Ø., Dahl, E., Larsen, S., and Skaare, J. U.: Organochlorines affect the steroid hormone cortisol in free-ranging polar bears (ursus Maritimus) at Svalbard, Norway, J. Toxicol. Env. Health, 67, 959–977, 2004.
Pandit, G. G., Sahu, S. K., Puranik, V. D., and Venkat Raj, V.: Exchange of polycyclic aromatic hydrocarbons across the air-water interface at the creek adjoining Mumbai harbour, India, 10
Environ. Int., 32, 259–264, 2006.
Park, J. S., Wade, T. L., and Sweet, S. T.: Atmospheric deposition of PAHs, PCBs and organochlorine pesticides to Corpus Christi Bay, Texas, Atmos. Environ., 36, 1707–1720, 2002.
Perry, K. D. and Hobbs, F. V.: Further evidence for particle nucleation in clear air adjacent to 15
marine cumulus clouds, J. Geophys. Res., 99, 22 803–22 818, 1994.
Poster, D. L. and Baker, J. E.: Influence of submicron particles on hydrophobic organic contam-inants and distributions of polycyclic aromatic hydrocarbons and polychlorinated biphenyls in rain water, Environ. Sci. Technol., 30, 341–348, 1996.
Prevedouros, K., Palm-Cousins, A., Gustafsson, ¨O., and Cousins, I. T.: Development of a black 20
carbon-inclusive multi-media model: Application for PAHs in Stockholm, Chemosphere, 70, 607–615, 2008.
Sahu, S. K., Pandit, G. G., and Sadasivan, S.: Precipitation scavenging of polycyclic aromatic hydrocarbons in Mumbai, India, Sci. Total Environ., 318, 245–249, 2004.
Schwarzenbach, R. P., Geschwend, P. M., and Imboden, D. M. (Eds.): Environmental organic 25
chemistry, Wiley-Interscience, New York, 2003.
Seinfeld, J. H. and Pandis, S. N. (Eds.): Atmospheric Chemistry and Physics: from Air Pollution to Climate Change, John Wiley, New York, 2nd edn., 2006.
Shen, L. and Wania, F.: Compilation, evaluation, and selection of physical-chemical property data for organochlorine pesticides, J. Chem. Eng. Data, 50, 742–768, 2005.
30
ACPD
9, 13235–13269, 2009SVOCs in Singapore’s coastal
environment
J. He and R. Balasubramanian
Title Page
Abstract Introduction
Conclusions References
Tables Figures
◭ ◮
◭ ◮
Back Close
Full Screen / Esc
Printer-friendly Version
Interactive Discussion Turner, D. B.: Comparison of Three Methods for Calculating the Standard Deviation of the Wind
Direction, J. Clim. Appl. Meteorol., 25, 703–707, 1986.
van den Berg, A., Dentener, F., and Lelieveld, J.: Modelling the chemistry of the marine bound-ary layer: Sulfate formation and the role of sea-salt aerosol particles, J. Geophys. Res., 105, 11 671–11 698, 2000.
5
Wania, F.: Assessing the potential of persistent organic chemicals for long-range transport and accumulation in Polar regions, Environ. Sci. Technol., 37, 1344–1351, 2003.
Wania, F., Axelman, J., and Broman, D.: A review of processes involved in the exchange of persistent organic pollutants across the air-sea interface, Environ. Pollut., 102, 3–23, 1998. Wanninkhof, R.: Relationship between wind speed and gas exchange over the ocean, J. Geo-10
phys. Res., 97, 7373–7382, 1992.
Wanninkhof, R., Sullivan, K. F., and Top, Z.: Air-sea gas transfer in the Southern Ocean, J. Geophys. Res., 109, C08S19.01–C08S19.12, 2004.
Wilke, C. R. and Chang, P.: Correlation of diffusion coefficients in dilute solutions, AICHE J., 1, 264–270, 1955.
15
Wilkinson, A. C., Kimpe, L. E., and Blais, J. M.: Air-water gas exchange of chlorinated pesti-cides in four lakes spanning, Environ. Toxicol. Chem., 24, 61–69, 2005.
Wurl, O., Obbard, J. P., and Lam, P. K. S.: Distribution of organochlorines in the dissolved and suspended phase of the sea-surface microlayer and seawater in Hong Kong, China, Mar. Pollut. Bull., 52, 768–777, 2006a.
20
Wurl, O. and obbard, J. P.: Distribution of organochlorine compounds in the sea-surface micro-layer, water column and sediment of Singapore’s coastal environment, Chemosphere, 62, 1105–1115, 2006b.
Wurl, O., Karuppiah, S., and Obbard, J. P.: The role of the sea-surface microlayer in the air-sea gas exchange of organochlorine compounds, Sci. Total Environ., 369, 333–343, 2006c. 25
Xiao, H., Li, N., and Wania, F.: Compilation, evaluation, and selection of physical-chemical property data forα-,β-, andγ-hexachlorocyclohexane, J. Chem. Eng. Data, 49, 173—185, 2004.
Zhang, G., Li, J., Cheng, H., Li, X., Xu, W., and Jones, K. C.: Distribution of organochlorine pes-ticides in the Northern South China Sea: Implications for land outflow and air-sea exchange, 30
Environ. Sci. Technol., 41, 3884–3890, 2007.
ACPD
9, 13235–13269, 2009SVOCs in Singapore’s coastal
environment
J. He and R. Balasubramanian
Title Page
Abstract Introduction
Conclusions References
Tables Figures
◭ ◮
◭ ◮
Back Close
Full Screen / Esc
Printer-friendly Version
Interactive Discussion Table 1.Relevant parameters used in this study (source indicated in the text).
Compound logKOW H Ka,comp D Sccomp Vcomp Kw,comp
(×10−4) (cm s−1) (×10−5cm2s−1) (×10−4) (cm3mol−1) (×10−5cm s−1)
Naph 3.37 1.28∼1.48 0.99∼1.96 1.95∼2.00 4.46∼4.72 169.8 3.49∼3.62
Ace 3.92 79.5∼88.8 1.06∼2.08 2.12∼2.17 4.12∼4.36 173.0 3.68∼3.82
Flu 4.18 45.4∼50.4 1.09∼2.13 2.09∼2.14 4.17∼4.42 188.0 3.65∼3.79
Phe 4.57 19.7∼21.7 1.11∼2.19 2.09∼2.14 4.17∼4.41 199.0 3.65∼3.79
Ant 4.54 23.9∼26.5 1.11∼2.19 2.10∼2.16 4.14∼4.39 197.0 3.67∼3.81
Flt 5.22 8.17∼8.84 1.16∼2.28 2.11∼2.17 4.12∼4.37 217.3 3.68∼3.82
Pyr 5.18 8.12∼8.90 1.16∼2.28 2.13∼2.19 4.09∼4.33 214.0 3.70∼3.84
B(a)A 5.91 5.42∼6.20 1.21∼2.37 2.07∼2.13 4.20∼4.45 248.0 3.63∼3.77
Chry 5.86 2.58∼3.20 1.21∼2.37 2.06∼2.11 4.23∼4.48 251.0 3.61∼3.75
B(b)F 5.75 0.29∼0.32 1.25∼2.46 2.08∼2.13 4.19∼4.44 268.9 3.63∼3.78
B(k)F 6.00 0.26∼0.29 1.25∼2.46 2.08∼2.13 4.19∼4.44 268.9 3.63∼3.78
B(a)P 6.04 0.20∼0.22 1.25∼2.46 2.11∼2.16 4.14∼4.38 263.0 3.67∼3.81
Ind 6.54 0.15∼0.16 1.29∼2.53 2.14∼2.19 4.08∼4.32 277.0a 3.70∼3.85
B(ghi)P 6.50 0.14∼0.15 1.29∼2.53 2.14∼2.19 4.08∼4.32 277.0 3.70∼3.85
α-HCH 3.82 1.47∼1.61 1.31∼2.57 2.37∼2.43 3.68∼3.90 243.6 3.97∼4.12
β-HCH 3.80 0.17∼0.19 1.31∼2.57 2.37∼2.43 3.68∼3.90 243.6 3.97∼4.12
γ-HCH 3.72 1.10∼1.15 1.31∼2.57 2.37∼2.43 3.68∼3.90 243.6 3.97∼4.12
4, 4′
-DDD 6.33 4.80∼5.22 1.35∼2.66 2.14∼2.19 4.08∼4.32 312.6 3.70∼3.85
4, 4′
-DDE 6.93 29.0∼33.1 1.35∼2.65 2.16∼2.22 4.03∼4.27 305.2 3.73∼3.88
4, 4′
-DDT 6.39 5.05∼5.73 1.40∼2.75 2.16∼2.22 4.03∼4.26 333.5 3.73∼3.88
a
ACPD
9, 13235–13269, 2009SVOCs in Singapore’s coastal
environment
J. He and R. Balasubramanian
Title Page
Abstract Introduction
Conclusions References
Tables Figures
◭ ◮
◭ ◮
Back Close
Full Screen / Esc
Printer-friendly Version
Interactive Discussion Table 2.Annual mean atmospheric fluxes of selected SVOCs.
Compound Dry deposition flux (Mean±S.D.) Wet deposition flux (Mean±S.D.) Air-sea exchange (Mean±S.D.)
PAHs µg m−2y−1
µg m−2y−1 ng m−2day−1
Naph 65.3±56.0 850.7±428.8 −1608.4±869.6
Acy 28.0±13.1 62.9±60.9 –
Ace 32.7±20.5 102.7±106.5 −36.5±8.0
Flu 19.6±10.3 82.6±46.0 −27.3±22.0
Phe 130.6±78.4 554.4±395.6 −457.7±489.7
Ant 19.6±14.0 68.1±91.4 −210.6±53.9
Flt 112.0±88.6 165.6±133.2 −394.5±283.5
Pyr 140.0±13.1 162.2±156.5 −674.4±359.3
B(a)A 62.5±52.3 47.2±39.2 −192.2±137.4
Chry 121.3±102.6 108.3±95.2 −825.1±669.0
B(b)F 102.6±78.4 142.1±107.7 −383.1±131.7
B(k)F 62.5±72.8 12.4±14.3 −405.6±386.8
B(a)P 75.6±89.6 7.7±6.8 −630.0±563.0
Ind 149.3±168.0 11.9±7.8 −21.7±20.2
DB(ah)A 39.2±67.2 27.1±15.9 –
B(ghi)P 168.0±121.3 42.2±39.4 −17.0±6.6
ΣPAHs 1328.8±961.1 6,667.1±1,745.2 −5884.0±4040.7
OCPs ng m−2y−1 µg m−2y−1 ng m−2day−1
α-HCH 1847.6±1136.8 45.5±36.8 −73.7±31.3
β-HCH 625.2±439.8 8.7±8.8 −44.4±37.8
γ-HCH 1390.3±711.5 24.4±19.1 −48.4±30.4
δ-HCH 933.1±765.2 5.8±4.6 –
4, 4′
-DDD 54.1±74.6 0.45±0.44 −2.9±1.8
4, 4′-DDE 41.1
±35.5 0.71±0.89 −0.74±0.67 4, 4′
-DDT 531.9±261.3 1.9±1.4 −1.1±0.85
ΣOCPs 5421.4±3426.7 87.5±72.1 −171.3±102.8
PCBs ng m−2y−1
CB 17+18 58.8±34.5 – –
CB 28+31 14.9±10.9 – –
CB 33 9.3±2.8 – –
CB 52+49 34.5±22.4 – –
CB 44 31.7±22.4 – –
CB 74 29.9±23.3 – –
CB 70+95 17.7±13.1 – –
CB 101 39.2±46.7 – –
CB 99 24.3±16.8 – –
CB 110 34.5±28.0 – –
CB 149 168.0±105.3 – –
CB 138+158 121.3±79.3 – –
CB 171 63.5±9.3 – –
CB 177 43.9±21.5 – –
CB 180 51.3±49.5 – –
CB 183 72.8±9.3 – –