27
APPENDIX
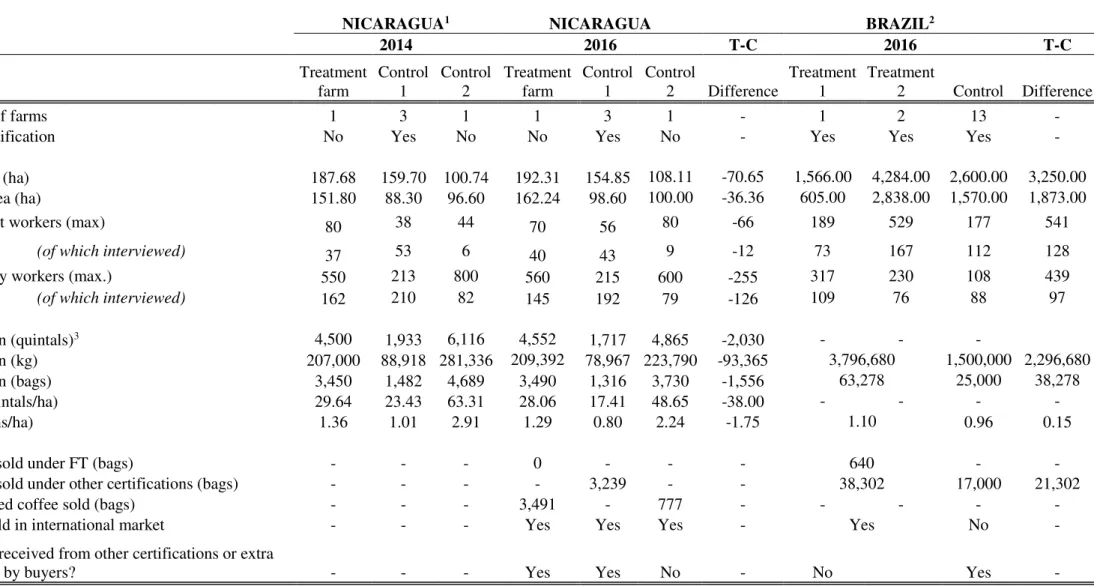
Table B1 – Descriptive table: Characteristics of the studied farms
NICARAGUA1 NICARAGUA BRAZIL2
2014 2016 T-C 2016 T-C
Treatment farm
Control 1
Control 2
Treatment farm
Control 1
Control
2 Difference
Treatment 1
Treatment
2 Control Difference
Number of farms 1 3 1 1 3 1 - 1 2 13 -
Other certification No Yes No No Yes No - Yes Yes Yes -
Farm size (ha) 187.68 159.70 100.74 192.31 154.85 108.11 -70.65 1,566.00 4,284.00 2,600.00 3,250.00
Coffee area (ha) 151.80 88.30 96.60 162.24 98.60 100.00 -36.36 605.00 2,838.00 1,570.00 1,873.00
Permanent workers (max) 80 38 44 70 56 80 -66 189 529 177 541
(of which interviewed) 37 53 6 40 43 9 -12 73 167 112 128
Temporary workers (max.) 550 213 800 560 215 600 -255 317 230 108 439
(of which interviewed) 162 210 82 145 192 79 -126 109 76 88 97
Production (quintals)3 4,500 1,933 6,116 4,552 1,717 4,865 -2,030 - - -
Production (kg) 207,000 88,918 281,336 209,392 78,967 223,790 -93,365 3,796,680 1,500,000 2,296,680
Production (bags) 3,450 1,482 4,689 3,490 1,316 3,730 -1,556 63,278 25,000 38,278
Yield (quintals/ha) 29.64 23.43 63.31 28.06 17.41 48.65 -38.00 - - - -
Yield (tons/ha) 1.36 1.01 2.91 1.29 0.80 2.24 -1.75 1.10 0.96 0.15
Quantity sold under FT (bags) - - - 0 - - - 640 - -
Quantity sold under other certifications (bags) - - - - 3,239 - - 38,302 17,000 21,302
No certified coffee sold (bags) - - - 3,491 - 777 - - - - -
Coffee sold in international market - - - Yes Yes Yes - Yes No -
Premium received from other certifications or extra
price paid by buyers? - - - Yes Yes No - No Yes -
28
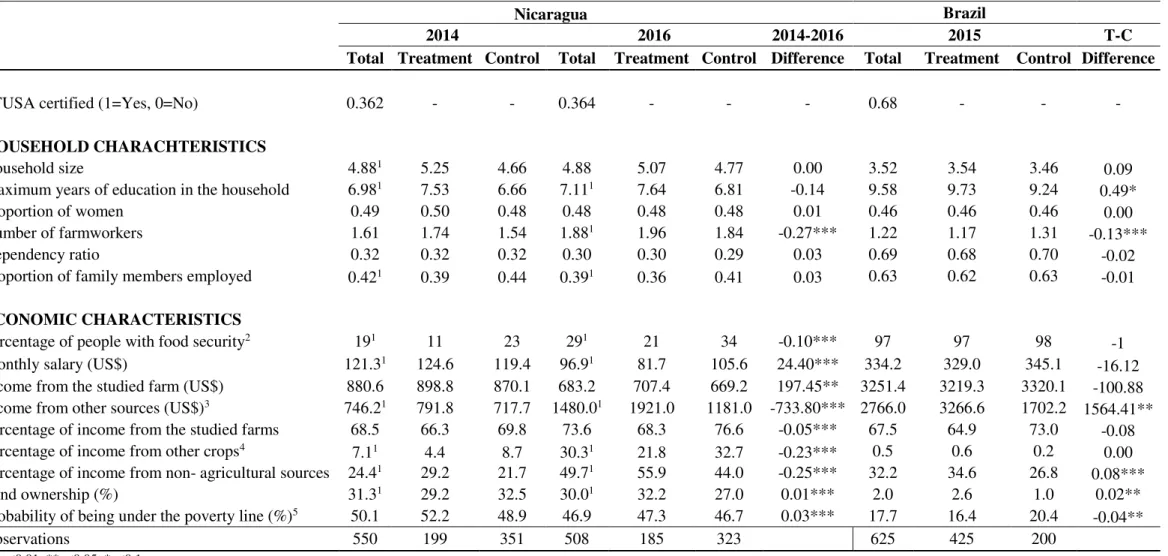
Table B2
–
Descriptive: households’ characteristics
Nicaragua Brazil
2014 2016 2014-2016 2015 T-C
Total Treatment Control Total Treatment Control Difference Total Treatment Control Difference
FTUSA certified (1=Yes, 0=No) 0.362 - - 0.364 - - - 0.68 - - -
HOUSEHOLD CHARACHTERISTICS
Household size 4.881 5.25 4.66 4.88 5.07 4.77 0.00 3.52 3.54 3.46 0.09
Maximum years of education in the household 6.981 7.53 6.66 7.111 7.64 6.81 -0.14 9.58 9.73 9.24
0.49*
Proportion of women 0.49 0.50 0.48 0.48 0.48 0.48 0.01 0.46 0.46 0.46 0.00
Number of farmworkers 1.61 1.74 1.54 1.881 1.96 1.84 -0.27*** 1.22 1.17 1.31
-0.13***
Dependency ratio 0.32 0.32 0.32 0.30 0.30 0.29 0.03 0.69 0.68 0.70 -0.02
Proportion of family members employed 0.421 0.39 0.44 0.391 0.36 0.41 0.03 0.63 0.62 0.63 -0.01
ECONOMIC CHARACTERISTICS
Percentage of people with food security2 191 11 23 291 21 34 -0.10*** 97 97 98
-1
Monthly salary (US$) 121.31 124.6 119.4 96.91 81.7 105.6 24.40*** 334.2 329.0 345.1
-16.12 Income from the studied farm (US$) 880.6 898.8 870.1 683.2 707.4 669.2 197.45** 3251.4 3219.3 3320.1 -100.88 Income from other sources (US$)3 746.21 791.8 717.7 1480.01 1921.0 1181.0 -733.80*** 2766.0 3266.6 1702.2 1564.41** Percentage of income from the studied farms 68.5 66.3 69.8 73.6 68.3 76.6 -0.05*** 67.5 64.9 73.0 -0.08
Percentage of income from other crops4 7.11 4.4 8.7 30.31 21.8 32.7 -0.23*** 0.5 0.6 0.2 0.00
Percentage of income from non- agricultural sources 24.41 29.2 21.7 49.71 55.9 44.0 -0.25*** 32.2 34.6 26.8
0.08***
Land ownership (%) 31.31 29.2 32.5 30.01 32.2 27.0 0.01*** 2.0 2.6 1.0 0.02**
Probability of being under the poverty line (%)5 50.1 52.2 48.9 46.9 47.3 46.7 0.03*** 17.7 16.4 20.4
-0.04**
Observations 550 199 351 508 185 323 625 425 200
*** p<0.01, **p<0.05, *p<0.1.
The table reports the descriptive characteristics of Brazil and Nicaragua (baseline and end line). The first column of each group reports the total average, while the second and the third show respectively the average of the treatment and the control group. It is also reported the difference between baseline and end line in Nicaragua and between treatment and control in Brazil, with their significance levels. (1) The difference between treatment and control group is statistically significant. (2) Food security is measured with the ELSCA
index(3) Income from other sourcesincludes the income from farmworkers’ own land and from other non-agricultural sources. (4) Other cropsrefers to farmworkers’ own crops.
29
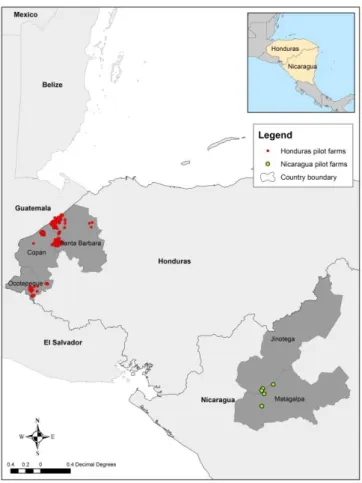
MAPS OF THE STUDIED FARMS
Figure 1 - Research sites in Nicaragua
Source: International center for tropical agriculture (2014)
Figure 2 – Research sites in Brazil
30
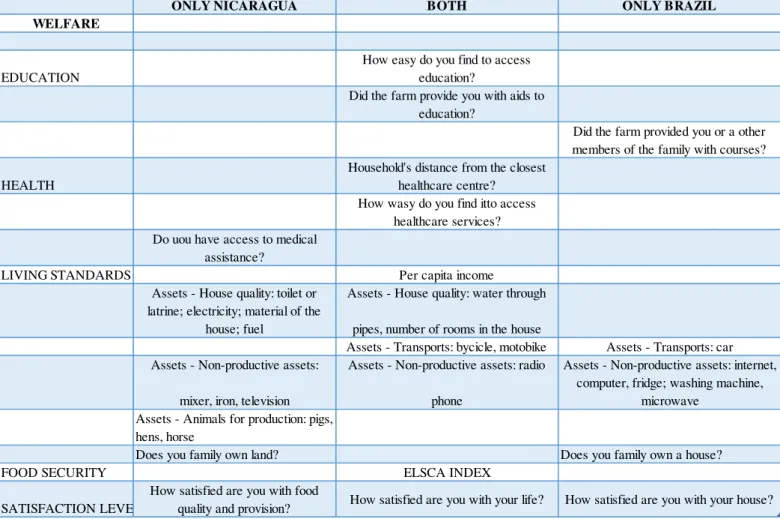
TABLE C1: INDEX OF WELFARE
ONLY NICARAGUA BOTH ONLY BRAZIL
WELFARE
EDUCATION
How easy do you find to access education?
Did the farm provide you with aids to education?
Did the farm provided you or a other members of the family with courses?
HEALTH
Household's distance from the closest healthcare centre?
How wasy do you find itto access healthcare services? Do uou have access to medical
assistance?
LIVING STANDARDS Per capita income
Assets - House quality: toilet or latrine; electricity; material of the
house; fuel
Assets - House quality: water through
pipes, number of rooms in the house
Assets - Transports: bycicle, motobike Assets - Transports: car Assets - Non-productive assets:
mixer, iron, television
Assets - Non-productive assets: radio
phone
Assets - Non-productive assets: internet, computer, fridge; washing machine,
microwave Assets - Animals for production: pigs,
hens, horse
Does you family own land? Does you family own a house?
FOOD SECURITY ELSCA INDEX
SATISFACTION LEVEL
How satisfied are you with food
31
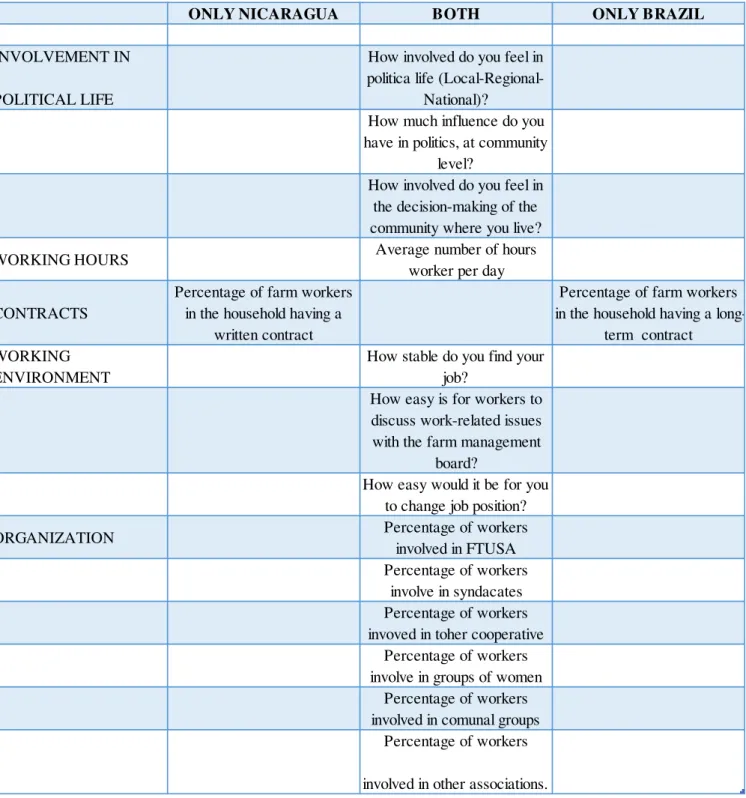
TABLE C2: INDEX OF EMPOWERMENT
ONLY NICARAGUA BOTH ONLY BRAZIL
INVOLVEMENT IN
POLITICAL LIFE
How involved do you feel in politica life
(Local-Regional-National)?
How much influence do you have in politics, at community
level?
How involved do you feel in the decision-making of the community where you live?
WORKING HOURS Average number of hours
worker per day
CONTRACTS
Percentage of farm workers in the household having a
written contract
Percentage of farm workers in the household having a
long-term contract WORKING
ENVIRONMENT
How stable do you find your job?
How easy is for workers to discuss work-related issues with the farm management
board?
How easy would it be for you to change job position?
ORGANIZATION Percentage of workers
involved in FTUSA Percentage of workers
involve in syndacates Percentage of workers invoved in toher cooperative
Percentage of workers involve in groups of women
Percentage of workers involved in comunal groups
Percentage of workers
32
GRAPH 1: PROPENSITY SCORE MATCHING IN NICARAGUA
GRAPH 2: PROPENSITY SCORE MATCHING IN BRAZIL
Graph 1 and 2 show the results of the propensity score matching. They show the distribution of the propensity scores in the treatment and control group before and after the matching. The overlapped zone corresponds to the area of common support.
0
1
2
3
0 .2 .4 .6 .8
propensity scores BEFORE matching
treated control 0 1 2 3 k d e n s it y _ p s c o re
.2 .4 .6 .8
propensity scores AFTER matching
treated control 0 1 2 3 4
.2 .4 .6 .8 1
propensity scores BEFORE matching
treated control 0 1 2 3 4 k d e n s it y _ p s c o re
.2 .4 .6 .8 1
propensity scores AFTER matching
33
TABLE D1
–
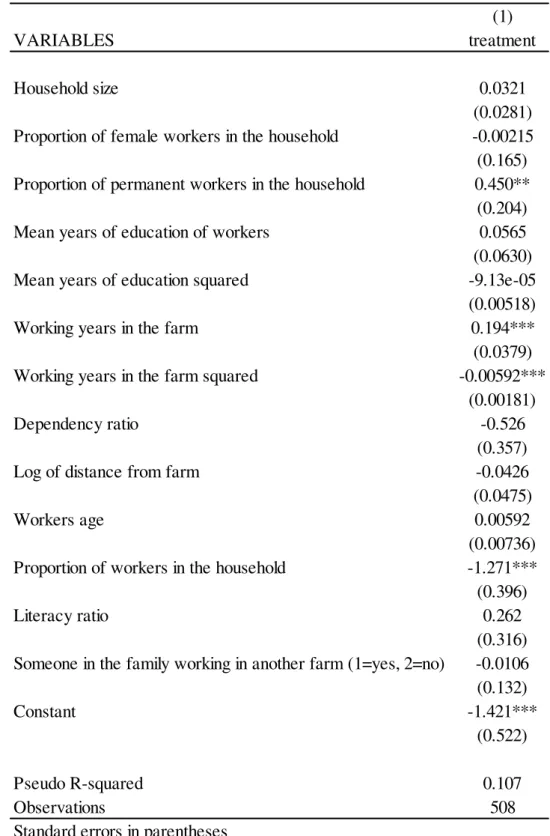
NICARAGUA: Propensity score matching
–
Estimation of the p-score
Table D1 reports the results of the logit regression of the independent variables on the treatment, in order to calculate the propensity score used to match control and treated units.
(1)
VARIABLES
treatment
Household size
0.0321
(0.0281)
Proportion of female workers in the household
-0.00215
(0.165)
Proportion of permanent workers in the household
0.450**
(0.204)
Mean years of education of workers
0.0565
(0.0630)
Mean years of education squared
-9.13e-05
(0.00518)
Working years in the farm
0.194***
(0.0379)
Working years in the farm squared
-0.00592***
(0.00181)
Dependency ratio
-0.526
(0.357)
Log of distance from farm
-0.0426
(0.0475)
Workers age
0.00592
(0.00736)
Proportion of workers in the household
-1.271***
(0.396)
Literacy ratio
0.262
(0.316)
Someone in the family working in another farm (1=yes, 2=no)
-0.0106
(0.132)
Constant
-1.421***
(0.522)
Pseudo R-squared
0.107
Observations
508
34
TABLE D2
–
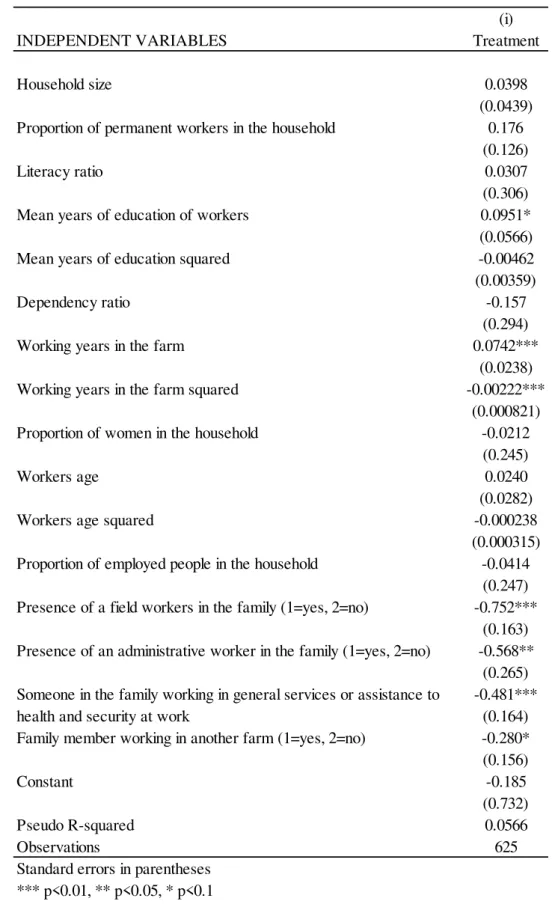
BRAZIL: Propensity score matching
–
Estimation of the p-score
Table D2 report the results of the logit regression of the independent variables on the treatment, in order to calculate the propensity score used to match control and treated units.
(i)
INDEPENDENT VARIABLES Treatment
Household size 0.0398
(0.0439) Proportion of permanent workers in the household 0.176
(0.126)
Literacy ratio 0.0307
(0.306)
Mean years of education of workers 0.0951*
(0.0566)
Mean years of education squared -0.00462
(0.00359)
Dependency ratio -0.157
(0.294)
Working years in the farm 0.0742***
(0.0238)
Working years in the farm squared -0.00222***
(0.000821)
Proportion of women in the household -0.0212
(0.245)
Workers age 0.0240
(0.0282)
Workers age squared -0.000238
(0.000315) Proportion of employed people in the household -0.0414
(0.247) Presence of a field workers in the family (1=yes, 2=no) -0.752***
(0.163) Presence of an administrative worker in the family (1=yes, 2=no) -0.568**
(0.265) -0.481***
(0.164) Family member working in another farm (1=yes, 2=no) -0.280* (0.156)
Constant -0.185
(0.732)
Pseudo R-squared 0.0566
Observations 625
Standard errors in parentheses *** p<0.01, ** p<0.05, * p<0.1
35
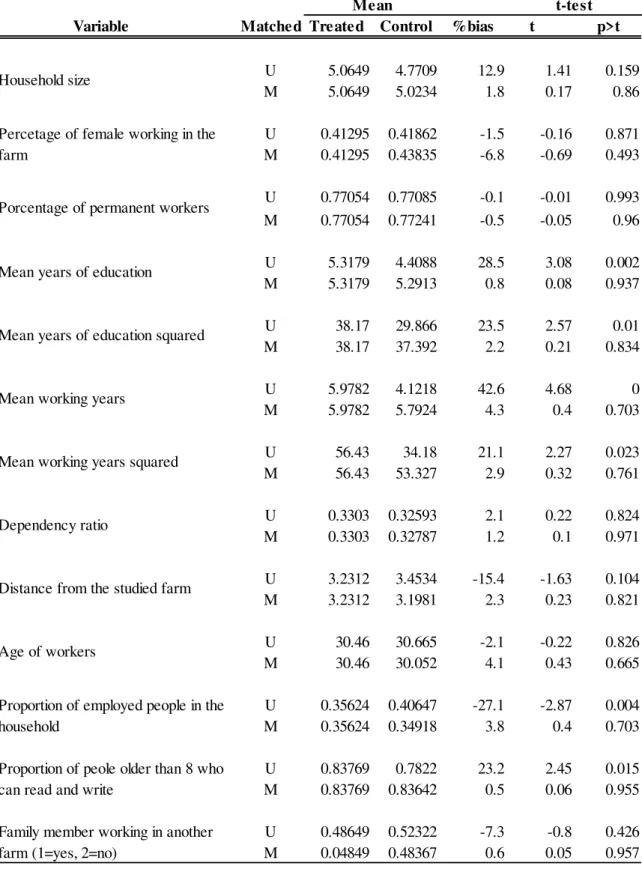
TABLE E1 – NICARAGUA -
Propensity score matching:
test of differences in meansTable E1 reports the results of the t-test between treated and control units in the variables used to calculate the propensity score. The p-values reported in columns (iv) reveal that in the matched sample there are not statistically significant differences between treated and control units, which means that the matching was successful. The results are confirmed by the standardized percentage bias reported in column (iii), which needs to be less than 10%.
Variable Matched Treated Control %bias t p>t
U 5.0649 4.7709 12.9 1.41 0.159 M 5.0649 5.0234 1.8 0.17 0.86
U 0.41295 0.41862 -1.5 -0.16 0.871 M 0.41295 0.43835 -6.8 -0.69 0.493
U 0.77054 0.77085 -0.1 -0.01 0.993 M 0.77054 0.77241 -0.5 -0.05 0.96
U 5.3179 4.4088 28.5 3.08 0.002 M 5.3179 5.2913 0.8 0.08 0.937
U 38.17 29.866 23.5 2.57 0.01 M 38.17 37.392 2.2 0.21 0.834
U 5.9782 4.1218 42.6 4.68 0 M 5.9782 5.7924 4.3 0.4 0.703
U 56.43 34.18 21.1 2.27 0.023 M 56.43 53.327 2.9 0.32 0.761
U 0.3303 0.32593 2.1 0.22 0.824 M 0.3303 0.32787 1.2 0.1 0.971
U 3.2312 3.4534 -15.4 -1.63 0.104 M 3.2312 3.1981 2.3 0.23 0.821
U 30.46 30.665 -2.1 -0.22 0.826 M 30.46 30.052 4.1 0.43 0.665
U 0.35624 0.40647 -27.1 -2.87 0.004 M 0.35624 0.34918 3.8 0.4 0.703
U 0.83769 0.7822 23.2 2.45 0.015 M 0.83769 0.83642 0.5 0.06 0.955
U 0.48649 0.52322 -7.3 -0.8 0.426 M 0.04849 0.48367 0.6 0.05 0.957 Mean years of education
Mean t-test
Household size
Percetage of female working in the farm
Porcentage of permanent workers
Proportion of employed people in the household
Proportion of peole older than 8 who can read and write
Family member working in another farm (1=yes, 2=no)
Mean years of education squared
Mean working years
Mean working years squared
Dependency ratio
Distance from the studied farm
36
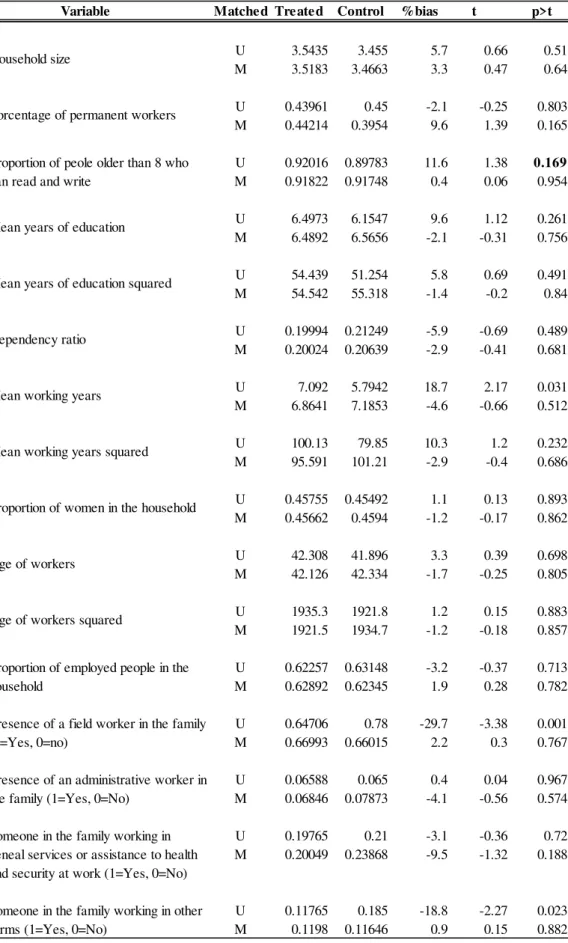
TABLE E2: BRAZIL
–
Propensity score matching: test of difference in means
See note to table E1.
t-test
Variable Matched Treated Control %bias t p>t
U 3.5435 3.455 5.7 0.66 0.51 M 3.5183 3.4663 3.3 0.47 0.64
U 0.43961 0.45 -2.1 -0.25 0.803 M 0.44214 0.3954 9.6 1.39 0.165
U 0.92016 0.89783 11.6 1.38 0.169 M 0.91822 0.91748 0.4 0.06 0.954
U 6.4973 6.1547 9.6 1.12 0.261 M 6.4892 6.5656 -2.1 -0.31 0.756
U 54.439 51.254 5.8 0.69 0.491 M 54.542 55.318 -1.4 -0.2 0.84
U 0.19994 0.21249 -5.9 -0.69 0.489 M 0.20024 0.20639 -2.9 -0.41 0.681
U 7.092 5.7942 18.7 2.17 0.031 M 6.8641 7.1853 -4.6 -0.66 0.512
U 100.13 79.85 10.3 1.2 0.232 M 95.591 101.21 -2.9 -0.4 0.686
U 0.45755 0.45492 1.1 0.13 0.893 M 0.45662 0.4594 -1.2 -0.17 0.862
U 42.308 41.896 3.3 0.39 0.698 M 42.126 42.334 -1.7 -0.25 0.805
U 1935.3 1921.8 1.2 0.15 0.883 M 1921.5 1934.7 -1.2 -0.18 0.857
U 0.62257 0.63148 -3.2 -0.37 0.713 M 0.62892 0.62345 1.9 0.28 0.782
U 0.64706 0.78 -29.7 -3.38 0.001 M 0.66993 0.66015 2.2 0.3 0.767
U 0.06588 0.065 0.4 0.04 0.967 M 0.06846 0.07873 -4.1 -0.56 0.574
U 0.19765 0.21 -3.1 -0.36 0.72 M 0.20049 0.23868 -9.5 -1.32 0.188
U 0.11765 0.185 -18.8 -2.27 0.023 M 0.1198 0.11646 0.9 0.15 0.882 Proportion of employed people in the
household
Presence of a field worker in the family (1=Yes, 0=no)
Presence of an administrative worker in the family (1=Yes, 0=No)
Someone in the family working in geneal services or assistance to health and security at work (1=Yes, 0=No)
Someone in the family working in other farms (1=Yes, 0=No)
Age of workers squared
Mean
Household size
Porcentage of permanent workers
Proportion of peole older than 8 who can read and write
Mean years of education
Mean years of education squared
Dependency ratio
Mean working years
Mean working years squared
Proportion of women in the household
37
ATTRITION
In footnote 14 of the paper, we introduced the problem of attrition regarding the Nicaraguan sample.
As both households in treatment and control group left, attrition was not a big issue in our study.
However, it is worth to show how replacement was done. . The replacement was done randomly among
those farmworkers coming from the same communities of the workers who had left, assuming that
they had similar cultural background, lifestyle, living costs and cost of transport to the farm. In this
way, they built a new sample, comparable to the previous one and to the treatment group. Households
who left the sample were replaced with new households similar in characteristics. In table F1 we
compared people who left the sample with people who stayed in the sample, to understand the
characteristics of the ones who had left. We found that people who left had higher percentage of
temporary workers in the family, were more distant to the farm and had lower salary and per capita
income. Table F2 shows that new households were similar to the old households in most
characteristics.
Table F1
Comparison between people who left the treatment and people who stayed
STAYED
LEFT
DIFFERENCE
Treatment (1=yes, 0=no) 41.71 58.29 -16.58***
Proportion of temporary workers 0.8634189 0.9352337 -0.072***
Distance from farm (minutes on foot) 44.92 74.44 -29.52***
Living on farm (1=yes, 0=no) 0.227 0.773 -0.546***
Household size 5.065 4.78 0.285
Proportion of female in the household 0.49 0.49 0
Dependency ratio 0.32 0.32 0
Mean years of education of workers 3.73 4.36 -0.63**
Mean years worked in the farm 5.77 3.84 1.93***
Proportion of employed people in the family 0.41 0.42 -0.01
Age of workers 32.26 29.73 2.53**
Per capita income 287.38 176.93 110.45***
Monthly salary 125.2 113.3 11.3*
38
Table F2
Comparison between replaced and replacement households
Old who left New who replaced DIFFERENCE
Proportion of temporary workers 0.05 0.136 -0.086***
Household size 4.78 4.8 -0.02
Dependency ratio 0.322 0.335 -0.013
Mean years of education of workers 4.36 4.77 -0.47**
Mean years worked in the farm 3.84 3.8 0.04
Proportion of employed people in the family 0.42 0.39 0.03
Age of workers 29.73 29.85 2.53**
ANALYSIS OF COFFEE MARKET
Graph 3– Changes in coffee production in Brazil and Nicaragua.
Period: 2011-2016. Source: re-elaboration on data from ICO (International Coffee Organization)
-15% -10% -5% 0% 5% 10% 15% 20% 25% 30% 35% 40%
2011/12 2012/13 2013/14 2014/15 2015/16
Coffee production (% change from previous year)
39
Graph 4– Changes in coffee prices paid to growers in Brazil, Nicaragua and Honduras. Period: 2011-2016
Source: re-elaboration on data from ICO (International Coffee Organization)
Graph 5– Changes in coffee exports from Brazil, Nicaragua and Honduras. Period: 2011-2016
Source: re-elaboration on data from ICO (International Coffee Organization)
-60% -40% -20% 0% 20% 40% 60% 80% 100%
2009 2010 2011 2012 2013 2014 2015
Prices paid to coffee growers
(% change from the previous year
)
Brazil Nicaragua Brazil export Nicaragua exports
-15% -10% -5% 0% 5% 10% 15% 20%
2009/10 2010/11 2011/12 2012/13 2013/14 2014/15