Validation of the Beck Depression
Inventory for a Portuguese-speaking
Chinese community in Brazil
1Departamento e Instituto de Psiquiatria (LIM-23), Faculdade de Medicina,
Universidade de São Paulo, São Paulo, SP, Brasil
2Departamento de Psiquiatria, Faculdade de Medicina de Santo Amaro,
UNISA, São Paulo, SP, Brasil
3Departamento de Farmacologia, Instituto de Ciências Biomédicas,
Universidade de São Paulo, São Paulo, SP, Brasil Y.-P. Wang1,2,
L.H. Andrade1 and
C. Gorenstein1,3
Abstract
The objective of the present study was to investigate the psychometric properties and cross-cultural validity of the Beck Depression Inven-tory (BDI) among ethnic Chinese living in the city of São Paulo, Brazil. The study was conducted on 208 community individuals. Reliability and discriminant analysis were used to test the psychomet-ric properties and validity of the BDI. Principal component analysis was performed to assess the BDI’s factor structure for the total sample and by gender. The mean BDI score was lower (6.74, SD = 5.98) than observed in Western counterparts and showed no gender difference, good internal consistency (Cronbach’s alpha 0.82), and high discrimi-nation of depressive symptoms (75-100%). Factor analysis extracted two factors for the total sample and each gender: cognitive-affective dimension and somatic dimension. We conclude that depressive symp-toms can be reliably assessed by the BDI in the Brazilian Chinese population, with a validity comparable to that for international studies. Indeed, cultural and measurement biases might have influenced the response of Chinese subjects.
Correspondence
Y.-P. Wang Instituto de Psiquiatria Hospital das Clínicas, FM, USP R. Dr. Ovídio P. de Campos, 785 05403-010 São Paulo, SP Brasil
Fax: +55-11-5087-9475. E-mail: gnap_inbox@hotmail.com
Publication supported by FAPESP.
Received April 22, 2004 Accepted December 16, 2004
Key words
•Depressive symptoms •Beck Depression Inventory •Psychometric properties •Validation of Depression
Inventory
•Portuguese-speaking
Chinese
•Factor analysis
Introduction
As the consequence of many migrations, Chinese communities can be found in almost every country in the world. The Chinese population is the planet’s largest ethnic group, comprising one fourth of the world’s popula-tion, and any understanding of psychiatric disorders should take the Chinese people into account. Frequently attached to their indigenous behavioral norms and traditional cultural beliefs, Chinese immigrants are in
constant change. Their real mental health status is unknown and hard to capture, and is the result of experiences of acculturation, social deprivation, uprootedness, adaptation, assimilation, Westernization, urbanization, coping style, and their own specific health-seeking behavior (1-5).
meaning of affect-loaded items relies on the respondent’s interpretation. Reporting de-pressive symptoms may also be influenced by serious cultural biases in non-Western populations (e.g., language, social desirabil-ity of some behaviors), thereby resulting in poor validity. English-driven psychological advances are often adopted without any vali-dation by researchers in different countries, and for this reason, validating psychological assessment measures with non-Anglo popu-lations is a very important endeavor.
The original version of the Beck Depres-sion Inventory (BDI) was introduced in 1961 (6), and its reliability and validity have been established across a broad spectrum of clini-cal and non-cliniclini-cal populations (7). Trans-lated into and validated in many different languages, the BDI was validated for the Chinese culture in its Chinese version (8). The Portuguese version of the BDI has proved to be reliable and valid for the Brazilian population (9-11). The aims of the present study were: 1) to assess the psychometric properties of the Portuguese version of the BDI among ethnic Chinese living in Brazil, and 2) to evaluate the validity of applying this Portuguese version of BDI for a cultur-ally diverse sample of Chinese immigrants.
Material and Methods
Subjects
This study is part of a cross-sectional ob-servational study (5) of non-psychotic psycho-pathology in a Chinese sample living in São Paulo, the most economically important city in Brazil. Community members were approached after Sunday services in a Chinese Protestant church and were asked to fill out the question-naire. Only those with both parents of Chinese ethnicity and aged 15 years and over were considered to be eligible.
From the original sample of 214 Chinese individuals, we excluded 6 subjects because they returned incomplete questionnaires. The
study sample (N = 208) had a mean age of 24.9 (standard deviation, SD = 7.39), and included more women (57.7%). Most indi-viduals were single (79.1%), students (64.5%), Protestants (80.1%), had univer-sity education (87.2%), and were born in Brazil, representing second-generation Chi-nese (72.0%). Fifty-six individuals (28.0%) had emigrated from China (first-generation immigrants), about 21.13 years before the study (SD = 7.75). Most of the individuals in this sample consisted of bilingual subjects speaking both Portuguese and Chinese.
BDI
The BDI is a 21-item self-report rating inventory that measures symptoms and char-acteristic attitudes of depression in the previ-ous two weeks (6); the severity of each indi-vidual item is scored from 0 to 3. There is reliability and validity evidence for both the Portuguese version (9-11) and the Chinese version (1,4,8,12-15). For this Portuguese-speaking Chinese sample we employed the Portuguese version of the BDI.
Statistical analysis
The scores for the BDI items were com-pared by gender using the independent-sample t-test. The internal consistency for
BDI was calculated by Cronbach’s alpha coefficient. Item-total correlation was evalu-ated to identify which items were associevalu-ated more with the BDI total score.
The psychometric properties of the BDI were compared by gender and level of de-pressive symptomatology according to Kendall’s (16) cut-off for non-clinical popu-lations: “non-depressed” subgroup, BDI ≤15; “dysphoria” subgroup, 16 ≤ BDI ≤ 20; “de-pressed” subgroup, BDI >20. Individual item means were compared by the Student t-test
values, P< 0.002).
Stepwise discriminant analysis models were applied to test: 1) if the possibly “de-pressed” and “non-de“de-pressed” subgroups could be separated according to all indi-vidual items, and 2) if these subgroups could be separated according to depression-specif-ic and -nonspecifdepression-specif-ic items, defined as fol-lows: specific items - sadness, pessimism, sense of failure, guilt feelings, self-dislike, suicidal thoughts, and weight loss; nonspe-cific items - work inhibition, sleep distur-bance, fatigability, and loss of libido (17).
Before performing factor analysis, we inspected the correlation matrix to check the strength of the correlation, and then we tested factorability using the Kaiser-Meyer-Olkin (KMO) measure for sampling adequacy and Bartlett’s test of sphericity. Principal com-ponent analysis (PCA) with varimax rota-tion was performed using the scree test as a factor retention criterion. The statistical pack-age SPSS was used for the analysis.
Results
BDI item endorsement and internal consistency
Item consistency analysis was carried out for the BDI raw scale by correlating item scores with total scale score. The corrected item-total correlation coefficient between each item score and the total BDI scores ranged from 0.11 to 0.58. In Table 1, item-total correlations for the item-total sample were higher (>0.5) for items 3, 4, 5, 7, and 17. In contrast, items 13, 18 and 19, i.e., indeci-siveness, loss of appetite and weight loss, respectively, had a correlation coefficient of
r < 0.3 with the total scale. Additionally,
inter-item consistency values (Cronbach’s alpha) of 0.818, 0.818, 0.821 were obtained for the total sample and female and male subgroups.
Table 1 also shows the overall mean BDI scores and SD for the total sample and
ac-cording to gender. Gender differences were not significant, with all mean scores for indi-vidual BDI items being similar for both gen-ders (P > 0.05). There was no significant difference in total scores for males (mean ± SD = 6.88 ± 5.97) or females (6.64 ± 6.01, t
= - 0.291, d.f. = 206, P = 0.77). The magni-tude of the difference in the means was very small (eta-squared = 0.0004).
Severe depression (BDI >20) was ob-served in 4.8% (N = 10) of the sample as a whole, dysphoria (BDI between 16 and 20) was observed in 11 subjects (5.3%), and the remaining 89.9% who scored 15 or less on the BDI scale were non-depressive. Consid-ering the sample by gender, 4.1% of women (N = 5) had scores compatible with depres-sion, in contrast to 5.6% of men (N = 5). The depressed subgroup showed significantly higher scores than the non-depressed
sub-Table 1. Item-total correlations for the total sample and scores for individual Beck Depression Inventory (BDI) items for the total sample and according to gender.
Item Item-total Total Women Men correlation
Mean ± SD Mean ± SD Mean ± SD
1. Sadness 0.31 0.67 ± 0.53 0.72 ± 0.54 0.60 ± 0.51 2. Pessimism 0.36 0.32 ± 0.51 0.30 ± 0.53 0.34 ± 0.50 3. Sense of failure 0.57 0.35 ± 0.64 0.41 ± 0.70 0.26 ± 0.55 4. Lack of satisfaction 0.55 0.44 ± 0.72 0.41 ± 0.68 0.48 ± 0.77 5. Guilt feelings 0.57 0.23 ± 0.60 0.20 ± 0.64 0.26 ± 0.53 6. Sense of punishment 0.32 0.27 ± 0.66 0.28 ± 0.71 0.26 ± 0.59 7. Self-dislike 0.58 0.38 ± 0.73 0.34 ± 0.72 0.44 ± 0.74 8. Self-accusations 0.43 0.42 ± 0.73 0.38 ± 0.71 0.47 ± 0.75 9. Suicidal wishes 0.31 0.06 ± 0.29 0.05 ± 0.32 0.06 ± 0.25 10. Crying spells 0.38 0.35 ± 0.67 0.31 ± 0.74 0.40 ± 0.70 11. Irritability 0.35 0.48 ± 0.75 0.48 ± 0.63 0.48 ± 0.78 12. Social withdrawal 0.32 0.21 ± 0.43 0.18 ± 0.38 0.26 ± 0.49 13. Indecisiveness 0.24 0.16 ± 0.43 0.19 ± 0.47 0.12 ± 0.36 14. Distortion of body image 0.31 0.17 ± 0.50 0.20 ± 0.55 0.13 ± 0.43 15. Work inhibition 0.48 0.33 ± 0.68 0.28 ± 0.65 0.40 ± 0.73 16. Sleep disturbance 0.32 0.50 ± 0.79 0.52 ± 0.80 0.48 ± 0.78 17. Fatigability 0.53 0.46 ± 0.69 0.48 ± 0.73 0.44 ± 0.64 18. Loss of appetite 0.11 0.20 ± 0.47 0.15 ± 0.42 0.28 ± 0.52 19. Weight loss 0.12 0.29 ± 0.68 0.25 ± 0.61 0.34 ± 0.77 20. Somatic preoccupation 0.35 0.18 ± 0.45 0.19 ± 0.47 0.17 ± 0.43 21. Loss of libido 0.36 0.18 ± 0.51 0.26 ± 0.56 0.12 ± 0.45
Total 6.74 ± 5.98 6.64 ± 6.01 6.88 ± 5.97 Cronbach’s alpha 0.818 0.818 0.821
group for almost all individual items. The item “fatigability” was highly reported by both the non-depressed subgroup and the depressed subgroup. Self-dislike, sense of failure, lack of satisfaction, and guilt feel-ings had high scores in the depressed sub-group, while the non-depressed subgroups reported more sadness, sleep disturbance, and irritability. The lowest scores for the depressed subgroups were on the items loss of appetite, weight loss, indecisiveness, and somatic preoccupation, while the non-de-pressed subgroup reported less suicidal wishes.
Discriminant analysis considering all BDI items showed 97.4% correct classification of non-depressed subjects, 100% of
de-pressed subjects and 97.6% of the total sample. The most powerful discriminating items in ascending order were: 5, 7, 3, 15, 21, and 10, and the least important item was 19.
Discriminant analysis according to spe-cific depression items revealed a 99.0% cor-rect classification for the non-depressed sub-group, 100% for depressed subjects and 99.0% for the total sample. The most impor-tant items were 5, 7, and 3, and the least important was item 19. According to non-specific depression items, there was 97.4% of correct classification for the non-depressed sub-group, 75.0% for depressed subjects and 95.7% for the total sample. The most impor-tant items were 15, 21 and 17.
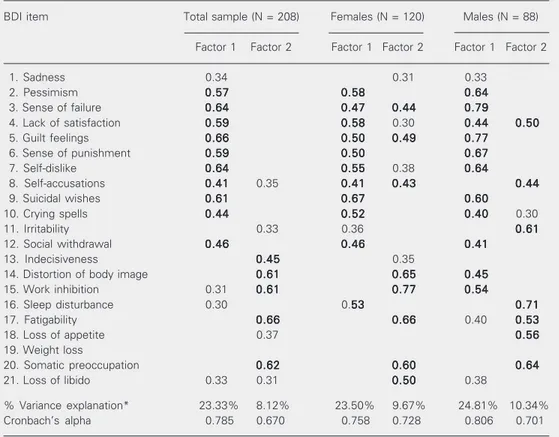
Table 2. Factor loading for the Beck Depression Inventory (BDI) after varimax rotation of the total sample (N = 208) and according to gender.
BDI item Total sample (N = 208) Females (N = 120) Males (N = 88)
Factor 1 Factor 2 Factor 1 Factor 2 Factor 1 Factor 2
1. Sadness 0.34 0.31 0.33
2. Pessimism 0.570.570.570.570.57 0.580.580.580.580.58 0.640.640.640.640.64 3. Sense of failure 0.640.640.640.640.64 0.470.470.470.470.47 0.440.440.440.440.44 0.790.790.790.790.79
4. Lack of satisfaction 0.590.590.590.590.59 0.580.580.580.580.58 0.30 0.440.440.440.440.44 0.500.500.500.500.50 5. Guilt feelings 0.660.660.660.660.66 0.500.500.500.500.50 0.490.490.490.490.49 0.770.770.770.770.77
6. Sense of punishment 0.590.590.590.590.59 0.500.500.500.500.50 0.670.670.670.670.67 7. Self-dislike 0.640.640.640.640.64 0.550.550.550.550.55 0.38 0.640.640.640.640.64
8. Self-accusations 0.410.410.410.410.41 0.35 0.410.410.410.410.41 0.430.430.430.430.43 0.440.440.440.440.44 9. Suicidal wishes 0.610.610.610.610.61 0.670.670.670.670.67 0.600.600.600.600.60
10. Crying spells 0.440.440.440.440.44 0.520.520.520.520.52 0.400.400.400.400.40 0.30 11. Irritability 0.33 0.36 0.610.610.610.610.61 12. Social withdrawal 0.460.460.460.460.46 0.460.460.460.460.46 0.410.410.410.410.41
13. Indecisiveness 0.450.450.450.450.45 0.35
14. Distortion of body image 0.610.610.610.610.61 0.650.650.650.650.65 0.450.450.450.450.45 15. Work inhibition 0.31 0.610.610.610.610.61 0.770.770.770.770.77 0.540.540.540.540.54
16. Sleep disturbance 0.30 0.5353535353 0.710.710.710.710.71 17. Fatigability 0.660.660.660.660.66 0.660.660.660.660.66 0.40 0.530.530.530.530.53 18. Loss of appetite 0.37 0.560.560.560.560.56 19. Weight loss
20. Somatic preoccupation 0.620.620.620.620.62 0.600.600.600.600.60 0.640.640.640.640.64 21. Loss of libido 0.33 0.31 0.500.500.500.500.50 0.38
% Variance explanation* 23.33% 8.12% 23.50% 9.67% 24.81% 10.34% Cronbach’s alpha 0.785 0.670 0.758 0.728 0.806 0.701
Note: Only loadings above 0.40 (boldface) were considered to contribute significantly to the factor. Loadings lower than 0.30 were not considered.
Principal component analysis
The factorability of the total sample and female and male subgroups was accounted for by checking the strength of the relation-ships among variables. Inspection of the cor-relation matrix revealed the presence of many coefficients ≥0.3. The KMO value was 0.80, 0.72, 0.71 for the total sample and the female and male subgroups, respectively. Similarly, the Bartlett test of sphericity was statistically significant (P < 0.0001), supporting a high strength of the relationship among variables. Therefore, all groups presented data suitable for factor analysis.
Although the PCA revealed the presence of seven components with an eigenvalue exceeding 1.0, Cattell’s scree test recom-mended extracting only two components. For the total sample, the two-factor solution explained a total of 31.45% of variance, with the first factor accounting for 23.33% and the second for an additional 8.12% of varia-bility. Factor loading greater than 0.40 was retained in a factor. To aid in the interpreta-tion of these two components, varimax rota-tion was performed. The rotated component matrix (Table 2) revealed the presence of a simple structure, with both components showing a number of salient loadings, and variables loaded substantially on only one of components. For factor 1, the following items presented high loadings: 2, 3, 4, 5, 6, 7, 8, 9, 10, and 12, and for factor 2 items 13, 14, 15, 17, and 20. Cronbach’s alpha coefficients for the subscales based on the items related to factors 1 and 2 were 0.785 and 0.670, respectively. Factor 1 represented the cogni-tive-affective dimension, while factor 2 rep-resented items more related to a somatic-nonspecific dimension (Table 2).
For the female subgroup, two compo-nents were also extracted from the PCA. Unrotated factors accounted for 23.50 and 9.67% of the variance, respectively. The rotated solution showed that items 2, 3, 4, 5, 6, 7, 9, 10, 12, 16, and 20 were related to
factor 1, and items 8, 14, 15, 20, and 21 were related to factor 2. Cronbach’s alpha coeffi-cients for the subscales were 0.758 and 0.728, respectively.
Two factors were also extracted for the male sub-group, accounting for 24.81 and 10.34% of the variance, respectively. The PCA solution suggested that items 2, 3, 5, 6, 7, 9, 10, 12, 14, and 15 were related to factor 1, and items 4, 8, 11, 16, 17, 18, and 20 were related to factor 2. Cronbach’s alpha coeffi-cients for the subscales were 0.806 and 0.701, respectively.
Discussion
BDI reliability and discriminant validity
Previous psychometric studies of the BDI have reported that this instrument has ac-ceptable reliability status (18). Review of internal consistency for the BDI ranges from 0.73 to 0.92, with a mean of 0.86 (7,18), with alpha coefficients of 0.86 and 0.81 for psy-chiatric and non-psypsy-chiatric populations, re-spectively (7). Therefore, our Cronbach’s alpha coefficient of internal consistency of 0.82 demonstrated that the items of this Por-tuguese version of the BDI were homoge-neous. The significant item-total correlation of most items indicated that they actually evaluated the same construct. The findings of low item-total correlation for the items loss of appetite, weight loss and indecisive-ness are also consistent with previous inter-national studies (7,18).
Chi-nese version of BDI (1). The present Portu-guese version of BDI found lower, but ac-ceptable, mean scores of 6.7, 6.6 and 6.9 for the total Chinese sample and for women and men, respectively. This finding may be the result of the sampling effect of selection, of the prevalence and severity of depression among Chinese individuals, of cultural in-fluence (language semantics problem), and of measurement bias.
Most respondents were young bilingual adults (mean age of 24.9) and native Portu-guese speakers (72%). Those who were born in China or were first-generation immigrants had lived in Brazil for more than 20 years and had received Brazilian formal educa-tion. We recruited a convenience sample from a Protestant church attended by the Chinese community; therefore, a selection bias may have influenced the results. The attendees of church activities are considered to be healthier than the general population, and studies have indicated that religiousness is associated with fewer depressive symp-toms (20,21). For this immigrant population, the social network provided by religious meetings may work as a buffer against social isolation or deprivation. So, the cooperative respondents who returned the questionnaire may be healthier than those who do not attend church activities, thereby displaying less severe psychopathology.
The Chinese living in Taiwan (22,23), Mainland China (24), and as immigrants in Los Angeles, CA, USA (2), present a lower prevalence of depression when compared with individuals reported in Western (25) and Brazilian studies (26). These findings are interesting in light of the suggestion of Kleinman (27), who viewed depression in Chinese culture as different, more somatic and less psychological. These cross-cultural studies suggest that culturally mediated val-ues and views of symptoms influence the expression of psychiatric disorders, contrib-uting to the lower expression of depressive symptoms in the Chinese population.
There is no major difference between European-influenced cultures in countries of English and Portuguese background (10), but probably there are marked differences on endorsement rates between Chinese re-spondents to the Portuguese version of the BDI and Brazilian respondents tothe same measurement tool, although the former are well-adapted immigrants and native speak-ers of Portuguese.
Some affect-related constructs may dif-fer cross-culturally in terms of the degree and nature of the affect. For example, sui-cide is regarded as a shameful behavior to talk about in Chinese society. Chinese indi-viduals were less likely to communicate sui-cidal intent and some regard suicide as less effective to solve a problem. To deny or suppress this feared behavior, this term is more commonly expressed in a deficient or indirect mode in the Chinese language (15), e.g., “I will no longer live”, “I don’t want to live anymore”. In contrast, the complaint of “fatigability” has better social acceptance among Chinese people, because being tired may just reflect the result of hard working or be a consequence of a modern lifestyle (28). Avoiding the reporting of suicidal intent may lead to an underestimate of the severity of depressive states, and over-complaining about fatigue may lead more to a diagnosis of neurasthenia or the Western equivalent, chronic fatigue syndrome. As such, the cul-tural sensitivity and appropriateness of the BDI’s Portuguese items need to be deter-mined for the Chinese Portuguese-speaking population in order to render the tool more culturally consonant for with the diverse characteristics of this sample.
male respondents (8,19). The scores of our bilingual respondents on the Portuguese BDI indicated that there was an obvious limita-tion in its applicalimita-tion because there may be a difference in the style and the language of verbal expression of emotional and physical experiences between the Chinese and Bra-zilian culture (15). The ethnic Chinese re-spondents can understand most of the terms, but their semantic interpretation may be dif-ferent. The absence of gender difference on item endorsement rates might have occurred because of lack of content reliability, with some items being semantically meaningless for the Chinese culture.
An alternative explanation for low scores and lack of gender difference on the BDI may be a measurement bias determined by the subjects’ responses to the inventory. A measure deemed relatively easy for one group (e.g., Brazilian, Western) may be regarded as relatively difficult for another group (e.g., Chinese, Asian). When a measure is diffi-cult, a floor effect can be observed, that is, many Chinese subjects obtained lower scores, close or corresponding to the minimum score possible. In this case, the measure was not sensitive to validly differentiate among sub-jects on the construct of interest (e.g., de-pression) and therefore failed to demonstrate gender differences in BDI scores. When there is a floor effect, and/or its counterpart ceil-ing effect, the score differences observed between two comparative groups are not meaningful.
Discriminant function analysis showed that the BDI was able to discriminate effec-tively between groups of depressed and non-depressed subjects in this Chinese popula-tion. We adopted a restrictive cut-off score above 20 as the criterion for considering the presence of depression (16), given that there was no concurrent diagnostic evaluation. The test yielded highly acceptable false-positive (2.6%) and false-negative rates (0%). The depression-specific items strongly predicted group membership (99%), but the
non-spe-cific items performed rather worse for the depressed subgroup (75%).
Discriminant analysis revealed that the translated version of the BDI discriminated well depressive symptoms in Persian (34), Chinese (14), Spanish (35), and Portuguese speaking people (9). Meta-analyses of stud-ies on the BDI content validity (36) revealed BDI validity in differentiating between de-pressed and non-dede-pressed individuals. The BDI was also used to discriminate loneli-ness, stress and self-reported anxiety. More-over, it discriminates between psychiatric and non-psychiatric patients, and produces relatively higher scores for patients with major depressive disorders compared with dysthymic disorders (37).
Construct validity of BDI among ethnic Chinese
Factor analysis of the BDI yielded incon-sistent solutions across different studies. Main methodological differences, such as population characteristics, factor-extraction and factor-retention procedure, language version, and statistical approach, are aspects that might explain the variability of findings across many structural analyses of the BDI. For instance, reviews of factor analysis stud-ies have revealed that the number of retained factors ranged from one to seven (7), includ-ing factors that reflect negative attitudes to-wards self, performance impairment and so-matic disturbances, as well as a general fac-tor of depression. However, two dimensions could be systematically extracted across the majority of the studies: the cognitive-affec-tive factors and somatic factors. Recently, more robust confirmatory factor analyses have also supported this bidimensional view of the BDI structure (38,39).
sample suggested that two factors could be extracted, namely the cognitive-affective and somatic dimensions. For the first general factor, high loading was found on items such as guilt feelings, sense of failure, self-dis-like, suicidal thoughts, lack of satisfaction, sense of punishment, and pessimism. For the somatic factor, the following items were im-portant: fatigability, somatic preoccupation, distortion of body image, and work inhibi-tion. Two non-Western factor analyses also yielded similar bidimensional structures for the BDI (13,38). This cultural invariance of factorial structure demonstrates that the same underlying constructs measured by the BDI can be detected convergently with reason-able agreement across different samples and cultures.
Since sex differences may be related to differences in symptom profile, we carried out separate factor analyses by gender, which showed important differences in the expres-sion of depressive symptoms between men and women at the item level, reflecting both component structure and symptom loading differences. Although the bidimensional structure of the present factor analysis was similar to that found for the Brazilian sample (10), many important differences concern-ing item loadconcern-ing indicated how expression of depressive symptoms is culturally medi-ated.
In factor 1, male Chinese subjects showed higher loadings for sense of failure, guilt feelings, sense of punishment, self-dislike, pessimism, and suicidal thoughts. The high-est loadings for factor 2 were on the items sleep disturbance, irritability, somatic pre-occupation, loss of appetite, and fatigability. For Chinese women, the items that loaded the highest in factor 1 were suicidal wishes, lack of satisfaction, pessimism, self-dislike, crying spells, and sleep disturbances. The highest loadings for factor 2 were work inhi-bition, fatigability, distortion of body image, and somatic preoccupation.
The magnitude of the variance for each
factor, as well as the internal consistency of both factors, was slightly higher for men. Generally speaking, depression-specific items loaded high in factor 1, and somato-affective or depression non-specific items in factor 2. One exception was the item sleep disturbance in the female subgroup that loaded high in the first general factor. It could also be seen that two items, sadness and loss of weight, did not contribute to any factor either in the total sample or in the female and male subgroups, differently from the Brazilian data (10). Although the cogni-tive-affective and somatic dimensions were present in both genders, factor 1 reflected more depression-specific items of cognitive distortion in men, whereas in women sui-cidal thoughts associated with depressive mood and low self-esteem prevailed. These differences between Chinese male and fe-male expression of depressive symptoms re-main to be confirmed in future studies on a clinical population with concurrent diagnoses established by clinical interviews and with a balanced distribution between men and women.
The cross-cultural and cross-linguistic utility of the BDI in a growing empirical knowledge base was demonstrated in this study. Our study with a limited sample size and specific cultural characteristics suggests that the BDI is a reliable self-reporting in-strument for detecting depressive symptoms, with validity evidence concerning its use (discriminant and construct validity). Addi-tionally, there was an interesting interplay between cultural factors and measurement bias, yielding a lower BDI score in this sample. In conclusion, this Portuguese ver-sion of the BDI can be regarded as useful to screen depression symptoms in the Chinese community. However, more culturally sen-sitive adaptation and semantical equivalence studies are recommended to further legiti-mate its validity (15).
in mind the limitations of sample recruit-ment from a specific Chinese community, our results should not be prematurely ex-tended to the entire Chinese community or Chinese clinical samples. Future cross-cul-tural studies of mental disorders will be greatly enhanced by the use of comparable screening instruments, with acceptable lev-els of reliability and criterion-validity com-pared to diagnostic evaluation (4,40). The
validation of this Portuguese version of the BDI (9-11) as a psychometrically sound and valid assessment measure will benefit the recipients of psychological services who are not native speakers. It should also facilitate the work of investigators conducting research on non-Western populations, as well as the comparison of research across countries and cultures.
References
1. Furham A & Li YH (1993). The psychological adjustment of the Chinese community in Britain - a study of two generations. British Journal of Psychiatry, 162: 109-113.
2. Takeuchi DT, Chung RCY, Lin KM, Shen H, Kurasaki K, Chun CA & Sue S (1998). Lifetime and twelve-month prevalence rates of major depressive episodes and dysthymia among Chinese Americans in Los Angeles. American Journal of Psychiatry, 155: 1407-1414. 3. Abbott MW, Wong S, Williams M, Au M & Young W (1999). Chinese
migrants’ mental health and adjustment to life in New Zealand. Australian and New Zealand Journal of Psychiatry, 33: 13-21. 4. Yeung A, Neault N, Sonawalla S, Howarth S, Fava M & Nierenberg
AA (2002). Screening for major depression in Asian-Americans: a comparison of the Beck and the Chinese Depression Inventory. Acta Psychiatrica Scandinavica, 105: 252-257.
5. Wang YP, Gorenstein C & Andrade LH (2004). Patterns of psycho-pathological manifestations among ethnic Chinese living in Brazil. European Archives of Psychiatry and Clinical Neuroscience, 254: 36-42.
6. Beck AT, Ward CH, Mendelson M, Mock J & Erbaugh J (1961). An inventory for measuring depression. Archives of General Psychia-try, 4: 53-63.
7. Beck AT, Steer RA & Garbin MG (1988). Psychometric properties of the Beck Depression Inventory. Twenty-five years of evaluation. Clinical Psychology Review, 8: 77-100.
8. Chan DW & Tsoi MM (1984). The BDI and stimulus determinants of cognitive-related depression among Chinese college students. Cog-nitive Therapy and Research, 8: 501-508.
9. Gorenstein C & Andrade L (1996). Validation of a Portuguese ver-sion of the Beck Depresver-sion Inventory and the State-Trait Anxiety Inventory in Brazilian subjects. Brazilian Journal of Medical and Biological Research, 29: 453-457.
10. Gorenstein C, Andrade L, Vieira Filho AHG, Tung TC & Artes R (1999). Psychometric properties of the Portuguese version of the Beck Depression Inventory on Brazilian college students. Journal of Clinical Psychology, 55: 553-562.
11. Andrade L, Gorenstein C, Vieira Filho AH, Tung TC & Artes R (2001). Psychometric properties of the Portuguese version of the state-trait anxiety inventory applied to college students: factor analysis and relation to the Beck Depression Inventory. Brazilian Journal of Medi-cal and BiologiMedi-cal Research, 34: 367-374.
12. Zheng YP, Wei L, Goa L, Zhang G & Wong C (1988). Applicability of the Chinese Beck Depression Inventory. Comprehensive Psychia-try, 29: 484-489.
13. Shek DTL (1990). Reliability of factorial structure of the Chinese version of the Beck Depression Inventory. Journal of Clinical Psy-chology, 46: 35-42.
14. Shek DTL (1991). What does the Chinese version of the Beck Depression Inventory measure in Chinese students - general psy-chopathology or depression? Journal of Clinical Psychology, 47: 381-390.
15. Zheng YP & Lin KM (1991). Comparison of the Chinese Depression Inventory and the Chinese version of the Beck Depression Inven-tory. Acta Psychiatrica Scandinavica, 84: 531-536.
16. Kendall PC, Hollon SD, Beck AT, Hammen CL & Ingram RE (1987). Issues and recommendations regarding use of the Beck Depres-sion Inventory. Cognitive Therapy and Research, 11: 289-299. 17. Salamero M, Marcos T, Gutiérrez F & Rebull E (1994). Factor study
of the BDI in pregnant women. Psychological Medicine, 24: 1031-1035.
18. Beck AT & Steer RA (1984). Internal consistencies of the original and revised Beck Depression Inventory. Journal of Clinical Psychol-ogy, 40: 1365-1367.
19. Stewart SM, Betson CL, Lam TH, Chung SF, Ho HH & Chung TCF (1999). The correlates of depressed mood in adolescents in Hong Kong. Journal of Adolescent Health, 25: 27-34.
20. Powell LH, Shahabi L & Thorensen CE (2003). Religion and spiritual-ity. Linkages to physical health. American Psychologist, 58: 36-52. 21. Koenig HG (2001). Religion and medicine II: religion, mental health,
and related behaviors. International Journal of Psychiatry and Medi-cine, 31: 97-109.
22. Hwu HG, Yeh EK & Chang LY (1989). Prevalence of psychiatric disorders in Taiwan defined by the Chinese diagnostic interview schedule. Acta Psychiatrica Scandinavica, 79: 136-147.
23. Cheng TA (1988). A community study of minor psychiatric morbidity in Taiwan. Psychological Medicine, 18: 953-968.
24. Cooper JE & Sartorius N (1996). Mental Disorder in China - Results of the National Epidemiological Survey in 12 Areas. Gaskell, Glasgow, Scotland.
27. Kleinman A (1982). Neurasthenia and depression: a study of somati-zation and culture. Culture, Medicine and Psychiatry, 6: 117-190. 28. Lee S & Wong KC (1995). Rethinking neurasthenia: the illness
concepts of shenjing shuairuo among Chinese undergraduates in Hong Kong. Culture, Medicine and Psychiatry, 19: 91-111. 29. Hammen CL & Padesky CA (1977). Sex difference in the expression
of depressive responses on the Beck Depression Inventory. Journal of Abnormal Psychology, 86: 609-614.
30. Baron P & Campbell TL (1993). Gender differences in the expres-sion of depressive symptoms in middle adolescents: an extenexpres-sion of earlier findings. Adolescence, 28: 903-911.
31. Byrne DG (1981). Sex differences in the reporting of symptoms of depression in the general population. British Journal of Clinical Psychology, 20: 83-92.
32. Steer RA, Beck AT & Brown G (1989). Sex differences on the revised Beck Depression Inventory for outpatients with affective disorders. Journal of Personality Assessment, 53: 693-702. 33. Salokangas RK, Vaahtera K, Pacriev S, Sohlman B & Lehtinen V
(2002). Gender differences in depressive symptoms. An artefact caused by measurement instruments? Journal of Affective Disor-ders, 68: 215-220.
34. Hojat M, Shapurian R & Mehrya AH (1986). Psychometric properties
of a Persian version of the short form of the Beck Depression Inventory for Iranian college students. Psychological Reports, 59: 331-338.
35. Bonicatto S, Dew AM & Soria JJ (1998). Analysis of the psychomet-ric properties of the Spanish version of the Beck Depression Inven-tory in Argentina. Psychiatry Research, 79: 277-285.
36. Richter P, Werner J, Heerlien A, Kraus A & Sauer H (1998). On the validity of the Beck Depression Inventory: a review. Psychopathol-ogy, 31: 160-168.
37. Steer RA, Beck AT, Riskind JH & Brown G (1986). Differentiation of depressive disorders from generalized anxiety by the Beck Depres-sion Inventory. Journal of Clinical Psychology, 42: 475-478. 38. Kojima M, Furukawa TA, Takahashi H, Kawai M, Nagaya T &
Tokudome S (2002). Cross-cultural validation of the Beck Depres-sion Inventory-II in Japan. Psychiatry Research, 110: 291-299. 39. Steer RA, Ball R, Ranieri WF & Beck AT (1999). Dimensions of the
Beck Depression Inventory-II in clinically depressed outpatients. Journal of Clinical Psychology, 55: 117-128.