TERMS OF TRADE EVOLUTION, CAUSES AND EFFECTS
Negrea Adrian
Department of International Business, Faculty of Economic Sciences, University of Oradea, Oradea, Romania
Abstract: Terms of trade are meant to show the ratio by which a country is different in the level and dynamics of revenues from the exchange made by different categories of products on the external markets. The level of recorded revenues from the commercialization of products and services varies from country to country, and there is rarely a mutually beneficial exchange situation from these operations. Trade efficiency analysis lies in the determination of the terms of trade. In the current paper, international developments are analyzed based on net terms of trade index used by UNCTAD. Statistical data are provided by the World Bank, where export and import price index and the volume of imports and exports by countries were considered. The classification of the countries has been done according to the geographical orientation and based on the purchasing power parity, thus creating two tables, the first table highlighting seven regions, and the second table with seven categories of states including OPEC and non-OPEC members. The terms of trade evolution are influenced by certain important factors in the production process of goods and services. Some of these factors are mentioned: labour productivity; changes in commodity prices; yet, only the last factor is examined in this paper. Based on World Bank commodity price data, the evolution of major energy inputs such as crude oil, gas, coal, and major industrial raw materials such as aluminium, copper, lead, nickel, tin, zinc, silver, gold, platinum and iron was analysed and interpreted. For Romania, the data on terms of trade evolution shows a dramatic situation. If terms of trade development presented a cyclical evolution, the economy as a whole would send an optimistic message. In contrast, the data presented in the following paper will show that our country has registered continuous depreciation of the terms of trade ratio, with a direct impact on external trade balance deficits, a rising external debt and a declining purchasing power for the population. The conclusions address some of the remedies that our country needs in order to improve.
Keywords: terms of trade, efficiency, production, commodities, price, economic development
JEL classification: F10
Introduction
Terms of trade is designed to present the ratio in which a state is compared with another state in terms of trade revenues. According to Iancu (1983), terms of trade has the function of showing "the extent to which a country is compared to another in level and dynamics of trade revenues realized through trading different categories of products on external markets".
International trade involves a wide range of national states that sell a more varied range of products and services to each other. The development degree of those states differs one from another, and the same goes for the products or services that business enterprises from these countries traded.
Terms of trade index
The indicator used to analyze trends in international sales of a country to another country or trading blocks, is the terms of trade index. Iancu (1983) states that "this ratio expresses differences in economic development, technological development, industrial structure, etc. between countries participating in trade operations.”
Stoian, Puiu, Moțiu (1973) state that the terms of trade "expresses the relationship between export and import prices, respectively a commodity purchasing power relative to other commodities, a group of goods exported compared with the same imported group, exports compared to imports as a whole.".
Misztal (2012) continues the definition, stating that "[T]erms of trade is defined as the ratio of the price of exported goods to those imported.”
The evolution of the terms of trade studies the impact on the trade balance, current account and the economic development.
Based on the analyses performed by Iancu (1983), the author determined that "[T]hrough international economic exchanges results a major revenue leakage occurs from some countries to others, especially from underdeveloped countries to developed ones.”
The analysis performed by Bari (2005), Cerchez (2007), Giurgiu (2008) concludes that, based on this indicator, one can determine the value of exported goods needed to be able to import the same amount of goods, according to the formula:
I
indicele preturilor exporturilor
indicele preturilor importurilor
TS
=
´
100
Genereux (2000), based on the formula, states that the ratio of export price index and import price index, when the ITS > 100%, means that the trade flows provides an advantage to the exporting country, imports are cheaper compared to the base period. When ITS < 100%, the country's terms of trade suffers from international trade, requiring an additional quantity of exported goods in order to be able to import the same amount of goods.
The gross terms of trade index (Irsb) is calculated as the ratio between the average export price index and import price index:
Where:
- Gross terms of trade index
- Medium export price index of the base period
- Medium import price index of the base period
- The quantity of exported or imported goods of the current period
- The quantity of exported or imported goods of the base period
Net terms of trade index (Irsn) is calculated as the ratio between the average export price index and import price index:
Where:
- Net terms of trade index
- Medium export price index of the current period
- Medium import price index of the current period
- Export import prices of the current period
- Export import prices of the base period
- The quantity of exported or imported goods of the current period
- The quantity of exported or imported goods of the base period
By some estimations Cerchez (2007), Giurgiu (2008) net terms of trade index gives the result of a country’s efficiency in international trade flows. Giurgiu (2008) states: "It can be considered an indicator of external purchasing power, acquired by a nation through exports. If imported products are on average more expensive than the exported products, the exchange conditions are unfavorable: in order to procure goods from abroad, the concerned country must produce and sell more goods and services"
The literature identifies three transmission channels of terms of trade volatility on economic development, namely: it may cause changes in capital productivity and the level of foreign investment; it may alter the structure of savings and consumption; it may alter the amount of public spending.
Based on the studies carried out by Begu (1999), Cerchez (2007), Giurgiu (2008), statistic indicators such as the price scissors (FP) are also used to determine the regression of the net terms of trade, according to the formula:
100
)
1
(
IRSN
x
FP
=
-Also, the authors analyze the impact of the income index from the terms of trade, or the purchasing power of exports index (Ivrs).
The purchasing power of the exports index is obtained by multiplying the average export price index and the net terms of trade:
index (IFRS) which, according to the formula, is the multiplication of the net terms of trade index (Irsn) and the labor productivity index IW:
W
I
x
IRSN
IFRS
=
The analysis of the result shows that when IFRS> 100% and it is considered a positive evolution of the indicator. According to the formula, the result may be due both to a positive evolution of both terms, or just one of them, but with a significant growth, so the end result should be interpreted as a favorable one.
Giurgiu (2008) states that the factorial analysis of the terms of trade can use other quantities, such as the share of exports in domestic production and the share of exports in domestic consumption. The first is obtained as the ratio between total exports or domestic industries and the total internal production or domestic industries. The second is obtained as the ratio between total exports or domestic industries and total consumption or domestic industries.
Terms of trade evolution at international level
International developments were analyzed in net terms of trade index used by UNCTAD, the statistical data being provided by the World Bank. The export and import price indexes were considered, and also the volume of imports and exports by countries. The classification of the member states was carried out according to geographic orientation and based on purchasing power parity, thus resulting two tables, the first table consisting of seven regions and the second one of seven categories of states. In the last table there are additionally inserted the OPEC member states or the non- OPEC member states.
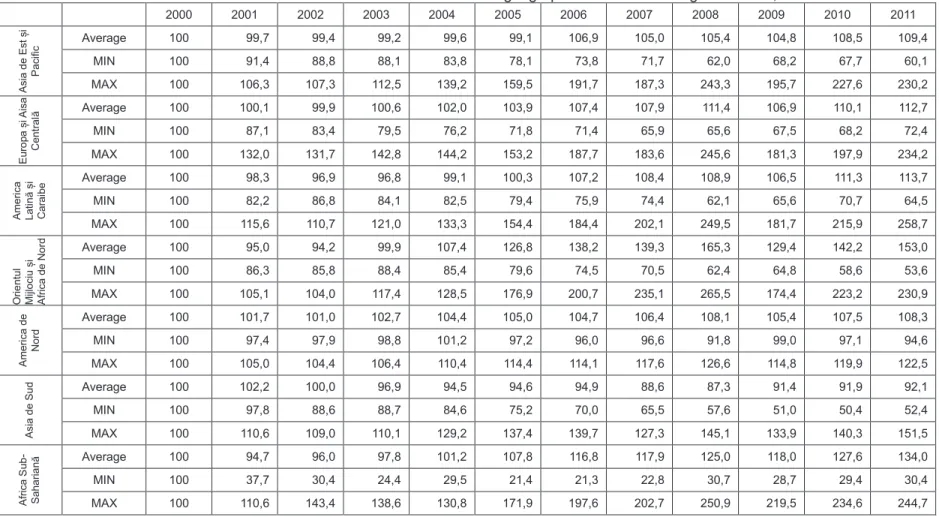
In the following table, it can be observed the evolution of the terms of trade based on the geographic orientation of the member states.
The strong appreciation of the terms of trade was achieved in the Middle East and North Africa, due to the presence of oil exporting states. In this case, a sharp rise in the world price of oil has led to an improvement in the terms of trade in 2011, compared to the base year 2000 by approximately 50%.
Another significant increase in terms of trade is outlined in the Sub-Saharan states, mainly because of the export of raw materials, whose prices have risen on the international market.
The lowest rate of terms of trade increases are recorded in the European and North American states. Due to outsourcing and relocation processes of parts of production to the developing states, they reached a point where they recorded a minimum growth of terms of trade.
Koze, Reizman (2001) demonstrate that improved terms of trade leads to faster economic growth as a result of long-term capital accumulation. Other economists show that an improvement in terms of trade leads to an increase in foreign investment in the country, having a direct impact on the economic development.
In his work, Grimes (2006) show that higher levels of terms of trade and a low volatility can lead to economic growth, particularly in raw materials exporting countries and developing countries. The economy of New Zealand was the main element analyzed, the author observing a stable dynamic in terms of trade. This aspect can be seen in the table analyzed.
Table 1: The evolution of the terms of trade of the member states based on geographic orientation during 2000-2011, %
2000 2001 2002 2003 2004 2005 2006 2007 2008 2009 2010 2011
A sia d e E st și P a cific
Average 100 99,7 99,4 99,2 99,6 99,1 106,9 105,0 105,4 104,8 108,5 109,4
MIN 100 91,4 88,8 88,1 83,8 78,1 73,8 71,7 62,0 68,2 67,7 60,1
MAX 100 106,3 107,3 112,5 139,2 159,5 191,7 187,3 243,3 195,7 227,6 230,2
E u ro p a și A isa C e n tr a
lă Average 100 100,1 99,9 100,6 102,0 103,9 107,4 107,9 111,4 106,9 110,1 112,7
MIN 100 87,1 83,4 79,5 76,2 71,8 71,4 65,9 65,6 67,5 68,2 72,4
MAX 100 132,0 131,7 142,8 144,2 153,2 187,7 183,6 245,6 181,3 197,9 234,2
A m e ri ca L a ti n ă și Car a ib
e Average 100 98,3 96,9 96,8 99,1 100,3 107,2 108,4 108,9 106,5 111,3 113,7
MIN 100 82,2 86,8 84,1 82,5 79,4 75,9 74,4 62,1 65,6 70,7 64,5
MAX 100 115,6 110,7 121,0 133,3 154,4 184,4 202,1 249,5 181,7 215,9 258,7
Or ie n tu l M ijlociu și A fr ica d e Nor d
Average 100 95,0 94,2 99,9 107,4 126,8 138,2 139,3 165,3 129,4 142,2 153,0
MIN 100 86,3 85,8 88,4 85,4 79,6 74,5 70,5 62,4 64,8 58,6 53,6
MAX 100 105,1 104,0 117,4 128,5 176,9 200,7 235,1 265,5 174,4 223,2 230,9
A m e ri ca d e Nor d
Average 100 101,7 101,0 102,7 104,4 105,0 104,7 106,4 108,1 105,4 107,5 108,3
MIN 100 97,4 97,9 98,8 101,2 97,2 96,0 96,6 91,8 99,0 97,1 94,6
MAX 100 105,0 104,4 106,4 110,4 114,4 114,1 117,6 126,6 114,8 119,9 122,5
A sia d e S u
d Average 100 102,2 100,0 96,9 94,5 94,6 94,9 88,6 87,3 91,4 91,9 92,1
MIN 100 97,8 88,6 88,7 84,6 75,2 70,0 65,5 57,6 51,0 50,4 52,4
MAX 100 110,6 109,0 110,1 129,2 137,4 139,7 127,3 145,1 133,9 140,3 151,5
A fr ica S u b -S a h a ria n
ă Average 100 94,7 96,0 97,8 101,2 107,8 116,8 117,9 125,0 118,0 127,6 134,0
MIN 100 37,7 30,4 24,4 29,5 21,4 21,3 22,8 30,7 28,7 29,4 30,4
MAX 100 110,6 143,4 138,6 130,8 171,9 197,6 202,7 250,9 219,5 234,6 244,7
In the following table one can better notice all the influences mentioned above, in particular those referring to increased world prices of oil, the effects of relocation and outsourcing of production processes to developing countries. Misztal (2012) believes that "Changes in terms of trade represent one of the factors that explains the difference in per capita income levels between developed and developing countries."
The most pronounced increases are recorded by OPEC and non-OPEC states. In these countries, terms of trade calculated on the reference year 2000, recorded an increases between 70% and 100%. These increases are recorded strictly due to a raise in the price of oil barrel and natural gas. A good example here is provided by the authors Backus and Crucini (2000) who, in their study, demonstrate how a reduction in oil production leads to an increase in oil prices, with automatic impact in improving terms of trade of oil exporting countries, and vice versa for other countries.
The most pronounced increases in the terms of trade are recorded by states with an average income per capita level, these countries benefiting from the industrialization process. Many companies in the developed world started delocalizing or outsourcing production processes to them. The production based on intensive use of labor, some of it will be externalized or outsourced to countries where skilled labor is cheaper, thereby accumulating benefits from lower production costs.
Table 2: The evolution of the terms of trade of the member states based on purchasing power parity in the period 2000-2011, %
2000 2001 2002 2003 2004 2005 2006 2007 2008 2009 2010 2011
V e n itu ri m a ri: OE CD
Average 100 101,2 101,6 101,2 102,2 102,5 103,9 104,7 103,3 103,8 104,5 104,6
MIN 100 93,3 90,8 87,7 84,8 79,0 73,8 71,7 62,0 68,2 67,7 60,1
MAX 100 132,0 131,7 142,8 144,2 142,8 183,2 189,5 174,6 166,7 204,0 213,3
V e n itu ri m a ri: n o n OE CD
Average 100 97,3 95,9 98,9 101,9 110,2 117,3 118,5 131,4 113,0 120,2 125,4
MIN 100 86,3 84,1 79,5 76,2 71,8 71,4 65,9 62,4 64,8 58,6 53,6
MAX 100 105,1 105,2 117,4 139,2 176,9 200,7 235,1 265,5 195,7 227,6 234,2
V e n itu ri m e d ii sp re m a
ri Average 100 98,5 97,5 98,7 102,8 108,7 118,0 118,6 125,8 115,0 121,7 126,5
MIN 100 82,2 83,4 83,8 81,2 78,0 73,5 68,2 67,6 65,6 70,7 68,6
MAX 100 116,3 114,9 121,0 133,3 171,9 197,6 202,7 250,9 181,7 215,9 258,7
V e n itu ri m ici sp re m e d
ii Average 100 98,3 100,2 100,6 102,8 107,0 115,8 114,6 120,6 116,3 123,7 128,3
MIN 100 88,4 87,0 84,1 82,5 75,2 70,0 65,5 57,6 51,0 50,4 52,4
MAX 100 110,6 143,4 138,6 130,8 156,6 195,2 193,3 224,2 177,8 215,6 229,4
V
e
n
itu
ri m
ici Average 100 94,8 93,4 94,4 95,2 95,7 100,9 101,0 101,3 101,4 108,1 111,5
MIN 100 37,7 30,4 24,4 29,5 21,4 21,3 22,8 30,7 28,7 29,4 30,4
MAX 100 105,3 109,8 121,0 117,8 160,0 174,9 175,9 224,5 219,5 234,6 225,7
OP
E
C
Average 100 93,0 91,6 101,2 117,1 152,6 173,5 178,5 216,9 154,0 181,6 204,4
MIN 100 82,2 85,8 97,1 104,9 106,9 113,0 116,4 123,7 119,8 127,1 134,1
MAX 100 105,1 103,9 113,6 128,5 176,9 200,7 235,1 265,5 181,7 223,2 258,7
NON OP
E
C Average 100 89,8 94,0 98,6 103,4 124,3 139,9 146,2 169,5 140,4 159,9 170,6
MIN 100 37,7 30,4 24,4 29,5 21,4 21,3 22,8 30,7 28,7 29,4 30,4
MAX 100 110,6 143,4 138,6 130,8 176,9 200,7 235,1 265,5 219,5 234,6 258,7
Conclusions
The strong appreciation of the terms of trade was achieved in the Middle East and North Africa, due to the presence of oil exporting states. In this case, a sharp rise in the world price of oil has led to an improvement in the terms of trade in 2011, compared to the base year 2000 by approximately 50%.
Another significant increase in terms of trade is outlined in the Sub-Saharan states, mainly because of the export of raw materials, whose prices have risen on the international market.
The lowest rate of terms of trade increases are recorded in the European and North American states. Due to outsourcing and relocation processes of parts of production to the developing states, they reached a point where they recorded a minimum growth of terms of trade.
It is also deemed to mention the impact of the economic crisis which began in 2008 with direct repercussions on the terms of trade of states, an evolution marked by a steep decline, observed in 2009 in all geographic regions under scrutiny.
The most pronounced increases are recorded by OPEC and non-OPEC states. In these countries, terms of trade calculated on the reference year 2000, recorded an increases between 70% and 100%. These increases are recorded strictly due to a raise in the price of oil barrel and natural gas.
The most pronounced increases in the terms of trade are recorded by states with an average income per capita level, these countries benefiting from the industrialization process. Many companies in the developed world started delocalizing or outsourcing production processes to them. The production based on intensive use of labor, some of it will be externalized or outsourced to countries where skilled labor is cheaper, thereby accumulating benefits from lower production costs.
References
Backus, David K.; Crucini, Mario J. (2000) Oil prices and the terms of trade, Journal of International Economics, Elsevier, vol. 50(1), pages 185-213
Bari, Ioan (2005) Globalizarea economiei, Editura Economică, Bucureşti
Begu, Stelian (1999) Statistică internaţională, Editura AII Beck, Bucureşti
Cerchez, Octavia (2007) Eficiența economică a comerțului exterior, Editura Logos,
București
Giurgiu, Adriana (2008) Comerţul intraeuropean. O nouă perspectivă asupra comerţului
exterior al României, Editura Economică, Bucureşti
Grimes, Arthur (2006) A smooth ride: Terms of trade, volatility and GDP growth, Journal of Asian Economics, Elsevier, vol. 17(4)
Iancu, Aurel (1983) Schimburile economice internaționale, Editura Științifică și Enciclopedică, București
Kose, M. Ayhan; Riezman, Raymond (2001) Trade shocks and macroeconomic fluctuations in Africa, Journal of Development Economics, Elsevier, vol. 65(1)
Misztal, Piotr (2012) Terms of Trade and Economic Growth in Poland in the period 1980-2009, The Romanian Economic Journal
Stoian, Ion; Puiu, Alexandru; Moțiu, Anica (1973) Tehnica operațiunilor de comerț
exterior, Editura Științifică, București