Comparação das medidas da camada de fibras nervosas retinianas realizadas
com os protocolos “fast” e “regular” do Stratus OCT em olhos com atrofia
em banda do nervo óptico e controles normais
Trabalho realizado no Departamento de Oftalmologia da Universidade de São Paulo - USP.
1Associate Professor of Ophthalmology and Chief of the Neuro-ophthalmology and Orbital Diseases Services, Division of Ophthalmology of the University of São Paulo Medical School.
2Post-graduate Student, Neuro-ophthalmology Service, Division of Ophthalmology of the University of São Paulo Medical School.
3Post-graduate Student, Glaucoma Service, Division of Ophthalmology of the University of São Paulo Medical School.
Corresponding author: Mário L. R. Monteiro. Av. Angélica, 1757 - Conj. 61 - São Paulo (SP) CEP 01227-200
E-mail: mlrmonteiro@ terra.com.br Recebido para publicação em 02.10.2007 Última versão recebida em 06.02.2008 Aprovação em 16.03.2008
Supported by a grant from Fundação de Amparo a Pesqui-sa do Estado de São Paulo FAPESP (Nº 07/541420) -São Paulo - Brazil.
Mário Luiz Ribeiro Monteiro1
Leonardo Provetti Cunha2
Roberto Murad Vessani3
in eyes with band atrophy of the optic nerve
and normal controls
Keywords: Tomography, optical coherence/standards; Nerve fiber/ultrastructure; Retina/ ultrastructure; Optic atrophy/diagnosis; Case-control studies
Purpose: To compare retinal nerve fiber layer (RNFL) measurements made with two different protocols of optical coherence tomography in
eyes with band atrophy (BA) of the optic nerve and controls. Methods:
Twenty-nine eyes withBA from chiasmal compressionand 30 normal
eyes underwent RNFL scans using both the fast (256 A-scans) and the regular (512 A-scans) protocols. The two sets of measurements were
compared. Results: In eyes with BA, fast RNFL measurements were
significantly greater compared with regular RNFL measurements in the superior and inferior quadrants and significantly smaller at the 30-degree segments located at the 3 and 6 o’clock meridians. In normal eyes, fast RNFL measurements of the total average, superior and inferior quadrants and the segments corresponding to the 1, 3, 4 and 12 o’clock meridians were significantly greater than regular protocol measurements. Measu-rements with both protocols were significantly different in eyes with BA
compared to normal eyes. Conclusions: Although both fast and regular
RNFL measurements were equally efficient at differentiating eyes with BA from controls the fast protocol yielded greater values in areas with thick RNFL and smaller values in areas with thin RNFL when compared with the regular scanning protocol. One should be aware of such diffe-rences when comparing measurements with both scanning protocols.
ABSTRACT
INTRODUCTION
Optical coherence tomography (OCT) uses near-infrared light to produ-ce images of the retinal structures from which estimates of thickness of the
retinal layers can be made(1). The ability of OCT to provide measurements of
the retinal nerve fibre layer (RNFL) has been evaluated by several studies(2-7).
We recently demonstrated that OCT is able to detect RNFL loss in patients
with optic chiasm lesions(8-10). In these patients, the crossed nerve fibers
The-refore, RNFL loss occurs predominantly on the nasal and tem-poral sides of the optic disc, a pattern identified as band atro-phy (BA) of the optic nerve.
By studying eyes with BA, we documented that OCT is superior to scanning laser polarimetry at identifying RNFL
loss in the temporal and nasal quadrants(11-13). We also found
that the fast Stratus-OCT scan protocol, with 256 scan points, has significantly improved the discrimination ability of OCT when compared to the earlier version of the equipment, with
only 100 scan points(9). Despite such improvements, average
and quadrant measurements are still significantly more accu-rate than 30-degree segment analyses, presumably because of the small number of A scans in the segments.
The built-in signal analysis software of the latest OCT mo-del (Stratus-OCT; Carl Zeiss Meditec) features two scanning protocols for RNFL measurement: (1) Fast RNFL thickness (3.4 mm) scan, with a resolution of 256 scan points, and (2) regular RNFL thickness (3.4 mm) scan, with a resolution of 512 scan points. So far most studies have been performed with the fast RNFL protocol and only a few have compared the two scanning protocols(14-15). The purpose of this study was to
com-pare RNFL thickness as measured with the OCT fast and regular scanning protocols in eyes with BA and in normal controls. Also, the two protocols were compared with regard to their ability to detect patients with BA.
METHODS
This was a prospective, cross-sectional study, performed between March 2006 and February 2007. Approval from the Institutional Ethics Committee was obtained for the study.
A total of 29 eyes from 29 patients with temporal VF defect
from chiasmal compressionand 30 eyes from 30 normal controls
were studied. All patients had already been submitted to pre-vious treatment of the suprasellar lesion and had stable VF de-fects and visual acuity (VA) for at least 1 year prior to study entry. All subjects underwent a complete ophthalmologic exami-nation including VF with standard automated perimetry (SAP) using the 24-2 SITA-Standard strategy (Humphrey Field Analy-zer, Carl-Zeiss Meditec). VF and OCT examinations were per-formed on the same day or within a maximum period of 2 weeks. Inclusion criteria were best corrected VA of 20/30 or better in the study eye, spherical refraction within ± 5 D and cylinder refraction within ± 3 D, intraocular pressure less than 22 mmHg and reliable VF (defined as one with fewer than 25% fixation losses, false-positive responses or false-negative responses). Patients with previous history of intraocular pressure eleva-tion, with clinical signs of glaucomatous optic neuropathy or optic disc anomaly were excluded.
Patients with BA were required to have complete or partial temporal hemianopia and a nasal hemifield within normal limits. A normal nasal hemifield was defined as the absence of any cluster of at least 3 points with p<5% on the pattern deviation plot. Only one eye of each patient was selected for analysis.
The severity of VF defect in patients with BA was evaluated by calculating the temporal mean defect (TMD), by averaging the values of the total deviation plot for the 22 temporal points of the SAP test, excluding the 2 points immediately above and below the blind spot.
The control group consisted of healthy volunteers, from among the hospital staff. All had normal ophthalmic findings and SAP VF, defined as a pattern standard deviation (PSD) within the 95% confidence limit and a glaucoma hemifield test result within normal limits. Control eyes had healthy-looking optic discs.
Subjects underwent ocular imaging with dilated pupils using a commercially available Stratus-OCT, by an experienced examiner. Good-quality scans featured focused images and signal strength equal to or higher than 7 as well as a centered ring around the optic disc for RNFL scans.
The fast RNFL scan protocol consists of 3 consecutive 360° scans with a diameter of 3.4 mm centered on the optic nerve head, each composed of 256 A-scans taken in a single session of 1.92 seconds. The regular RNFL scan protocol differs from the fast protocol in that it is composed of 3 separate 360° circular scans, each containing 512 A-scans and obtained in 1.28 seconds, taking a total time of 3.84 seconds to acquire the entire set of 3 scans.
The RNFL thickness parameters calculated by the Stratus-OCT software (version 4.0.1) were average thickness (360º scan), temporal quadrant thickness (316º- 45º), superior qua-drant thickness (46º-135º), nasal quaqua-drant thickness (136º-225º), inferior quadrant thickness (226º-315º) and thickness for each of the twelve 30-degree segments, indicated as clock-hour positions with the 3 o’clock position as nasal, 6 o’clock position as inferior, 9 o’clock position as temporal, and 12 o’clock position as superior.
RNFL values obtained with both protocols were compared
using the paired t test. Scan thickness values of eyes with BA
and normal controls were compared using Student’s t test.
Receiver operating characteristic (ROC) curves were
calcula-ted. A previously described method(16) was used to compare
areas under the ROC curves (AUCs). A p value of less than
0.05 was considered statistically significant.
RESULTS
A total of 29 eyes with temporal hemianopia and 30 control eyes were studied. Twenty-seven patients had pituitary ade-noma and 2 craniopharyngioma. The mean ± standard devia-tion (SD) age was 43.2 ± 14.0 years (range 13-75) in BA
pa-tients,and 36.2 ± 12.2 years (range 20-69) in normals (p=0.1;
Student’s t test). Median(first quartile, third quartile) SAP
mean deviation and SAP TMD were -13.0 dB (-14.23 dB, -7.56 dB) and -23.95 dB (-28.77 dB, -7.63 dB), respectively.
In eyes with BA, peripapillary RNFL thickness (mean ± SD,
in µm) was 78.53 ± 23.59, 37.37 ± 7.12, 87.83 ± 15.92 and
qua-drants, respectively, when using the fast protocol. The mean global RNFL thickness was 61.47 ± 10.82. The corresponding figures for the regular protocol were75.40 ± 21.89, 38.13 ± 10.00, 82.13 ± 17.25 and 43.17 ± 8.23. The mean global RNFL thickness was 60.07 ± 9.85. Thickness in the superior and inferior qua-drants and in the 6 and 11 o’clock segments were significantly smaller, and in the 3 o’clock segment significantly greater, when using the regular scanning protocol (Table 1, Figure 1).
In normal eyes, RNFL thickness (mean ± SD, in µm) was
131.77 ± 19.02, 74.50 ± 12.73, 134.37 ± 18.90 and 80.40 ± 13.79 in the superior, temporal, inferior and nasal quadrants, respec-tively, measured with the fast protocol. The mean global RNFL was 107.89 ± 17.80. The corresponding figures for the regular protocol were 125.53 ± 19.66, 73.47 ± 11.98, 131.00 ± 20.74 and 77.47 ± 14.07. The mean global RNFL was 101.78 ± 11.90. Total average and superior and inferior quadrant measure-ments were significantly smaller with the regular protocol. RNFL measurements of the 30-degree segments were general-ly smaller with the regular protocol, but differences were signi-ficant only for segments corresponding to the 1, 3, 4 and 12 o’clock meridian (Table 2, Figure 1).
Fast and regular protocol values were significantly smaller
(p<0.001) in eyes with BA than in normal eyes with regard to
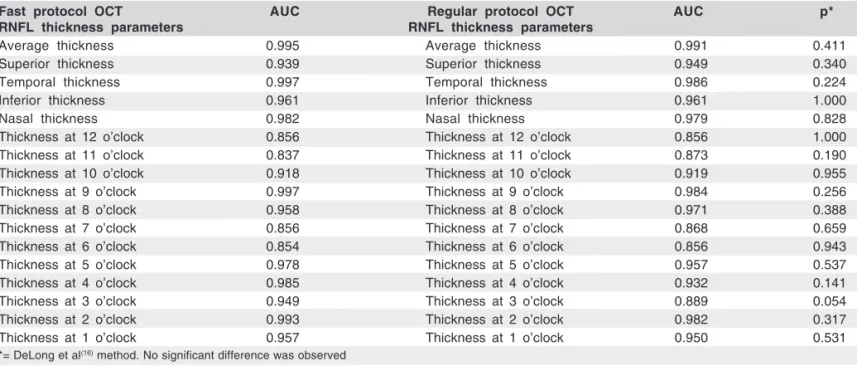
total average, all four quadrants and all twelve 30-degree seg-ments. There was no significant difference between the AUCs produced with the two protocols regardless of the considered parameter (Table 3).
DISCUSSION
The current study showed that the RNFL was reduced not only in the nasal and temporal quadrants but also in the su-perior and inferior segments of the optic disc of eyes with BA.
This is in agreement with Midelberg and Yidegiligne’s(17)
quan-titative histological analysis of a patient with BA, who docu-mented that, although the loss of RNFL in eyes with BA occurs predominantly in the nasal and temporal segments, the superior and inferior quadrants lost approximately 50% of
Figure 1 - Plotting of the mean retinal nerve fiber layer (RNFL) thickness per 30-degree segment along the optic disc circumference (indicated as clock hours) in normal eyes (above) and eyes with band atrophy (BA) of the optic nerve (below) both with the fast (black circle and square, continuous line) and the regular (empty circle and square, dashed line)
RNFL protocols
Table 1. Mean values (± standard deviation) of retinal nerve fibre layer thickness (in µµµµµm) in each segment in 29 eyes with band atrophy of the optic nerve using fast and regular retinal nerve fibre
layer (RNFL) Stratus OCT scanning protocols
Fast RNFL Regular RNFL p*
protocol (n=29) protocol (n=29)
Total average 61.85 ± 10.82 60.51 ± 9.72 0.116
RNFL quadrants
Superior 79.17 ± 23.79 75.97 ± 22.05 0.024
Temporal 37.31 ± 7.24 38.27 ± 10.15 0.447
Inferior 88.59 ± 15.65 82.79 ± 17.17 0.001
Nasal 42.21 ± 11.28 43.52 ± 8.15 0.440
Clock hours
12 88.93 ± 34.21 85.45 ± 30.73 0.287
11 93.97 ± 34.42 85.72 ± 33.45 0.003
10 45.48 ± 19.72 45.21 ± 21.51 0.852
9 (temporal) 29.66 ± 6.94 30.86 ± 8.51 0.352
8 39.90 ± 12.35 37.24 ± 10.64 0.065
7 99.76 ± 33.63 94.76 ± 32.64 0.094
6 106.48 ± 25.59 101.96 ± 23.70 0.048
5 59.55 ± 19.11 55.86 ± 15.71 0.139
4 41.10 ± 9.60 42.21 ± 8.08 0.451
3 (nasal) 36.86 ± 10.26 40.59 ± 8.10 0.026
2 45.93 ± 15.98 48.79 ± 13.33 0.172
1 55.24 ± 25.96 57.34 ± 23.50 0.308
*= paired t test. Significant values are in italic
Table 2. Mean values (± standard deviation) of retinal nerve fibre layer thickness (in µµµµµm) in each segment in 30 normal eyes using fast and regular retinal nerve fibre layer (RNFL) Stratus OCT scanning
protocols
Fast RNFL Regular RNFL p*
protocol (n=30) protocol (n=30)
Total average 107.89 ± 17.80 101.78 ± 11.90 0.020
RNFL quadrants
Superior 131.77 ± 19.02 125.53 ± 19.66 0.005
Temporal 74.50 ± 12.73 73.47 ± 11.98 0.416
Inferior 134.37 ± 18.90 131.00 ± 20.71 0.044
Nasal 80.40 ± 13.79 77.47 ± 14.07 0.125
Clock hours
12 134.97 ± 20.02 125.80 ± 24.60 0.005
11 137.00 ± 24.36 134.57 ± 23.50 0.214
10 84.93 ± 18.45 85.56 ± 16.56 0.730
9 (temporal) 57.47 ± 8.16 57.66 ± 8.45 0.803
8 77.07 ± 16.80 76.17 ± 16.09 0.660
7 145.17 ± 30.57 142.83 ± 26.59 0.414
6 142.83 ± 26.24 139.17 ± 28.16 0.198
5 115.10 ± 17.47 110.70 ± 22.91 0.227
4 82.27 ± 16.62 74.47 ± 17.76 0.015
3 (nasal) 64.57 ± 14.05 60.93 ± 14.10 0.039
2 101.30 ± 16.68 97.50 ± 18.63 0.198
1 123.20 ± 24.76 116.77 ± 24.56 0.038
their fibers, since ganglion cell axons originating from the nasal retina also penetrate the superior and inferior portions of the disc(17).
Few studies have compared Stratus-OCT scans performed
with the fast and the regular protocol. Investigators(14)
stu-died 61 glaucoma eyes (31 with and 30 without VF defects), using both scanning protocols. They found that in eyes with VF defects there was no significant difference in average RNFL thickness while in eyes without VF defects (therefore with greater RNFL thickness) the average RNFL thickness was significantly greater when using the fast scanning protocol. Values from quadrants and 30-degree segments were not
re-ported. Other authors(15), on the other hand, studied 182
sub-jects including normal eyes, glaucoma and glaucoma suspect eyes and found that the average RNFL thickness measure-ments in all population groups were significantly greater when using the fast protocol. The authors also observed that when comparing healthy subjects and glaucoma patients, the regu-lar RNFL scan produced the regu-largest area under the ROC curve (0.912) based on average RNFL thickness measurements.
The current study confirms that the fast RNFL scanning protocol tends to produce greater values in most measure-ments when compared to the regular scanning protocol. Our study, however, emphasizes that the tendency to overestima-te RNFL thickness with the fast protocol is more pronounced in areas with thicker RNFL. For example, in normal eyes RNFL values were greater in all measurements except those of the 30-degree segments located in the temporal area, a finding
al-ready reported by other authors(15). Although those authors
stressed the significantly greater values obtained with the fast protocol in most parameters, no statistically significant difference was observed in the comparisons corresponding
to the 30-degree segments located in the thinner temporal area
(8, 9 and 10 o’clock segments) in glaucoma and normal eyes(16).
The difference in measuring ability observed between thick and thin RNFL areas with the two protocols became much more striking when we evaluated eyes with BA. In this condition RNFL thickness is reduced especially in the already thin areas located in the nasal and temporal quadrants of the optic disc. While our study is very similar to that of a previous
study(15) with regard to normal eyes, in eyes with BA we
ob-served that the fast scanning protocol yielded significantly greater values in the (thicker) superior and inferior quadrants but smaller (although not statistically significant) values in the (thinner) nasal and temporal quadrants (Table 1). A similar tendency was observed in the 30-degree segment analysis. Measurements with the fast protocol were generally greater in thicker segments located superiorly and inferiorly and smaller in segments located nasally and temporally (Figure 1). Al-though not all comparisons yielded significant differences, the greater values of the fast protocol attained statistical signi-ficance difference in the segments corresponding to the 11 and 6 o’clock meridians. On the other hand, thickness values from the 3 o’clock meridian were significantly smaller with the fast than with the regular scanning protocol (Table 1). Thus, our study shows that the tendency to produce greater mea-surements in normal eyes and to some extent in eyes with reduced RNFL is not uniform but appears to be dependent on RNFL thickness: compared to the regular scanning protocol, the fast protocol tends to produce greater values in areas with thick RNFL and similar or even smaller values in areas with thin RNFL (Tables 1 and 2, Figure 1).
Since the difference in measurements between the two scanning protocols varied according to disc sector, it is pro-Table 3. Comparison of the area under de receiver operating characteristic curves (AUC) of retinal nerve fibre layer (RNFL) parameters of fast
and regular optical coherence tomography (OCT) scanning protocols
Fast protocol OCT AUC Regular protocol OCT AUC p*
RNFL thickness parameters RNFL thickness parameters
Average thickness 0.995 Average thickness 0.991 0.411
Superior thickness 0.939 Superior thickness 0.949 0.340
Temporal thickness 0.997 Temporal thickness 0.986 0.224
Inferior thickness 0.961 Inferior thickness 0.961 1.000
Nasal thickness 0.982 Nasal thickness 0.979 0.828
Thickness at 12 o’clock 0.856 Thickness at 12 o’clock 0.856 1.000
Thickness at 11 o’clock 0.837 Thickness at 11 o’clock 0.873 0.190
Thickness at 10 o’clock 0.918 Thickness at 10 o’clock 0.919 0.955
Thickness at 9 o’clock 0.997 Thickness at 9 o’clock 0.984 0.256
Thickness at 8 o’clock 0.958 Thickness at 8 o’clock 0.971 0.388
Thickness at 7 o’clock 0.856 Thickness at 7 o’clock 0.868 0.659
Thickness at 6 o’clock 0.854 Thickness at 6 o’clock 0.856 0.943
Thickness at 5 o’clock 0.978 Thickness at 5 o’clock 0.957 0.537
Thickness at 4 o’clock 0.985 Thickness at 4 o’clock 0.932 0.141
Thickness at 3 o’clock 0.949 Thickness at 3 o’clock 0.889 0.054
Thickness at 2 o’clock 0.993 Thickness at 2 o’clock 0.982 0.317
Thickness at 1 o’clock 0.957 Thickness at 1 o’clock 0.950 0.531
bably not due to intrinsic systematic error in the equipment.
Some investigators(15) pointed out that as the estimation of
RNFL thickness is based on the reflectivity signal generated by the scanner, the difference observed may be related to the reduced signal density of the lower-resolution image genera-ted by the fast scan. A reduced signal density may lower the threshold set for the posterior boundary of RNFL and thus result in increased thickness in RNFL measurements. To explain the lack of difference in measurements observed in
temporal segments in their study, some authors(15) suggested
that the effect of reduced signal density was probably minimal in areas with thin RNFL. Our findings take this conclusion one step further indicating that the fast protocol tends to overes-timate thickness in areas with thick RNFL and underesoveres-timate values in areas with thin RNFL; however, further studies are necessary to clarify these relationships.
More than comparing the values from the two scanning protocols the purpose of our study was to investigate whe-ther increasing the number of scans would result in greater discrimination ability between eyes with BA and controls. Thus, based on the absence of significant differences bet-ween the AUCs of the two scanning protocols, our findings indicate that the protocols are equally efficient at differen-tiating eyes with BA from normal controls (Table 3). This
finding differs from the conclusion of other authors(15) who
found the regular protocol to have a greater discrimination ability in patients with glaucoma and glaucoma suspects. We believe that the differences in the profile of the study po-pulation may explain the difference in conclusion between the two studies. Since the fast protocol tends to produce greater values in areas with thick RNFL and smaller values in areas with thin RNFL, which are particularly affected in eyes with BA, it is possible that the AUCs observed with the fast scanning protocol were artifactually increased in our study, resulting in a better performance of the fast protocol than that
observed by a previous study(15). The disagreement may also
be due to differences in the amount of RNFL loss in the studied diseases. RNFL loss often varies more among glau-comatous eyes than among the eyes with severe BA of the optic nerve, as evaluated in our study. In fact, the standard deviation of our average RNFL measurements in eyes with BA
was lower (approximately 10 µm) than that of the
glauco-matous eyes studied by others(15) (approximately 20 µm).
Thus, the greater number of points (512) in the regular scan protocol could make it a better tool than the fast scan protocol to distinguish normal eyes from glaucomatous eyes with early damage characterized by slight RNFL reduction but not ne-cessarily to distinguish normal eyes from eyes with severe BA of the optic nerve such as those from our study. Further studies with glaucoma patients and with other patterns of RNFL loss are therefore necessary to define which scanning protocol provides the greatest discrimination ability when compared to normal eyes.
In conclusion, our study shows that RNFL measurements obtained with the fast scanning protocol tend to be greater in
areas with thick RNFL and smaller in areas with thin RNFL as compared to measurements obtained with the regular scan-ning protocol. Although the two OCT protocols were equally efficient at differentiating eyes with BA from normal eyes, the values of RNFL thickness obtained by the two instruments were generally different. Investigators and clinicians should be aware of this fact when comparing RNFL measurements obtained with the fast and regular scanning protocols of the same equipment.
RESUMO
Objetivo: Comparar as medidas da camada de fibras nervosas da retina (CFNR) realizada com dois protocolos de exame da tomografia de coerência óptica (TCO) em olhos com atrofia em
banda (AB) do nervo óptico e controles. Métodos: Vinte nove
olhos com AB e 30 olhos normais foram submetidos a TCO utilizando tanto o protocolo “fast” (256 scans A) como o
“re-gular” (512 scans A). As medidas foram comparadas.
Resulta-dos: Em olhos com AB, as medidas da CFNR com o protocolo
“fast” foram significativamente maiores do que aquelas do pro-tocolo “regular” nos quadrantes superior e inferior e significati-vamente menores nos segmentos de 30 graus localizados nos meridianos correspondentes às 3 e 6 horas. Nos olhos normais, as medidas com o protocolo “fast” correspondentes à média global, aos quadrantes superior e inferior e aos segmentos de 30 graus correspondentes aos meridianos situados à 1, 3, 4 e 12 horas foram significativamente maiores do que aquelas do pro-tocolo “regular”. As medidas com os dois propro-tocolos foram significativamente diferentes em olhos com AB quando
compa-rados aos olhos normais. Conclusões: Embora as medidas
obti-das tanto com o protocolo “fast” como com o “regular” tenha sido igualmente eficientes na diferenciação de olhos com AB dos normais, o protocolo “fast” forneceu valores maiores em áreas com CFNR mais espessas, e menores em áreas com CFNR mais finas quando comparados com o protocolo “regular”. De-ve-se estar atento a estas diferenças quando se comparam as medidas obtidas com os dois protocolos de exame.
Descritores: Tomografia de coerência óptica/padronização; Fibras nervosas/ultraestrutura; Retina/ultraestrutura; Atrofia óptica /diagnóstico; Estudos de casos e controles
REFERENCES
1. Huang D, Swanson EA, Lin CP, Schuman JS, Stinson WG, Chang W, et al. Optical coherence tomography. Science. 1991;254(5035):1178-81.
2. Schuman JS, Pedut-Kloizman T, Hertzmark E, Hee MR, Wilkins JR, Coker JG, et al. Reproducibility of nerve fiber layer thickness measurements using optical coherence tomography. Ophthalmology. 1996;103(11):1889-98. 3. Baumann M, Gentile RC, Liebmann JM, Ritch R. Reproducibility of retinal
thickness measurements in normal eyes using optical coherence tomography. Ophthalmic Surg Lasers. 1998;29(4):280-5.
5. Jones AL, Sheen NJ, North RV, Morgan JE. The Humphrey optical coherence tomography scanner: quantitative analysis and reproducibility study of the nor-mal human retinal nerve fibre layer. Br J Ophthalmol. 2001;85(6):673-7. 6. Villain MA, Greenfield DS. Peripapillary nerve fiber layer thickness
measure-ment reproducibility using optical coherence tomography. Ophthalmic Surg Lasers Imaging. 2003;34(1):33-7.
7. Medeiros FA, Zangwill LM, Bowd C, Weinreb RN. Comparison of the GDx VCC scanning laser polarimeter, HRT II confocal scanning laser ophthalmos-cope, and stratus OCT optical coherence tomograph for the detection of glaucoma. Arch Ophthalmol. 2004;122(6):827-37.
8. Monteiro ML, Leal BC, Rosa AA, Bronstein MD. Optical coherence tomo-graphy analysis of axonal loss in band atrophy of the optic nerve. Br J Ophthalmol. 2004;88(7):896-9.
9. Monteiro ML, Leal BC, Moura FC, Vessani RM, Medeiros FA. Comparison of retinal nerve fibre layer measurements using optical coherence tomography ver-sions 1 and 3 in eyes with band atrophy of the optic nerve and normal controls. Eye. 2007;21(1):16-22.
10. Moura FC, Medeiros FA, Monteiro ML. Evaluation of macular thickness mea-surements for detection of band atrophy of the optic nerve using optical coherence tomography. Ophthalmology. 2007;114(1):175-81.
11. Monteiro ML, Medeiros FA, Ostroscki MR. Quantitative analysis of axonal
loss in band atrophy of the optic nerve using scanning laser polarimetry. Br J Ophthalmol. 2003;87(1):32-7.
12. Leal BC, Moura FC, Monteiro ML. Comparação entre o polarímetro de varre-dura a laser, a tomografia de coerência óptica 1 e o Stratus-oct na detecção da perda axonal da atrofia em banda do nervo óptico. Arq Bras Oftalmol. 2006; 69(4):531-7.
13. Monteiro ML, Moura FC. Comparison of the GDx VCC scanning laser polari-meter and the stratus optical coherence tomograph in the detection of band atrophy of the optic nerve. Eye. 2008;22(5):641-8.
14. Zafar S, Gurses-Ozden R, Makornwattana M, Vessani R, Liebmann JM, Tello C, Ritch R. Scanning protocol choice affects optical coherence tomography (OCT-3) measurements. J Glaucoma. 2004;13(2):142-4.
15. Leung CK, Yung WH, Ng AC, Woo J, Tsang MK, Tse KK. Evaluation of scanning resolution on retinal nerve fiber layer measurement using optical coherence tomography in normal and glaucomatous eyes. J Glaucoma. 2004; 13(6):479-85.
16. DeLong ER, DeLong DM, Clarke-Pearson DL. Comparing the areas under two or more correlated receiver operating characteristic curves: a nonparametric ap-proach. Biometrics. 1988;44(3):837-45.