1
Universidade Federal do Rio de Janeiro, Curso de Nutrição, Campus Macaé, R. Professor Aloisio Teixeira Gomes da Silva, 50, Granja dos Cavaleiros, 27930-560, Macaé, RJ, Brasil. Correspondência para/Correspondence to: N SPERANDIO. E-mail: <[email protected]>.
2
Universidade Federal de Viçosa, Centro de Ciências Exatas e Tecnológicas, Departamento de Economia. Viçosa, MG, Brasil.
3
Universidade Federal de Viçosa, Centro de Ciências Biológicas e da Saúde, Departamento de Nutrição. Viçosa, MG, Brasil.
Impact of the
Bolsa Família
Program on
energy, macronutrient, and micronutrient
intakes: Study of the Northeast and Southeast
Impacto do Programa Bolsa Família no consumo
de energia, macro e micronutrientes
:
estudo
das regiões Nordeste e Sudeste
Naiara SPERANDIO1
Cristiana Tristão RODRIGUES2
Sylvia do Carmo Castro FRANCESCHINI3
Silvia Eloiza PRIORE3
A B S T R A C T
Objective
To assess the impact of the Bolsa Família Program on the energy and nutrient intakes of beneficiaries from the Brazilian Northeast and Southeast regions.
Methods
The study used data from the 2008-2009 Pesquisa de Orçamento Famíliar, which assessed individual food intake on two nonconsecutive days of individuals aged more than 10 years. Based the personal information booklet, food intake values were transformed into nutritional values (energy and nutrients). Analysis of the impact measure was preceded by propensity score matching, a technique that matches some socioeconomic characteristics of beneficiaries and nonbeneficiaries. Once the score was calculated, the impact of the Bolsa Família Program was estimated by nearest neighbor matching.
Results
Conclusion
The results show a positive impact of the program on the energy and macronutrient intakes, and a negative impact on the intakes of most study micronutrients, especially in adolescents, which reinforce the importance of implementing intersectoral actions to improve the nutritional quality of the Bolsa Família Program beneficiaries’
diet.
Keywords: Diet. Health evaluation. Methodology. Nutrients. Public policy.
R E S U M O
Objetivo
Avaliar o impacto do Programa Bolsa Família no consumo de energia e nutrientes de beneficiários das regiões Nordeste e Sudeste do Brasil.
Métodos
Utilizou-se dados da Pesquisa de Orçamento Famíliar realizada em 2008-2009, que avaliou o consumo alimentar individual de dois dias não consecutivos de indivíduos acima de 10 anos. Com base nas informações da caderneta pessoal, transformou-se os valores de consumo de alimentos em valores nutricionais (energia e nutrientes). A análise da medida de impacto foi precedida de técnica propensity score que assemelhou os indivíduos beneficiários e os não beneficiários em relação ao conjunto de características socioeconômicas. Após o cálculo do escore, estimou-se o impacto do Programa Bolsa Família por meio do algoritmo de pareamento do vizinho mais próximo.
Resultados
O impacto do programa traduziu-se no maior consumo de energia e macronutrientes e no menor consumo de cálcio e vitaminas A, D, E e C entre adolescentes beneficiários em ambas as regiões. Em relação aos adultos, observou-se maior consumo de fibra, ferro e selênio na região Sudeste e menor consumo de energia, lipídeos, açúcar de adição, sódio, zinco, vitamina E e piridoxina no Nordeste.
Conclusão
Os resultados retratam impacto positivo do programa sobre o consumo de energia e macronutrientes e impacto negativo sobre o consumo da maioria dos micronutrientes analisados, especialmente em relação aos adolescentes, o que reforça a importância da adoção de ações intersetoriais para melhoria da qualidade nutricional da alimentação dos participantes do programa.
Palavras-chave: Dieta.Avaliação em Saúde Metodologia. Nutrientes. Política Social.
I N T R O D U C T I O N
The Bolsa Família Program (PBF) appears as the central point in the intersectoral agenda of the Brazilian government to promote Food and Nutrition Security (FNS) and the social inclusion of low-income families who remained invisible for
many years1,2.
Studies have confirmed the impact of the PBF on the reduction of poverty, social inequality,
and hunger2-4. Between 2002 and 2013, Brazil
reduced by 82% the undernourished population, exiting the world hunger map. Among the reportedly successful actions to achieve these results, the PBF and programs that strengthened
family farming stood out5.
Brazil is advancing in the construction of an agenda to fight hunger and poverty, but in some regions of the country, reality is still unsatisfactory. The North and Northeast regions concentrate 36.1% and 38.1%, respectively, of the food-insecure households, while in the Southeast (14.5%) and South (14.9%) regions, the proportions are below one-fourth of the
households6.
there. Additionally, the PBF benefit represents one
of the main components of family income per
capita6,7.
Studies that assess the impact of the PBF on the food and nutrition of its beneficiaries are still scarce and have some methodological problems, especially with respect to the sampling technique, design, and lack of confounder control. These problems prevent more conclusive analyses
about the effectiveness of the program7-9.
Despite the controversies about how the beneficiary families use the financial resource, studies have reported that families prioritize
food acquisition10-13. However, aspects regarding
the nutritional quality of these foods remain inconclusive, especially with respect to the density of micronutrients, such as vitamins and minerals.
Given the above, the objective of this study was to assess the impact of the PBF on the intakes of energy, macronutrients, and micronutrients of
the program’s beneficiaries from the Brazilian
Northeast and Southeast regions.
M E T H O D S
Data were obtained from the 2008/2009 Pesquisa de Orçamentos Famíliares (POF, Family
Budget Survey), conducted by the Instituto
Bra-sileiro de Geografia e Estatística (IBGE, Brazilian Institute of Geography and Statistics). The sample size of the survey was 4,696 census tracts, which corresponded to 55,970 households and 189,288 individuals14.
Pesquisa de Orçamentos Famíliares used two-stage cluster sampling. The first stage consisted of the geographic and economic stratification of the census tracts (primary
sampling unit) of IBGE “Amostra Mestra de
Inquéritos Domiciliares” (Master Sample of Household Surveys). The Master Sample tracts were selected by probabilistic sampling proportional to the number of households in the tract14.
The secondary sampling units were the permanent private households, selected by simple
random sampling without replacement inside each tract. The tracts were distributed along twelve months, guaranteeing representability
during the four quarters of the year14.
Because of the importance of investigating food intake at the national level, for the first time POF assessed the food intake of individuals aged more than 10 years. This module was called “Inquérito Nacional de Alimentação” (INA, National Food Survey). Food intake was assessed in a subsample, which corresponded to 24.3% of all sampled households (13,569 households;
34,003 individuals)14.
The survey recorded the detailed food intake on two nonconsecutive days of individuals aged more than 10 years. The details included amount, time, type of preparation, and intake
location (home or away-from-home)14.
The Instituto Brasileiro de Geografia e Es-tatística researchers together with the interviewees reviewed all food records to identify possible errors. After reviewing the records, the data were digitized into a specific program on a portable computer. The program contained a database of approximately 1,500 food items, 15 different preparation methods, and 106 cooking units. By the end of the survey, approximately 1,120 food
items had been mentioned14.
Given POF complexity, certain situations occurred, such as incomplete data and suspicious intake values. Thus, to control information quality, a data consistency (critical and imputed) verification procedure was performed, which resulted in the exclusion of 29 individuals whose
records were considered incomplete14.
The 2008-2009 POF disclosed a Food Conversion Table for the block of foods consumed individually. To construct this table, IBGE used data from the Brazilian Food Composition Table, United States Department of Agriculture food composition database, and nutrition facts labels14.
converted into nutrient intake values (energy, macronutrients, and micronutrients). The nutrient intake distribution was adjusted by removing the
effect of intraindividual variability15.
Since individuals were not randomly allocated into a group of beneficiaries (intervention group) and a group of nonbeneficiaries (control group), the PBF impact was estimated by comparing these two groups only after matching some of their socioeconomic characteristics, considered potential confounders, using the
propensity score matching technique9,15. This
technique aims to reduce biases when estimating the effects of treatment that use observational designs and nonrandom group assignment. It is defined as the conditional probability of belonging to the comparison group due to predetermined
characteristics not influenced by the intervention9,16.
The propensity score was estimated by a probit regression model. In this regression analysis, the dependent variable was a dummy that assumed a value equal to one if the individuals were beneficiaries, and zero if they were nonbeneficiaries. The explanatory variables were:
mean income per capita; number of household
dwellers; number of sons and daughters; number of children and adolescents; number of bathrooms; connection to the electrical grid; sewerage; trash collection; type of wall finish; household location (urban); gender and skin color of household dwellers; and education level of the head of household.
After calculating the score, the cases with similar values and characteristics were identified. The cases that received or not the benefit were grouped into blocks. The block pairs were compared with respect to propensity score similarity by a process called balancing (balancing hypothesis). Once the final number of blocks was determined, the Average Treatment Effect on the Treated (ATT) was calculated by the nearest neighbor matching algorithm with replacement. This process paired each intervention group unit with the group control unit with the closest
propensity score9,16.
Average Treatment Effect on the Treated was determined to assess the impact of the PBF on the intakes of energy, protein, total lipids, total carbohydrates, added sugar, fiber, calcium, iron, sodium, zinc, selenium, vitamin B1, vitamin B6, vitamin C, vitamin A, vitamin D, and vitamin E. Nutrient and energy intakes were analyzed by age group: adolescents (10 to 19 years) and adults (20 years or more). Adults and older adults were analyzed together since the proportion of individuals aged more than 60 years did not reach 5% of the sample.
To characterize the individuals and households, and the PBF beneficiaries and nonbeneficiaries from both macroregions, the mean values and percentages of demographic and socioeconomic variables were estimated.
Fisher’s exact test compared the differences
between the proportions, and the Student’s t-test
compared the differences between the means. The significance level was set at 5%.
All analyses were performed by the software Stata (Stata Corporation, College Station, Texas, United States) version 12.0, considering the complex sample design. The Stata resource ‘pscore.ado’ calculated the propensity score, identified the individuals with similar propensity scores, balanced the block pairs, and calculated the ATT.
This study was approved by the Human
Research Ethics Committee of the Universidade
Federal de Viçosa (Federal University of Viçosa, CAE nº 21927913.9.0000.5153).
R E S U L T S
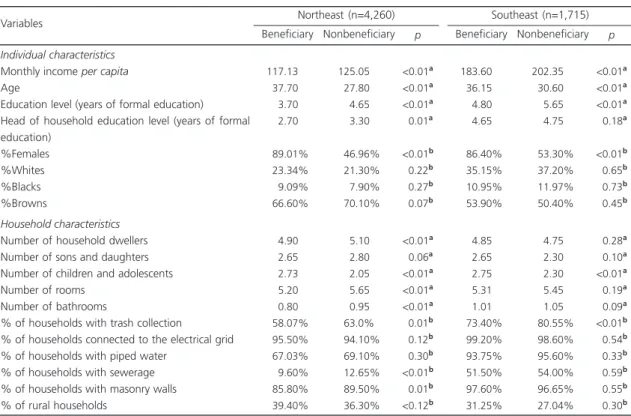
The final sample in the Northeast region totaled 4,260 individuals (17.30% PBF beneficiaries), and in the Southeast region, the final sample totaled 1,715 individuals (7.55% PBF beneficiaries).
The beneficiaries from both regions had
lower education level. The total number of children and adolescents (who constitute the target population of the program) was higher in beneficiary families (Table 1).
The housing and basic sanitation conditions were worse among the beneficiaries from the Northeast region. The disparities between trash collection services in both regions and the absence of sewerage and masonry walls in the Northeast stood out (Table 1).
Comparison of the mean energy, macronutrient, and micronutrient intakes showed that in the Northeast region, adolescent beneficiaries had lower intakes of protein, calcium, iron, zinc, and vitamins A, D, E, and C. With respect to energy and the other study
nutrients, the mean daily intake per capita was
higher in adolescent beneficiaries. The adult beneficiaries from this region had lower mean daily intakes of energy, protein, total lipids, added sugar, sodium, zinc, and vitamin E (Table 2).
In the Southeast region, the mean daily
intakes per capita of adolescent beneficiaries were
lower for protein, calcium, sodium, and vitamins A, E, and C. The adolescent beneficiaries had higher intakes of the other nutrients, except for iron, selenium, and vitamin D, whose amounts did not differ from those of nonbeneficiaries. The adult beneficiaries in this region had lower mean daily intake of vitamin A and higher intakes of added sugar, fiber, iron, and selenium than adult nonbeneficiaries (Table 2).
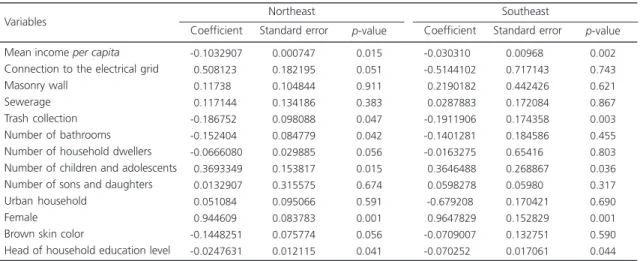
To determine whether these intake differences would remain after controlling for a set of confounders and estimate the impact of the PBF (ATT) on energy and nutrient intakes, probit models were calculated to estimate the propensity score. The results of the estimated coefficients presented the expected signs for most variables (Tables 3).
In the Northeast region, the probability of an individual being a beneficiary of the PBF
Table 1. Socioeconomic characteristics of the sample of Programa Bolsa Família beneficiaries and nonbeneficiaries. Southeast and Northeast. Pesquisa de Orçamento Famíliar 2008-2009. Brazil.
Individual characteristics
Monthly income per capita
Age
Education level (years of formal education) Head of household education level (years of formal education) %Females %Whites %Blacks %Browns Household characteristics
Number of household dwellers Number of sons and daughters Number of children and adolescents Number of rooms
Number of bathrooms
% of households with trash collection
% of households connected to the electrical grid % of households with piped water
% of households with sewerage % of households with masonry walls % of rural households
Variables
117.13% 037.70% 003.70% 002.70%
089.01%
023.34%
009.09%
066.60%
004.90% 002.65% 002.73% 005.20% 000.80% 058.07% 095.50% 067.03% 009.60% 085.80% 039.40% 125.05% 027.80% 004.65% 003.30%
046.96%
021.30%
007.90%
070.10%
005.10% 002.80% 002.05% 005.65% 000.95% 063.0%0 094.10% 069.10% 012.65% 089.50% 036.30% <0.01a <0.01a <0.01a 0.01a <0.01b 0.22b 0.27b 0.07b <0.01a 0.06a <0.01a <0.01a <0.01a 0.01b 0.12b 0.30b <0.01b 0.01b <0.12b
Beneficiary Nonbeneficiary p
Northeast (n=4,260)
183.60% 036.15% 004.80% 004.65%
086.40%
035.15%
010.95%
053.90%
004.85% 002.65% 002.75% 005.31% 001.01% 073.40% 099.20% 093.75% 051.50% 097.60% 031.25% 202.35% 030.60% 005.65% 004.75%
053.30%
037.20%
011.97%
050.40%
004.75% 002.30% 002.30% 005.45% 001.05% 080.55% 098.60% 095.60% 054.00% 096.65% 027.04% <0.01a <0.01a <0.01a
<0.18a
<0.01b
<0.65b
<0.73b
<0.45b
<0.28a
<0.10a <0.01a
<0.19a
<0.09a <0.01b
<0.54b
<0.33b
<0.59b
<0.55b
<0.30b
Beneficiary Nonbeneficiary p
Southeast (n=1,715)
Note: Significance level set at 5%; aStudent
’s t-test; bFisher
decreased as the following increased: monthly
income per capita, trash collection, number of
bathrooms, and head of household education level. Additionally, being female and higher number of children and adolescents in the household increased the probability of being a beneficiary of the program (Table 3).
In the Southeast region, higher monthly
income per capita and head of household
education level, and trash collection reduced the probability of being a beneficiary. On the other hand, similar to the Northeast region, being female and higher number of children and adolescents in the household increased the probability of being a beneficiary (Table 3).
After estimating the probability of being a PBF beneficiary, the individuals (intervention versus control) were paired according to this
Table 2. Mean intakes per capita of energy and nutrients of adolescent and adult beneficiaries and nonbeneficiaries of the Programa Bolsa Família. Southeast and Northeast. Pesquisa de Orçamento Famíliar 2008-2009. Brazil.
Energy (kcal) Protein (g) Total lipids (g) Carbohydrates (g) Sugara (g)
Fiber (g) Calcium (mg) Iron (mg) Sodium (mg) Zinc (mg) Selenium (mcg) Vitamin A (mcg) Vitamin D (mcg) Vitamin E (mg) Vitamin B1 (mg) Pyridoxine (mg) Vitamin C (mg)
Energy (kcal) Protein (g) Total lipids (g) Carbohydrates (g) Sugara (g)
Fiber (g) Calcium (mg) Iron (mg) Sodium (mg) Zinc (mg) Selenium (mcg) Vitamin A (mcg) Vitamin D (mcg) Vitamin E (mg) Vitamin B1 (mg) Pyridoxine (mg) Vitamin C (mg) Energy/nutrients
Note: aRefers to added sugar. p-value according to the Student’s t-test (significant when below 0.05).
Northeast
Southeast Beneficiary Mean Nonbeneficiary Mean p
Adolescents 1570.5 0067.8 0047.1 0212.9 0032.5 0017.7 0294.6 0009.1 1555.7 0008.1 0082.0 0080.8 0002.1 0003.3 0001.0 0001.2 0024.8 2436.9 0068.3 0081.8 0365.4 0130.1 0024.3 0344.2 0011.8 1415.2 0012.1 0077.1 0240.2 0002.1 0002.1 0001.5 0001.8 0085.2 1465.4 0071.4 0044.1 0197.2 0030.5 0015.4 0367.4 0009.4 1479.6 0009.0 0074.1 0322.7 0003.3 0004.5 0000.9 0001.1 0162.6 1864.5 0070.4 0062.3 0251.7 0052.4 0020.4 0566.1 0010.2 1525.6 0010.8 0068.1 0336.4 0002.9 0004.5 0001.2 0001.2 0116.3 <0.01 <0.01 <0.02 <0.01 <0.03 <0.01 <0.01 <0.04 <0.01 <0.03 <0.01 <0.01 <0.01 <0.01 <0.02 <0.04 <0.01 <0.01 <0.01 <0.01 <0.01 <0.01 <0.03 <0.01 <0.07 <0.01 <0.02 <0.08 <0.01 <0.06 <0.01 <0.04 <0.02 <0.01
Beneficiary Mean Nonbeneficiary Mean p
Adults
1437.80 0075.30 0041.30 0189.70 0017.70 0020.10 0340.10 0008.30
1211.20 0008.10 0108.10 0255.90 0005.20 0003.20 0000.82
0001.30 0238.80
1691.20 0077.80 0046.30 0220.20 0031.30 0025.50 0456.40 0012.20 0938.20 0010.30 0081.30 0167.20 0002.80 0005.40 0001.10 0001.40 0124.60
probability. This divided the propensity score variation into seven different strata or blocks (7 subgroups within the intervention and control groups) that had similar scores (common support region).
Some observations of the control group were excluded automatically from the sample
during pairing because their propensity scores were outside of the common support region. This resulted in a final sample in the Northeast and Southeast regions of 4,259 individuals (17.30% PBF beneficiaries) and 1,515 individuals (8.50% PBF beneficiaries), respectively. Regarding age group, adults represented 66.4% and 61.0% of
Table 3. Results of the coefficients estimated by the probit model of participation in the Programa Bolsa Família. Southeast and Northeast. Pesquisa de Orçamento Famíliar 2008-2009. Brazil.
Mean income per capita
Connection to the electrical grid Masonry wall
Sewerage Trash collection Number of bathrooms Number of household dwellers Number of children and adolescents Number of sons and daughters Urban household
Female Brown skin color
Head of household education level Variables
-0.1032907
-0.5081230 -0.1173800 -0.1171440
-0.1867520
-0.1524040
-0.0666080
-0.3693349
-0.0132907
-0.0510840 -0.9446090
-0.1448251 -0.0247631 Coefficient 0.000747 0.182195 0.104844 0.134186 0.098088 0.084779 0.029885 0.153817 0.315575 0.095066 0.083783 0.075774 0.012115 Standard error 0.015 0.051 0.911 0.383 0.047 0.042 0.056 0.015 0.674 0.591 0.001 0.056 0.041 p-value Northeast -0.0303100 -0.5144102 -0.2190182 -0.0287883 -0.1911906 -0.1401281 -0.0163275 -0.3646488 -0.0598278 -0.679208 -0.9647829 -0.0709007 -0.0702520 Coefficient 0.009680 0.717143 0.442426 0.172084 0.174358 0.184586 0.654160 0.268867 0.059800 0.170421 0.152829 0.132751 0.017061 Standard error 0.002 0.743 0.621 0.867 0.003 0.455 0.803 0.036 0.317 0.690 0.001 0.590 0.044 p-value Southeast
Table 4. Impact of the program on the intakes of energy and nutrients by age group in the Northeast region. Pesquisa de Orçamento Famíliar 2008-2009. Brazil.
Energy (kcal) Protein (g) Total lipids (g) Total carbohydrates (g) Added sugar (g) Fiber (g) Calcium (mg) Iron (mg) Sodium (mg) Zinc (mg) Selenium (mcg) Vitamin A (mcg) Vitamin D (mcg) Vitamin E (mg) Vitamin B1 (mg) Pyridoxine (mg) Vitamin C (mg) Variables 128.830 2.908 5.098 18.960 13.023 1.674 -78.935 1.477 -145.740 1.820 -9.846 -200.526 -1.225 -7.883 0.120 0.830 -34.388 ATT 29.700 1.855 1.174 4.210 2.160 0.413 10.520 0.215 62.850 0.265 3.660 37.385 0.670 2.270 0.023 0.132 15.445 Standard error
-4.328**
-1.967**
- 4.342**
- 4.499**
-6.029**
-4.053**
-7.501**
-6.856**
-2.096**
-6.871**
-2.690**
-5.364**
-4.386**
-4.821**
5.243**
2.652**
-5.280**
t Adolescents -46.380 -4.427 -3.650 -6.858 -5.725 0.360 -16.470 -0.400 -179.120 -0.810 -4.499 16.438 -0.320 -5.155 -0.072 -0.138 -43.543 ATT 36.800 2.522 1.363 5.320 1.854 0.583 13.943 0.290 63.722 0.320 3.210 82.331 0.350 2.609 0.028 0.037 11.930 Standard error -2.602** -1.627** -2.677** -1.289**
-3.089**
-0.617**
-1.181**
-1.377**
-2.811** -2.533** -0.907**
-0.200**
-1.00*0*
-2.371** -1.450**
-3.732**
-1.038**
t
Adults
the samples from the Northeast and Southeast regions, respectively.
In the Northeast region, the impact (ATT) of the PBF on adolescent beneficiaries regarded higher intakes of energy (approximately 129 kcal more than nonbeneficiaries), protein, total lipids, total carbohydrates, added sugar, fiber, iron, zinc, vitamin B1, and pyridoxine; and lower intakes of calcium, sodium, selenium, and vitamins A, D, E, and C. Adult beneficiaries had lower intakes of energy, total lipids, added sugar, sodium, zinc, vitamin E, and pyridoxine (Table 4).
Comparing the results of Table 4 (when propensity score matching is used) with those of Table 2 (without propensity score matching) for the Northeast regions showed that the sodium and selenium intakes of the adolescent beneficiaries decreased, and protein, iron, and zinc intakes increased. In adult beneficiaries pyridoxine intake decreased and the difference in protein intake disappeared.
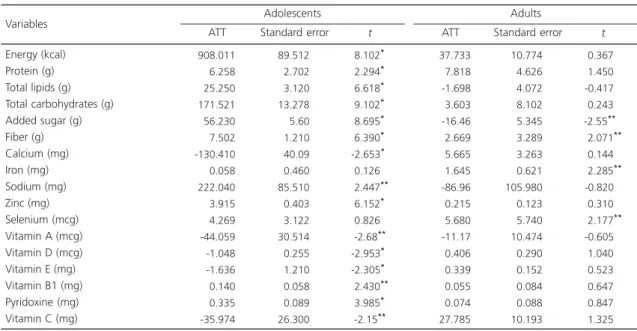
In the Southeast region, the impact (ATT) of the PBF on adolescent beneficiaries regarded
higher intakes of energy (approximately 908 kcal more), protein, total lipids, added sugar, fiber, sodium, zinc, vitamin B1, and pyridoxine; and lower intakes of calcium and vitamins A, D, E, and C. The adult beneficiaries from this region had higher intakes of fiber, iron, and selenium, and lower intake of added sugar (Table 5).
Comparison of the results of the Southeast region before and after calculating the propensity score (Table 2 with Table 5) showed that the intakes of adolescent beneficiaries increased for protein and sodium, and decreased for vitamin D. In adult beneficiaries, the difference in vitamin A intake disappeared, and added sugar intake decreased.
D I S C U S S I O N
The study findings show that adolescent PBF beneficiaries from both regions have higher intakes of energy and macronutrients, especially carbohydrates, lipids, and added sugar, than nonbeneficiaries. On the other hand, they had
Table 5. Impact of the program on the intakes of energy and nutrients by age group in the Southeast region. Pesquisa de Orçamento Famíliar 2008-2009. Brazil.
Energy (kcal) Protein (g) Total lipids (g) Total carbohydrates (g) Added sugar (g) Fiber (g) Calcium (mg) Iron (mg) Sodium (mg) Zinc (mg) Selenium (mcg) Vitamin A (mcg) Vitamin D (mcg) Vitamin E (mg) Vitamin B1 (mg) Pyridoxine (mg) Vitamin C (mg) Variables
908.011 6.258 25.250 171.521 56.230 7.502 -130.410 0.058 222.040 3.915 4.269 -44.059 -1.048 -1.636 0.140 0.335 -35.974
ATT
89.512 2.702 3.120 13.278 5.60 1.210 40.09 0.460 85.510 0.403 3.122 30.514 0.255 1.210 0.058 0.089 26.300
Standard error
8.102**
2.294**
6.618**
9.102**
8.695**
6.390**
-2.653**
0.126**
2.447** 6.152**
0.826**
-2.68** -2.953**
-2.305**
2.430** 3.985**
-2.15**
t
Adolescents
37.733 7.818 -1.698 3.603 -16.46 2.669 5.665 1.645 -86.96 0.215 5.680 -11.17 0.406 0.339 0.055 0.074 27.785
ATT
10.774 4.626 4.072 8.102 5.345 3.289 3.263 0.621 105.980 0.123 5.740 10.474 0.290 0.152 0.084 0.088 10.193
Standard error
0.367**
1.450**
-0.417**
0.243**
-2.55**0 2.071** 0.144**
2.285** -0.820**
0.310**
2.177** -0.605**
1.040**
0.523**
0.647**
0.847**
1.325**
t
Adults
smaller intakes of important micronutrients (calcium and vitamins A, D, E, and C). Adult beneficiaries from the Southeast region had better results as they had higher intakes of fiber, iron, and selenium than nonbeneficiaries.
According to the World Health Organization (WHO), approximately 2 billion people globally experience hidden hunger, which is the subclinical deficiency of micronutrients,
especially vitamin A, iron, and zinc17. Adequate
intakes of vitamins and minerals do not only prevent deficiency diseases, such as iron-deficiency anemia, hypovitaminosis A, and goiter, but also are associated with lower rates of chronic diseases because of the antioxidant action of some nutrients18,19.
Population-based20 and regional21,22 studies
have pointed out that Brazilian adolescents have inadequate intakes of important macronutrients, such as calcium and vitamins A, D, E, and C.
Adolescent eating habits may explain these results, such as low intakes of fruits, vegetables, milk, and dairy products; skipping
breakfast, and replacing main meals with snacks23.
Some studies also point out that Brazilians have been replacing fresh or minimally processed foods with ultra-processed foods, which have high
energy, sugar, fat, and/or sodium contents23,24.
This replacement results in excess energy and macronutrient intakes, and low micronutrient intake.
Adolescents are vulnerable to nutritional deficiencies because of higher susceptibility to environmental influences and higher nutrient requirements due to intensive growth,
characteristic of this life stage25. Calcium and
vitamin D are among the essential nutrients for growth as they are important for bone mass
formation and the growth spurt26. The present
study found that adolescent PBF beneficiaries from both regions have lower intakes of these nutrients, which emphasizes the importance of encouraging the intake of source foods, such as milk and dairy products.
In addition to calcium and vitamin D, vitamins A, C, and E are also important and consumed in lower amounts by adolescent beneficiaries from both regions. These vitamins do not only contribute to satisfactory growth, but they also have antioxidant functions, which makes them important protectors against chronic noncommunicable diseases, such as overweight, obesity, hypertension, and diabetes, among
others18,19. The prevalence of excess weight in
Brazilian adolescents has been increasing expressively in the last 35 years in all income groups, and its control is a challenge to public policies that promote healthy diets for this group27.
Studies that assessed the macronutrient and micronutrient intakes of adolescent PBF beneficiaries were not found in the literature; most studies mainly regard the food intake of
child beneficiaries11,28,29, which emphasizes
the contribution of the present study to the knowledge about the food intake of adolescent PBF beneficiaries. Nevertheless, there is literature consensus that income impacts access to food. When the impact of the PBF on the energy, macronutrient, and micronutrient intakes of adolescents from the Northeast and Southeast regions were compared, the impact, especially on the intakes of lipids, carbohydrates, added sugar, and sodium, was higher in the Southeast. According to the abovementioned discussion, food sources of these nutrients comprise mainly processed and ultra-processed foods, whose intakes are associated with income and presence
of food outlet chains that sell these foods20,30.
The Programa Bolsa Família had a negative impact on adult beneficiaries from the Northeast region as their intakes of micronutrients, such as zinc, vitamin E, and pyridoxine were lower. A population-based study found that adults from the Northeast region have more inadequate micronutrient intakes than adults from other
Brazilian regions31.
Comparison of the results of the PBF impact on adolescents and adults showed that adolescents have better results because the money provided by the program is spent preferably on food, especially food for the children, as reported by a nationwide study of
PBF beneficiaries12. Hence, all evidence indicates
that real increases in family income are used for feeding the children and adolescents of the beneficiary families.
Adults from the Southeast region had more favorable results, where the intakes of fiber, iron, and selenium were higher among beneficiaries. Beneficiaries from this region have better life conditions than those from the Northeast region, especially with respect to income and access to basic services, such as basic sanitation, and trash collection, among others. This demonstrates that in the Southeast region, not only do adolescent beneficiaries have better diets, but adult beneficiaries do too, which may be related to better life conditions of the beneficiary families that live in this region. The same results can be seen in the Northeast region as long as investments in housing, education, and basic sanitation, among others in this region follow those in the other Brazilian regions.
Generally, the study results show some eating characteristics of PBF beneficiaries, such as higher energy and macronutrient intakes, and lower intakes of important vitamins and minerals, which characterize a diet low in micronutrients. Because of a restricted budget, the low-income population ends up having a more monotonous diet, high in energy, simple carbohydrates,
saturated fat, and sodium32.
The complementary income provided by the PBF has increased the purchasing power of
the program’s beneficiaries; therefore, investments
are needed in actions that increase the availability and affordability of healthy foods. Moreover, adolescent-oriented interventions are critical as adolescence is a phase that forms eating habits, and the health relativities of the program do not include this group, only children under age seven years, pregnant women, and breastfeeders.
The present study was the first to assess the impact of the PBF on the intakes of energy and nutrients by age group in two expressive Brazilian regions. Matching propensity scores formed beneficiary and nonbeneficiary groups with similar potential confounders. Important political changes have occurred in Brazil from
2011 with the implementation of the Plano Brasil
sem Miséria (Brazil without Poverty Plan), which increased the PBF coverage. Therefore, carrying out a study comparable to this one is important to determine whether the results have or not changed over the years.
C O N C L U S I O N
The study results about the impact of the PBF on energy and nutrient intakes show that adolescent beneficiaries from both regions have higher intakes of energy and macronutrients, but lower intakes of important vitamins and minerals, characterizing a diet low in micronutrients. Adults had more favorable results in the Southeast region, where the intakes of fiber, iron, and selenium were higher among beneficiaries.
This indicates that in the Southeast region, in addition to the positive impacts on the
adolescents’ diet, positive impacts also occurred
on adults’ diets, which may be related to the better
life conditions of the beneficiary families from this region. In the Northeast only adolescents experienced positive results. Investments in policies that provide better structures are necessary in the Northeast for positive impacts also to affect adults.
represent a challenge for public policies, especially with respect to the low-income population as they experience difficult access to fruits, vegetables, whole grains, milk, and dairy products, which are the sources of the main vitamins and minerals.
The Programa Bolsa Família has successfully facilitated food acquisition, but the implementation of intersectoral public policies that work together with and complement the program continues to be necessary to ensure access to adequate and healthy food.
C O N T R I B U T O R S
N SPERANDIO conceived and designed the study, wrote and reviewed the intellectual content, and approved the final version of the manuscript. CT RODRIGUES analyzed and interpreted the results and approved the final version of the manuscript. SCC FRANCESCHINI reviewed the content and approved the final version of the manuscript. SE PRIORE reviewed the content and approved the final version of the manuscript.
R E F E R E N C E S
1. Instituto Brasileiro de Análises Sociais e Econômicas. Repercussões do programa bolsa família na segu-rança alimentar e nutricional das famílias bene-ficiadas. Brasília: IBASE; 2008.
2. Burlandy L. Transferência Condicionada de Renda e Segurança Alimentar e Nutricional. Ciên Saúde Colet. 2007; 12(6):1441-51.
3. Soares FV, Soares S, Medeiros M, Osório RG. Progra-mas de transferência de renda no Brasil: impactos sobre a desigualdade. Brasília: IPEA; 2007. [acesso 2015 fev 20]. Disponível em: http://www.ipea. gov.br/portal/images/stories/PDFs/TDs/td_1228.pdf 4. Segall-Corrêa AM, Marín-León L, Pérez-Escamilla R, Santos LMP, Paes-Sousa R. Transferência de renda e segurança alimentar e nutricional no Brasil: análise de dados nacionais. Rev Nutr. 2008; 21(Supl.):39s-51s. 5. Food and Agriculture Organization of the United Nations. The State of Food Insecurity in the World 2014. Strengthening the enabling environment for food security and nutrition. Rome: FAO; 2015. 6. Instituto Brasileiro de Geografia e Estatística.
Pes-quisa Nacional de Amostra por Domicílios (PNAD):
2013. Segurança Alimentar. Rio de Janeiro: IBGE; 2014.
7. Baptistella, JCF. Os impactos dos programas de transferência condicionada de renda na desigual-dade do rendimento domiciliar per capita nas macrorregiões brasileiras pós 2000. Brasília: Finan-ças Públicas; 2010 [acesso 2015 jan 30]. Disponível em: http://www3.tesouro.fazenda.gov.br/Premio_ TN/XVPremio/qualidade/3qualidadeXVPTN/ Tema_2_3.pdf
8. Ramos M. Aspectos conceituais e metodológicos da avaliação de políticas e programas sociais. Rev Planej Polít Públicas. 2009; 32(15):95-114. 9. Ramos MP, Schabbach LM. O estado da arte de
avaliação de políticas públicas: conceituação e exemplos de avalição no Brasil. Rev Adm Pública. 2012; 46(5):1271-94.
10. Duarte GB, Sampaio B, Sampaio Y. Programa Bolsa Família: impacto das transferências sobre os gastos com alimentos das famílias rurais. Rev Econ Sociol Rural. 2009; 47(4):903-18.
11. Saldiva SEM, Silva LFF, Saldiva PHN. Avaliação antro-pométrica e consumo alimentar em crianças me-nores de cinco anos residentes em um município da região do semiárido nordestino com cobertura parcial do programa bolsa família. Rev Nutr. 2010; 23(2):221-9.
12. Lignani JB, Sichieri R, Burlandy L. Changes in food consumption among the Programa Bolsa Família partipant families in Brazil. Public Health Nutr. 2010; 14(5):785-92.
13. Piperata BA, Ivanova SA, Da-gloria P, Veiga G, Polsky A, Spence JE, et al. Nutrition in Trasition: Dietary Patterns of Rural Amazonian Woman during a period economic change. Am J Human Biol. 2011; 23(4):458-69.
14. Instituto Brasileiro de Geografia e Estatística. Pes-quisa de Orçamento Famíliar (POF): 2008-2009: Análise do consumo alimentar pessoal no Brasil. Rio de Janeiro: IBGE; 2011.
15. Nusser SM, Carriquiry AL, Dood KW. A semiparametric transformation approach to estimating usual daily intake distribution. J Am Stat Assoc. 1996; 91(436):1440-49.
16. Khandker SR, Koolwal GB, Samad HA. Handbook on impact evaluation quantitative methods and practices, Washington, DC: The World Bank; 2010. 17. Organización Mundial de la Salud. Documento final de la Segunda Conferencia Internacional sobre Nutrición: Declaracion de Roma sobre la Nutrición. Roma: OMS; 2014.
magnesium, vitamin D, and fluoride. Washington (DC): National Academy Press; 1997.
19. Institute of Medicine. Food and Nutrition Board. Dietary reference intakes for vitamin C, vitamin E, selenium, and carotenoids. Washington (DC): National Academy Press; 2000.
20. Veiga GV, Costa RS, Araújo MC, Souza AM, Bezerra IN, Barbosa FS, et al. Inadequação do consumo de nutrientes entre adolescentes brasileiros. Rev Saúde Pública. 2013; 47( Supl. 1 ):212s-221s.
21. Verly Junior E, Cesar CLG, Fisberg RM, Marchioni DML. Socio-economic variables influence the prevalence of inadequate nutrient intake in Brazilian adolescents: Results from a population-based survey. Public Health Nutr. 2011; 14(9):1533-8. 22. Silva JVL, Timóteo AKCD, Santos CD, Fontes G,
Rocha EMM. Consumo alimentar de crianças e adolescentes residentes em uma área de invasão em Maceió, Alagoas, Brasil. Rev Bras. 2010; 13(1):83-93.
23. Leal GVS, Philippi ST, Matsudo SMM, Toassa EC. Food intake and meal patterns of adolescents, São Paulo, Brazil. Rev Bras Epidemiol. 2010; 13(3):457-67. 24. Levy-Costa RB, Sichieri R, Pontes NS, Monteiro CA. Disponibilidade domiciliar de alimentos no Brasil: distribuição e evolução (1974-2003). Rev Saúde Pública. 2005; 39(4):530-40.
25. Spear BA. Adolescent growth and development. J Am Diet Assoc. 2002; 102(3 Suppl.):S23-9. 26. Silva CCT, Teixeira AS, Goldberg TBL. Impacto da
ingestão de cálcio sobre a mineralização óssea em adolescentes. Rev Nutr. 2004; 17(3):351-9.
27. Instituto Brasileiro de Geografia e Estatística. Pes-quisa de Orçamento Famíliar (POF): 2008-2009: antropometria e estado nutricional de crianças, ado-lescentes e adultos no Brasil. Rio de Janeiro: IBGE; 2010.
28. Vasconcellos PD, Pires BL, Ferreira ZV, Souza LAC, Santos LC. Avaliação nutricional e padrão de con-sumo alimentar entre crianças beneficiárias e não beneficiárias de programas de transferência de renda, em escola municipal do Município de Belo Horizonte, Estado de Minas Gerais, Brasil, em 2009. Epidemiol Serv Saúde. 2012; 21(3):385-94. 29. Santos FPC, Vitta FCF, Conti MHS, Marta SN, Gatti
MAN, Simeão SFAP, Vitta, A. Estado nutricional de crianças beneficiadas pelo programa Bolsa Família. Rev Bras Cresc Desenv Humano. 2015; 25(3):313-8. 30. Neutzling MB, Assunção MCF, Malcon MC, Hallal
PC, Menezes AMB. Hábitos alimentares de escolares adolescentes de Pelotas, Brasil. Rev Nutr. 2010; 23(3):379-88.
31. Araújo MC, Bezerra IN, Barbosa FS, Junger WL, Yokoo EM, Pereira RA, et al. Consumo de macronu-trientes e ingestão inadequada de micronumacronu-trientes em adultos. Rev Saúde Pública. 2013; 47(1):177-89. 32. Drewnowski A. Obesity, diets, and social inequalities.
Nutr Rev. 2009; 67(Suppl.):S36-S39.