Alina Vitaliyivna Kulakova
BSc in Biochemistry
Production of membrane histidine kinases and structural
studies on Thiosulfate dehydrogenase
Dissertation for the Master degree in Biochemistry for Health
Supervisor: Margarida Archer Frazão
Co-supervisors: Ana Lúcia Rosário, José Artur Brito
October 2015
Alina Vitaliyivna Kulakova
BSc in Biochemistry
Production of membrane histidine kinases and structural
studies on Thiosulfate dehydrogenase
Dissertation for Master degree in Biochemistry for Health
Supervisor: Dr. Margarida Archer Frazão
Co-supervisors: Dr. Ana Lúcia Rosário, Dr. José Artur Brito
President: Dr. António Sebastião Rodrigues Arguer: Dr. Ana Luísa Moreira de Carvalho
Vowel(s): Dr. Maria Teresa Catarino, Dr. Margarida Archer Frazão
Instituto de Tecnologia Química e Biológica, Universidade Nova de Lisboa
II
Production of membrane histidine kinases and structural studies on
Thiosulfate dehydrogenase
Copyrights belong to Alina Kulakova, to Instituto de Tecnologia Química e Biológica and Universidade Nova de Lisboa
III
Acknowledgments
I would like to express my acknowledgments to Dr. Margarida Archer Frazão for accepting me in her laboratory and giving me opportunity to perform this work, for support and constructive criticism that allowed me to learn and develop my capabilities.
I want to acknowledge my colleagues from the Membrane Protein Crystallography Laboratory. Very especial thanks to Ana Lúcia Rosário for all that she taught me, for all the help and support during this year. In most difficult and critical moments of my work she was always ready to help and I am very happy to have met someone like her. I want to thank José Artur Brito for teaching me crystallization, data collection and structure resolution, for all help and criticism that helped me to learn. Many thanks for Ana Maria for teaching me the cloning, giving me advices, for help and support, even when she was already part of another research group. Many thanks for my colleague, Diogo Athayde, for his help, for work discussions and advices. Thank you all for the good atmosphere of trust and friendship in the laboratory.
I also would like to acknowledge all members of the Macromolecular Crystallography unit at ITQB for all tips and advices that helped me in my work.
V
Abstract
This thesis is organized in three chapters. Chapter 1 comprises a brief introduction on the methodology used throughout the work herein presented. Chapter 2 describes the production of membrane histidine kinases from Staphylococcus aureus and Clostridium difficile and chapter 3 the structural studies of a thiosulfate dehydrogenase from Campylobacter jejuni. The experimental work was performed in the Membrane Protein Crystallography Laboratory at Instituto de Tecnologia Química e Biológica, and also included a visit to SOLEIL synchrotron, Paris, France, to collect X-ray diffraction data.
Histidine kinases (HKs) are part of two-component signal transduction systems (TCS) that are integrated in a large variety of cellular signalling circuits, e.g. response to environmental changes, drug resistance and virulence. TCS are common in bacteria but absent in mammals, an evidence of their potential use as targets for the development of antimicrobial therapies. The aim of this work was the structural and functional characterization of purified histidine kinases. This work started by cloning several membrane sensor HKs from S. aureus and C. difficile, SrrB, AgrC, ArlS, BceS SaeS and NreB were selected for expression and solubilization tests. Generally, all targets showed a good expression in
Escherichia coli, but membrane extraction was a problematic step in this study. Due to the low protein
quantity in the soluble fraction, it was not possible to obtain sufficient amount of pure protein to further proceed for functional and structural studies. Therefore, we decided to perform structural studies on a soluble protein, a thiosulfate dehydrogenase from Campylobacterjejuni.
C.jejuni is a microaerophile mucosal intestinal pathogen that causes acute bloody diarrhoea in
humans. Such as many of sulfur bacteria, C. jejuni uses thiosulfate dehydrogenase (TsdA). TsdA was shown to be a bifunctional enzyme displaying both tetrathionate reductase and thiosulfate dehydrogenase activities. Depending on the organism needs, TsdA displays more of one of the activities. Since tetrathionate can be produced in the intestine during inflammation process, the ability of C. jejuni to reduce tetrathionate promotes its growth in the host organism gut. The aim of this work was the crystallization, data collection and model building for several C. jejuni TsdA variants, namely the “as isolated” form and the C138G and N254G mutants. All variants were crystallized by the vapour diffusion method and X-ray diffraction data was collected at a synchrotron source to 1.95, 2.37 and 1.72 Å resolutions, respectively. The structures were determined by molecular replacement using
Allochromatium vinosum TsdA as a template. Similar to A. vinosum TsdA, C. jejuni TsdA is a
heart-shaped molecule composed by two domains and containing two hexacoordinated heme molecules. The proximal axial ligand is His99 and distal ligand is Cys138 for heme 1 and His207 and Met255 for heme 2.
Keywords: Histidine kinases, membrane protein production and purification, X-ray crystallography,
VII
Resumo
Esta tese está organizada em três capítulos. O capítulo 1 inclui uma breve introdução da metodologia utilizada. No capítulo 2 está descrita a produção das cinases de histidinas membranares de
Staphylococcus aureus e Clostridium difficile; e no capítulo 3 são descritos os estudos estruturais da
proteína tiossulfato desidrogenase de Campylobacter jejuni. O trabalho experimental foi realizado no Laboratório de Cristalografia de Proteínas Membranares no Instituto de Tecnologia Química e Biológica, e também inclui uma visita ao sincrotrão do SOLEIL em Paris, França.
As cinases de histidina (HK) fazem parte do sistema de transdução do sinal de dois componentes (TCS) e estão integradas em inúmeros circuitos de sinalização, tais como resposta a alterações ambientais, resistência a antibióticos e virulência. TCS são comuns em bactérias e ausentes em mamíferos, o que leva à sua potencial utilização na terapia antimicrobiana. Este trabalho tinha como objetivo os estudos estruturais e funcionais de amostras puras de proteínas - cinases de histidina. O trabalho experimental começou com a clonagem de HK de S. aureus e C. difficile. AgrC, ArlS, BceS, SaeS e NreB foram selecionados para prosseguir com expressão e solubilização. Na generalidade, todas as proteínas alvo têm uma boa expressão em Escherichia coli, mas a extração a partir da membrana total foi um passo problemático neste estudo. Devido a uma baixa quantidade da proteína na fração solúvel, não foi possível obter proteína pura suficiente para prosseguir com os estudos funcionais e estruturais. Assim foi decidido escolher uma proteína solúvel para estudos estruturais – a tiossulfato desidrogenase
de Campylobacterjejuni.
C. jejuni é um patogénio microaerófilo da mucosa intestinal que causa diarreia sanguinolenta
aguda em humanos. Tal como muitas bactérias sulfurosas, C. jejuni utiliza a tiossulfato desidrogenase (TsdA).TsdA mostra ser uma enzima bifuncional, exibindo as atividades de tiossulfato desidrogenase e tetrationato redutase. As bactérias desempenham mais de uma atividade do que da outra, dependendo do tipo e necessidades do organismo. Uma vez que tetrationato pode ser produzido no intestino durante os processos inflamatórios, a habilidade de reduzir o tetrationato leva ao crescimento do C. jejuni no intestino do hospedeiro. O objetivo deste trabalho foi a cristalização, recolha dos dados e construção do modelo cristalográfico para diferentes variantes de TsdA C. jejuni, nomeadamente nativa e mutantes C138G e N254G. Todos os variantes foram cristalizados pelo método de difusão de vapor e os dados de difração de raios-X foram recolhidos em sincrotrão a resoluções 1.95, 2.37 e 1.72 Å, respetivamente. Todas as estruturas foram determinadas por substituição molecular usando como modelo a TsdA do
Allochromatium vinosum. À semelhança da TsdA de A. vinosum, aTsdA de C. jejuni é uma molécula
em forma de coração, constituída por dois domínios que contêm duas moléculas de hemo hexacoordenadas. O ligando proximal do hemo 1 é His99 e o ligando distal é Cys138, tal como His207 e Met255 para o hemo 2.
Palavras-chave: Cinase de histidina, produção e purificação das proteínas membranares,
IX
Table of contents
Abstract ... V Resumo ... VII Table of contents ... IX Index of Figures ... XI Index of Tables... XIII Abbreviation ... XV
Chapter 1 ... 1
1. Introduction for materials and methods ... 3
1.1 Recombinant DNA technology... 3
1.2 Protein production ... 4
1.3 X-ray Crystallography ... 6
Chapter 2 ...13
2. Introduction ...15
2.1 Two-component Systems and Bacterial Antibiotic Resistance ...15
3. Materials and methods...21
3.1 DNA cloning of HK targets in pET-52b(+) (Novagen) ...21
3.2 Expression, solubilization and purification ...25
4. Results and Discussion ...29
4.1 DNA cloning of HK targets in pET-52b(+) ...29
4.2 Expression test of the S. aureus targets ...35
4.3 Solubilization tests ...43
4.4 Purification tests: magnetic Beads ...46
Chapter 3 ...55
5. Introduction ...57
6. Materials and methods...59
General methodologies and reagents ...59
Crystallization and data collection ...59
Structure determination and refinement ...60
7. Results and Discussion ...61
Conclusion ...67
References ...71
Appendix ...75
A. Appendix A ...77
B. Appendix B ...80
XI
Index of Figures
Figure 1.1 - Plasmid insertion and GOI propagation. ... 4
Figure 1.2 - Solubilization of membrane protein. ... 5
Figure 1.3 - Phase diagram. ... 7
Figure 1.4 - Hanging and sitting drop crystallization methods. ... 7
Figure 1.5 - Unitcell. ... 8
Figure 1.6 - SOLEILsynchrotron. Saint-Aubin, France ... 8
Figure 1.7 - X-ray data collection process... 9
Figure 2.1 - Structure of basic Histidine Kinase. ...16
Figure 2.2 - Phosphotransfer and Phosphorelay systems.. ...17
Figure 3.1 - Scheme of sucrose solutions addition in the sucrose gradient ...27
Figure 4.1 - 0.8% agarose gel.PCR results for AgrC and SrrB genes.. ...29
Figure 4.2 - 0.8% agarose gel.PCR results for AgrC and SrrB genes. ...30
Figure 4.3 - 0.8% agarose gel.Double digestion results for AgrC and SrrB genes. ...30
Figure 4.4 - 0.8% agarose gel. Results of pET-52b(+) doubledigestion. ...31
Figure 4.5 - 0.8% agarose gel. Results of pET-52b(+) double digestion. ...31
Figure 4.6 - 0.8% agarose gel. PCR results for AgrC and SrrB genes.. ...32
Figure 4.7 - 0.8% agarose gel. Double digestion results for AgrC and SrrB genes.. ...32
Figure 4.8 - 0.8% agarose gel. Results of SrrB vector double digestion.. ...33
Figure 4.9 - 0.8% agarose gel. Results of AgrC vector double digestion. ...33
Figure 4.10 - 0.8% agarose gel. PCR results of S. aureus (KinB, GraS, PhoR and Unk) and C. difficile (SaeS, BceS, AgrC and SrrB) genes ...34
Figure 4.11 - 0.8% agarose gel. PCR results of C. difficile (KinB, GraS, Unk and VanS) genes ...34
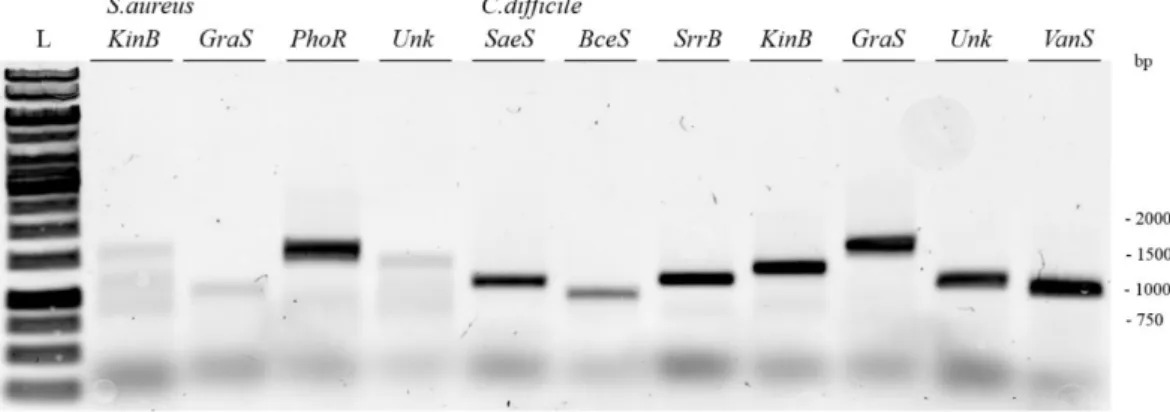
Figure 4.12 - 0.8% agarose gel. PCR results S. aureus (KinB, GraS, PhoR and Unk) and C. difficile (SaeS, BceS, SrrB, KinB, GraS, Unk and VanS) genes. ...35
Figure 4.13 –12% SDS-PAGE to analyse ArlS expression tests in E. coli at 37ºC ...36
Figure 4.14 - InVision technique to access ArlS expression tests in E. coli at 37ºC ...36
Figure 4.15 - Western Blot to evaluate ArlS expression tests in E. coli at 37ºC. ...37
Figure 4.16 –12% SDS-PAGE to analyse ArlS expression tests in E. coli at 28ºC ...37
Figure 4.17 - Western Blot to evaluate ArlS expression tests in E. coli at 28ºC. ...38
Figure 4.18 –12% SDS-PAGE to analyse BceS expression tests in E. coli at 37ºC...39
Figure 4.19 - Western blot to evaluate BceS expression tests in E. coli at 37ºC. ...40
Figure 4.20 –12% SDS-PAGE to analyse SaeS expression tests in E. coli at 37ºC. ...40
Figure 4.21 - Western blot to evaluate SaeS expression tests in E. coli at 37ºC. ...40
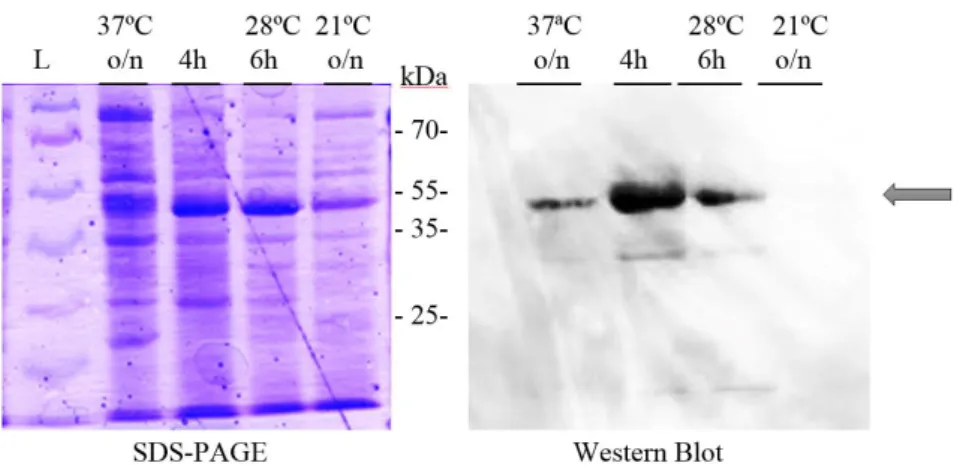
Figure 4.22 –10% SDS-PAGE and Western Blot to analyse ArlS expression tests in E. coli at different temperatures and post-induction time ...41
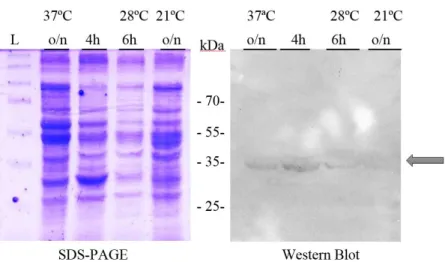
Figure 4.23 – 10% SDS-PAGE and Western Blot to analyse BceS expression tests in E. coli at different temperatures and post-induction time. ...42
Figure 4.24 –10% SDS-PAGE and Western Blot to analyse SaeS expression tests in E. coli at different temperatures and post-induction time. ...42
Figure 4.25 –10% SDS-PAGE and Western Blot to analyse ArlS expression tests in E. coli at different volumes ...43
Figure 4.26 –10% SDS-PAGE to analyse ArlS solubilization. ...44
Figure 4.27 –In Vision to evaluate ArlS solubilization ...44
Figure 4.28 –10% SDS-PAGE and Western blot to analyse BceS solubilization with 1.5% Triton X-100. ...44
Figure 4.29 –10% SDS-PAGE and Western blot to analyse BceS solubilization with 1.5% DM ...45
Figure 4.30 – 10% SDS-PAGE and Western blot to analyse BceSsolubilization with 1.5% DDM. ...45
Figure 4.31 –10% SDS-PAGE to analyse SaeS solubilization...46
Figure 4.32 –In Vision to analyse SaeS solubilization ...46
Figure 4.33 –10% SDS-PAGE and Western blot to analyse BceS purification with magnetic bids. ...47
Figure 4.34 - Chromatogram of BceS purification by HPLC with Ni-NTA column ...47
Figure 4.35 –10% SDS-PAGE to analyse BceS purification by Ni-NTA column ...48
Figure 4.36 –10% SDS-PAGE and In Vision to analyse BceS batch purification ...48
Figure 4.37 –10% SDS-PAGE and In Vision to analyse ArlS batch purification ...49
Figure 4.38 –10% SDS-PAGE and In vision to analyse SaeS batch purification ...49
Figure 4.39 –10% SDS-PAGE to analyse SaeS quantification ...50
Figure 4.40 - Lysozyme calibration curve used to quantify SaeS in the purified fractions ...50
Figure 4.41 –10% SDS-PAGE to analyse SaeS gel filtration ...51
XII
Figure 4.43 –10% SDS-PAGE to analyse NreB, SrrB and AgrC expression in E. coli at 37ºC ...52
Figure 4.44 –10% SDS-PAGE to analyse NreB, SrrB and AgrC expression in E. coli at 28ºC ...52
Figure 4.45 – 10% SDS-PAGE to analyse NreB solubilization ...53
Figure 5.1 Schematic representation of the hydrologicand sedimentary sulfur cycle ...57
Figure 5.2 –In vivo model for bi-directional electron transfer between tetrathionate and thiosulfate catalysed by TsdA from C. jejuni ...58
Figure 7.1 Crystals of "as isolated" and N254G variants ...61
Figure 7.2 –Structural comparison of C. jejuni TsdA and A. vinosum TsdA. ...63
Figure 7.3 - Heme coordination of the “as isolated”, C138G and N254G TsdA structures ...64
Figure 7.4 - TsdA electrostatic surface potential ...65
Figure B.1 Western blot placing sample scheme ...82
Figure C.1 - 12% SDS-PAGE to analyse ArlS solubilization during 2 hours at 4ºC ...83
Figure C.2 - 12% SDS-PAGE to analyse ArlSsolubilization during 4 hours at 4ºC ...83
Figure C.3 - 12% SDS-PAGE to analyse ArlS solubilization overnight at 4ºC ...83
Figure C.4 - 12% SDS-PAGE to analyse ArlSsolubilization with LDAO at 4ºC ...84
Figure C.5 - 12% SDS-PAGE to analyse ArlS solubilization withFos-choline at 4ºC ...84
Figure C.6 –12% SDS-PAGE and Western blot to analyse solubilization of ArlS obtained from cell disrupter and chemical lysis with 1% DDM and 700 mM NaCl at 4ºC ...84
Figure C.7 - 12% SDS-PAGE and Western blot to analyse solubilization ofArlS at room temperature ...85
Figure C.8 –12% SDS-PAGE and Western blot to analyse ArlS outer and inner membrane separation with sucrose gradient technique ...85
Figure C.9 –12% SDS-PAGE and Western blot to analyse outer membrane solubilization at 4ºC ...85
Figure C.10 –12% SDS-PAGE and western blot to analyse ArlS outer membrane soluble fraction at 4ºC ...86
XIII
Index of Tables
Table 3.1 - PCRconditionsusedforSrrBandAgrCgenesofMRSA ...23
Table 4.1 –Summary of all results obtained in the cloning, expression, solubilization and purification of S. aureus Histidine Kinases...53
Table 4.2 Summary of all results obtained in the cloning, expression, solubilization and purification of C. difficile Histidine Kinases...54
Table 7.1 DatacollectionandrefinementstatisticforC. jejuniTsdAstructures. ...62
Table A.1 Targetgeneinformation ...77
Table A.2 PrimersforMRSAtargetgenes ...78
Table A.3 Primers forC. difficile targets ...79
XV
Abbreviation
A. vinosum Allochromatium vinosum
Å Ångström
ADP Adenosine diphosphates AIP Autoinducing Peptide ATP Adenosine triphosphates
bp Base pair
BSA Bovine serum albumin
C. difficile Clostridium difficile
C. jejuni Campylobacter jejuni
CA Catalytic ATP-binding domain CAMPs Cationic Antimicrobial Peptides
CB Carbenicillin
CD Circular Dichroism
CM Chloramphenicol
CMC Critical Micellar Concentration Cymal5 5-cyclohexyl-1-pentyl-β-D-maltoside
Da Dalton
DDM n-dodecyl-β-D-maltoside
DHp Dimerization and Histidine phosphotransfer domain DLS Dynamic Light Scattering
DM Dodecyl-β-maltoside
DNA Deoxyribonucleic acid
E.coli Escherichia coli
EDTA Ethylenediaminetetraacetic acid
GOI Gene of interest
HEGA Cyclohexylethanoyl-N-Hydroxyethylglucamide
HK Histidine Kinase
HPLC High Performance Liquid Chromatography HPt Histidine phosphotransferase
IMAC Immobilized Metal-Affinity Chromatography IPTG Isopropyl-β-D-thiogalactopyranoside
LDAO n-Dodecyl-N,N-Dimethylamine-N-Oxide MAD Multiple Anomalous Dispersion
MKH2 Menaquinol pool
MP Membrane Protein
MRSA Methicillin-resistant S. aureus Ni-NTA Nickel-nitriloacetic acid NMR Nuclear Magnetic Ressonance
OD Optical Density
PAGE Polyacrylamide gel electrophoresis
Pi Inorganic phosphate
PBS Phosphate buffer solution PCR Polymerase Chain Reaction
PDB Protein Data Bank
PEG Polyethylene Glycol
RNA Ribonucleic acid
Rpm Revolutions per minute
RR Response Regulator
SAD Single Angle Dispersion SAXS Single Angle X-ray scattering SDS Sodium dodecyl sulphate SEC Size exclusion chromatography
XVI
TCS Two-component signal transduction system Tris Tris(hidroxymethyl)-aminomethane Triton X-100 Nonaethylene glycol octylphenol ether TsdA Thiosulfate dehydrogenase
w/v Weight by volume
v/v Volume by volume
2D Bi-dimensional
1
Chapter 1
3
1.
Introduction for materials and methods
In this chapter we will make a brief description of the techniques that were used on the production of membrane sensor histidine kinases and structural studies on thiosulfate dehydrogenase.
1.1 Recombinant DNA technology
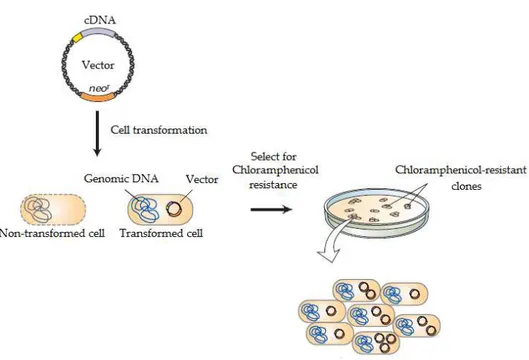
Protein structure and function studies require large quantities of pure protein. Many proteins are normally expressed at very low amounts, precluding their isolation and purification processes. In order to produce larger quantities of a target protein, recombinant DNA technology is used. This process starts with DNA cloning by recombinant DNA methods. Molecular cloning is a set of experimental methodologies used to assemble recombinant DNA molecules and to direct their replication within a specific organism. This process consists in a DNA fragment insertion into a vector that is introduced into a host cell. The vector replicates and generates a large number of identical DNA molecules. In
Escherichia coli (E. coli) organism, widely used for recombinant protein expression, plasmids are the
most commonly used vectors. Plasmids are circular, double-stranded DNA molecules which naturally occur in bacteria and in lower eukaryotic cells. This DNA duplicates before every cell division, like a chromosomal DNA, and those copies are transferred to the daughter cells. Such process assures vector propagation through cell generation. Different plasmid types were engineered in order to optimize their use as vectors in DNA cloning. DNA fragment insertion into the plasmid requires two types of enzymes: restriction enzymes and DNA ligase. Restriction enzymes are endonucleases, which recognize specific sequences (restriction sites) and cleave DNA strands – DNA restriction. Restriction of specific gene of interest (GOI) allows the isolation of the gene encoding for the target protein. The GOI can be inserted into the plasmid by DNA ligase, which covalently join the complementary ends of the fragment and plasmid DNA.
Cell transformation
4
Figure 1.1 - Plasmid insertion and GOI propagation. The vector is inserted in a prokaryotic cell that will be selected by chloramphenicol resistance (Adapted from Molecular Cell Biology2).
1.2 Protein production
Vectors engineered for protein production are called expression vectors. These specific vectors contain a promoter region – DNA sequence that allows the transcription of the inserted GOI. The promoter is located at the adjacent region upstream of the target gene, so in the presence of an inductor, transcription occurs. One of the most common promoters is the lac promoter. Transcription only occurs in the presence of lactose or lactose analogues, such as isopropyl β-D-1-thiogalactopyranoside (IPTG). Most soluble proteins can be overexpressed to high yields in terms of protein quantities. This is in sharp contrast to what normally happens with membrane proteins. The crucial and often limiting step is the protein insertion and folding within the membrane. Incorrect insertion or folding produces large quantities of inactive and/or aggregated protein.
5
Solubilization and purification of membrane proteins
Before proceeding with the purification process, the membrane protein needs to be solubilized from the membrane. Integral membrane proteins are extracted from the cell membrane with the help of detergents. Detergents are amphiphilic molecules that can form micelles with membrane proteins allowing their hydrophobic regions to be shielded in the interior of the micellar complex, while their hydrophilic regions are exposed to the solvent. These detergent-membrane protein micellar complexes are soluble in aqueous solution. Detergents can be classified as ionic (anionic and cationic), non-ionic and zwitterionic. Non-ionic detergents, particularly polyethylene and sugar detergents, are most often used in membrane protein solubilization and purification processes. Polyethylene detergents contain a polymeric chain of variable length that is usually used at neutral pH and at peripheral membrane protein extraction. Sugar detergents contain an hydrophobic part that is linked to a carbohydrate, such as glucose, maltose and sucrose, by a glycosidic bond. Those detergents are commonly used at integral membrane protein extraction.
The critical micelle concentration (CMC, minimal detergent concentration for micelle formation) is an important parameter to take in consideration when choosing a suitable detergent for membrane extraction (Figure 1.2).
Figure 1.2 - Solubilization of membrane protein. Concentration below CMC value allows dissolution of membrane protein, but not micelle formation. In order to obtain micelles, concentration above CMC value is necessary (adapted from Molecular cell biology2).
6
chromatography (IMAC). Metal-chelating matrixes are loaded with transitional metal ions, such as cobalt (Co2+), nickel (Ni2+), copper (Cu2+) and zinc (Zn2+). The target protein is able to bind such matrices because of the interaction between the metal ion and the histidine residues. After purification, the protein quality needs to be assessed. Various techniques, such as SDS-PAGE, western blots, dynamic light scattering (DLS) and others can be used to determine the protein purity, homogeneity and stability. Afterwards, several techniques, such as X-ray crystallography, small angle X-ray scattering (SAXS), nuclear magnetic resonance (NMR) and circular dichroism (CD), may be used to obtain protein structure information. Usually, this information is complemented with specific functional assays to determine the activity of a pure protein in solution.
1.3 X-ray Crystallography
X-ray crystallography is the most used technique to determine three-dimensional structures of biological macromolecules, such as proteins, nucleic acids and viral particles. Structure determination requires single crystals of the macromolecule under study3.
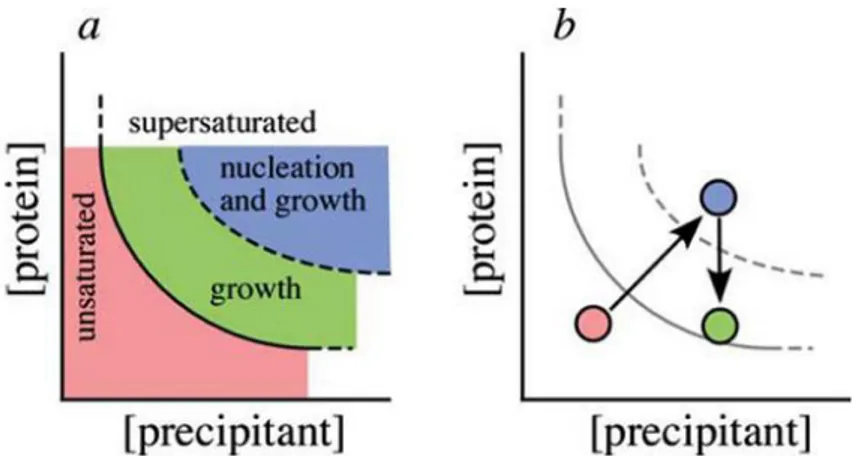
Crystallization is the most critical step in protein crystallography. Since it is not possible to know in advance in which conditions a specific protein will crystallize, many different conditions have to be tested, such as protein concentration, precipitation agents, temperature, pH, buffers, ionic strength and others. For this purpose crystallization screens are performed in order to test different conditions. Several commercial kits are available that include conditions in which other proteins have crystallized. Many laboratories use crystallization robots for crystallization screens, because it uses nanolitre volume drops, reducing the amount of protein needed to test an extensive number of conditions3.
7
Figure 1.3 - Phase diagram. Pink region corresponds to unsaturated zone, green region to growth phase and blue to nucleation. The ideal strategy is to start in the blue region conditions of diagram and, when the nuclei are formed, pass to the green region that corresponds to the growing phase without any additional nucleation process4 The vapour diffusion technique is commonly applied using the sitting and hanging drop methods (Figure 1.4). Choosing the crystallization method is important, because the drop shape, and surface area and tension affects the equilibration rate and hence the number of nuclei4.
Figure 1.4 - Hanging and sitting drop crystallization methods. In the hanging drop method, a drop (usually
1-2 μl) of the protein solution is placed on an inverted cover slip and mixed with reservoir solution. In the sitting
drop method, drop is placed on a pedestal that is separated from the reservoir4.
The crystal, is then transferred from the crystallization drop and mounted on the diffractometer in order to assess diffraction quality (resolution limit and diffraction pattern). Crystals are frequently pooled using tiny loops. During mounting and data collection, the crystal must be surrounded by mother liquor, which will prevent it to dry out and degrade.
8 X-ray diffraction
A crystal is a highly ordered microscopic structure that is composed by unit cells – smallest repeating units (figure 1.5).
Figure 1.5 - Unit cell. The position of an atom in the unit cell can be defined by spatial coordinates x,y,z5.
Unit cell contains the asymmetric unit – smallest fraction that can be rotated and translated. After obtaining crystals with the desired quality, these are mounted between an X-ray source and X-ray detector. Several X-ray sources are available: X-ray sealed tube, rotating anode X-ray tube, liquid anode and synchrotron X-ray source. Synchrotron radiation sources provide X-ray beams with high intensity, low divergence and a wide range of energy (figure 1.6). High intensity increases the signal of data acquisition, low divergence reduces overlap between adjacent reflections and wide range of energy enable the selection of specific wavelength3.
Figure 1.6 - SOLEIL synchrotron. Saint-Aubin, France. (adapted from -http://enygf2015.org/program/technical-visits/saclay/)
9
diffraction pattern. These are recorded on a detector (figure 1.7). Intensities of reflections are dependent from the photon number that a given crystal produces in the diffraction pattern. The position and intensities of reflections contain information needed to determine the molecular structure.
Figure 1.7 - X-ray data collection process. The crystals diffract the source beam into many discrete beams that produce distinct spots, i.e. reflections, on the detector5.
An optical scanner transmits the spots positions and intensities in digital form to a computer for analysis. The usual strategy is to take few test images at 0 and 90º apart about an axis perpendicular to the X-ray beam and index these. Indexing consists in determining the reciprocal unit cell, namely parameters and the direction of its axis. This step allows determining the Bravais lattice that is used to define the crystalline arrangement. Bravais lattice allows the identification of Laue symmetry and space group, so a data collection strategy can be devised to obtain a data set as complete as possible using the least scanning width possible. After data collection, all images are integrated and intensities are extracted and scaled. Several diffraction patterns are obtained in different crystal orientations, which make it possible to construct a three-dimensional (3D) data set from bi-dimensional (2D) diffraction patterns.
The atomic position in a crystal structure is defined by three-dimensional coordinates (x,y,z) and individual diffracted beams are defined by Miller indices (h,k,l). Diffracted beams correspond to the sum of all atoms in unit cell that are characterized by an amplitude |Fhkl| and a phase αhkl. The amplitude is related with the number of atoms and the phase is derived from the atom position within the unit cell3. However, the phase information is lost during data collection (see below).
10 Phase determination
Several direct and indirect methods can be chosen to overcome the phase problem. Ab initio is a direct method that requires one good-quality data set at atomic resolution (<1.2 Å). Indirect methods comprise molecular replacement, anomalous dispersion and isomorphous replacement. Molecular replacement is a method that is frequently used, in which a known structure is used to estimate the phases for an unknown structure. The model protein must have structural homology with the unknown protein, such as in the case of mutated proteins, complexes with ligands or structurally related proteins. When the structural similarity is unknown, molecular replacement is used in the base of the sequence identity, which must to be at least 30-40%. Anomalous dispersion is a method that is based on the heavy atoms ability to scatter X-rays anomalously near their absorption edges, which leads to changes in amplitudes and phases. The resulting changes might be used to estimate the lost phases. In this method one or more wavelengths might be used. Single anomalous dispersion (SAD) uses one wavelength that corresponds to the peak of the heavy atom. Multiple anomalous dispersion (MAD) use two or more wavelengths that include peak of the heavy atom and might include low energy remote, inflection point and/or high energy remote wavelengths. Isomorphous replacement method also requires heavy atoms that induce measurable changes in diffraction pattern. This changes, in relation to the “native” crystals, can be used to deduce the positions of the heavy atoms, which provide the estimates of the protein phase angles. Both methods might be used for metalloproteins, which contain one or more endogenous heavy atoms (e.g. iron (Fe), cupper (Cu), molybdenum (Mo), zinc (Zn) and nickel (Ni)). For the other proteins, crystals might be soaked with several metals, such as mercury (Hg), platinum (Pt), gold (Au), lead (Pb), silver (Ag), or protein incubated with them and then co-crystalized.
After phase estimation, an electron density map can calculated and an initial model built. The model must be refined against the experimental data in order to optimize the agreement between observed and calculated structure factors amplitudes |Fhkl|3. .
Model validation
Several validation tools were developed to evaluate the quality of the experimental data, the refined model and agreements between them. Several statistical parameters must be reported, such as resolution, completeness, multiplicity, signal-to-noise ratio and merging R factor, which allows assessing the quality of the diffraction data.
11
indicates how many times above the noise the intensities were measured. Rmerge value measures the agreement between the multiple independent observations of the same reflection: a good data set should have a low Rmerge and high values might indicate problems with the data collection/processing. In the highest resolution shell, Rmerge may be as high 30-40%, although values in order of 60-70% are still reasonable for high-symmetry space groups. Rfactor or Rwork measure the agreement between experimental structure factor amplitudes (Fobs) and calculated from the model (Fcalc). Rfree is the Rfactor that use structure factor amplitudes from a “test set”, which contains data not used in refinement, and is useful for cross validation.
Model geometry can be validated using different programs that analyze stereochemistry, local chemistry environments and others. Other properties, such as bond lengths, bond angles, φ ψ torsion angles, side chain torsion angles, peptide flips, clashes, Cβ derivations, asparagine/histidine/glutamine side chain flips, local environment profiles, Ramachandran and rotamer outliers, can also be checked3.
Thesis objectives
13
Chapter 2
15
2.
Introduction
2.1 Two-component Systems and Bacterial Antibiotic Resistance
The two-component signal transduction systems (TCS) enable organisms to sense, respond and adapt to a wide range of environments or intracellular states, e.g. stresses and growth conditions. These signalling systems are integrated into a large variety of cellular signalling circuits, e.g. carbohydrate metabolism, quorum sensing, iron regulation, drug resistance and virulence7.
These systems involve two components: histidine kinase (HK) and an associated response regulator (RR). TCS are found in all three kingdoms of Life: Bacteria, Archaea and Eukarya8. For the unicellular organisms HKs are related with nutrient sensing, chemoattractants, osmotic conditions and others. In Eukarya, HKs are found in plants and free-living organisms, such as yeast, fungi and protozoa and are involved in regulation of hormone-dependent processes. No HK genes are present in the Caenorhabditis
elegans, Drosophilamelanogaster and Homo sapiens, as these enzymes are absent in animal kingdom9.
Structure and Function of Histidine Kinases
16
Figure 2.1 - Structure of basic Histidine Kinase. Basic HK structure is composed by Sensing domain, Linker domain and Kinase catalytic core. Catalytic core possesses DHp and CA domains. (Adapted from Pikyee Ma PhD thesis (2010)).
Despite of their diversity, HKs can be divided in two classes: orthodox and hybrid kinases. Most orthodox HKs function as periplasmic membrane receptors, while some are soluble cytoplasmic HKs. Soluble HKs can be regulated by intracellular stimuli and/or interaction with other proteins. The more elaborated kinases, hybrid kinases, contain multiple phosphodonor and phosphoacceptor sites. Their complexity allows the integration of different inputs and outputs into a signalling pathway. Hybrid kinases are rare in prokaryotes, whereas eukaryotic HKs are almost exclusively hybrid kinases8.
Structure and Function of Response Regulator
A typical response regulator contains two domains: one conserved N-terminal regulatory domain and one variable C-terminal effector domain. The regulatory domain functions as an activator of the effector domain. Many different types of effector domains exist in nature, where the most prevalent are involved in DNA binding, and their response is coupled to changes in transcription7,10.
TCS Architecture
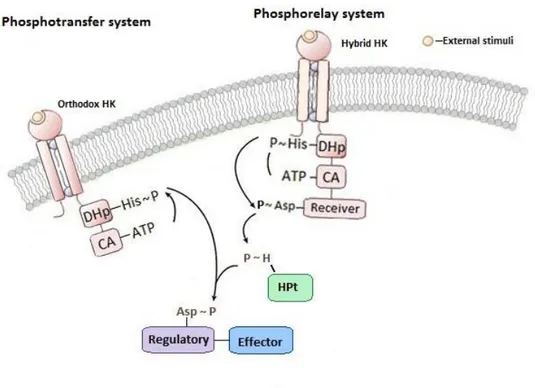
Orthodox and Hybrid kinases are involved in different TCS types, the phosphotransfer and the phosphorelay systems, respectively7,10 (figure 2.2). Phosphotransfer systems have a more simplistic design, which is composed by three phosphotransfer reactions:
17
Phosphorelay systems are involved in more elaborated multiple phosphotransfer pathways and incorporate five phosphotransfer reactions:
1. Autophosphorylation: HK-HisI + ATP ↔ HK-HisI~P + ADP 2. Phosphotransfer I: HK-HisI~P + Rec-Asp1 ↔ HK-HisI +Rec-AspI~P 3. Phosphotransfer II HK-AspI~P + HPt-HisII ↔ Rec-AspI + HPt-HisII~P 4. Phosphotransfer III: HPt-HisII~P + RR-AspII ↔ HPt-HisII + RR-AspII~P 5. Dephosphorylation: RR-AspII~P +H2O ↔ RR-AspII + Pi
Autophosphorylation is a bimolecular reaction between homodimers, in which one HK monomer catalyses the phosphorylation in the second monomer10.
In the phosphotransfer system, an HK autophosphorylates a conserved histidine residue and transfer phosphoryl group to a response regulator. In the phosphorelay system, the autophosphorylation is followed by phosphate transfer to an aspartate residue of an additional C-terminal receiver domain. Then, a phosphate is transferred to the histidine residue of an Histidine Phosphotransferase (HPt). HPt transfers a phosphoryl group to aspartate residue of the soluble response regulator7,10.
18 Two-component systems in prokaryotes
Bacteria can express a different number of TCS, i.e. ranging from 0 in Mycoplasma genitalium to 80 in
Synechocystis sp8. The ability of bacteria to cause diseases is dependent on the expression of different
cell wall-associated and secreted virulence factors. The expression of many virulence factors is controlled by several TCS, allowing bacteria to adhere and colonise host cells11.
The agr operon is a global regulon that coordinates many critical virulence pathways. This operon consists of five genes (agrB, agrD, agrC, agrA and hdl) that encode two different transcripts (RNAII and RNAIII), whose synthesis is initiated by two different promoters (P2 and P3)12. Transcription at P2 results in the production of RNAII that encodes AgrB, AgrD, AgrC and AgrA. AgrC is a histidine kinase and AgrA is the respective response regulator. AgrD produces autoinducing peptides (AIP) that are secreted to the extracellular space by AgrB. AgrC recognizes the secreted AIP and, through phosphotransfer system, phosphorylates AgrA. This two-component system results in the production of RNAIII, an effector molecule that modulates transcription of numerous genes, e.g. several virulence factors13.
The agr locus mediates ArlRS and SrrAB two-component systems. The ArlRS system, comprises a histidine kinase – ArlS, and a response regulator - ArlR, and is involved in the regulation of several virulence factors, such as protein A, α-toxins, β-haemolysin, coagulase, lipase, and others12. The staphylococcal respiratory response AB system (SrrAB) is involved in adaptation to anaerobic growth and in regulation of several virulence factors. SrrB is a histidine kinase and SrrA is the respective response regulator14.
The NreABC is an oxygen sensing system that is involved in nitrogen regulation. Upon oxygen depletion, NreB (HK) autophosphorylation increases. NreB phosphorylates NreC (RR), which will bind to specific promoters of nitrate reductase and nitrite reductase operons and to NarT gene that is involved in nitrate and nitrite transport. NreA protein is also encoded by nreABC operon but its function is still unknown15.
The TCS SaeR-SaeS is encoded by SaeRS locus and regulates the expression of genes that are important to initiate infection. SaeRS system is involved in the control of different virulence factors, such as α-toxins, β-haemolysin, coagulase and others. SaeRS system negatively affects AgrA expression, despite the fact that Agr systems acts upstream of Sae. This fact indicates that TCS systems interact with each other14.
19
In AlgB-KinB, the HK KinB controls several gene expressions involved in carbohydrate metabolism, quorum sensing, iron regulation, motility and virulence factors expression18.
In SpaK-SpaR, the HK SpaK autophosphorylates in the presence of subtilin – an antimicrobial peptide antibiotic. SpaK phosphorylates SpaR, the RR, which will bind to specific promoters and induce a response19. SpaK-SpaR system from Bacillus subtilis regulates biosynthesis of subtilin, in order to inhibit growth of a broad range of pathogenic Gram-positive bacteria20.
Some bacteria developed TCS systems that confer resistance to certain chemotherapeutics7. In another BceSR TCS, the BceS has the ability to sense bacitracin and the response regulator (BceR) positively regulates synthesis of transporters involved in bacitracin resistance process (BceAB and VraDE)21,22. In VanS-VanR TCS, VanS detects the presence of vancomycin and phosphorylates the respective response regulator. VanR (RR) induces expression of genes that contribute to vancomycin resistance23,24.
Potential targets for antimicrobial therapy
Two component systems are potential targets for antimicrobial therapy, as they are used by pathogenic bacteria to control the expression of virulence factors6. Several reasons have led researchers to choose them as targets: TCS are common in bacteria but absent in mammalian organisms, general inhibitors of TCS would be broad-spectrum antibiotics while some could allow for a more selective inhibition.
Antimicrobial resistant infections
Antibiotic resistance has emerged as a global health problem in recent years. At least 50 000 deaths are reported each year in Europe due to antimicrobial resistant infections21.
Staphylococcus aureus (S. aureus) is a gram-positive bacterium that commonly infects the skin,
soft-tissues, bones, joints, lungs and central nervous system. This pathogen expresses many potential virulence factors, such as proteins that promote colonization on the host tissues, factors that inhibit the host phagocytosis, and toxins that damage the host tissues. S. aureus possesses 16 two-component signalling systems21.
Different β-lactam antibiotics were developed against S. aureus infection. Cephalexin, dicloxacillin, vancomycin and methicillin are some of the developed antibiotics successively used against different bacterial infections. Despite their efficiency, different bacterial species have developed resistance to those antibiotics. Methicillin-resistant S. aureus (MRSA) is considered a multidrug resistant bacterium, because methicillin is a highly effective antibiotic against bacterial infections25. MRSA is one of the most common causes of healthcare-associated infections.
Clostridium difficile (C. difficile) is gram-positive spore forming bacterium that is transmitted
20
21
3.
Materials and methods
3.1 DNA cloning of HK targets in pET-52b(+) (Novagen)
General methodologies and reagents
For all solutions and buffer preparations pH was measured using a Sartorius pH meter. Analytic balance (KERN) and Precision balance (KERN) were used. All protocols that include cell manipulation were performed in Laminar flow chamber, Bio II model –A (Telstar). SDS-PAGE was performed using
Mini-PROTEAN©® Tetra cell assembly (Bio-Rad). All restrictions enzymes and buffers were from
New England Biolabs, unless otherwise stated. All absorbance measures at 600 nm (OD600) were measured in a spectrophotometer (Ultrospect 10, Amersham) using non-inoculated media as blank.
Reagents
Acetic acid (glacial) 95,5-100,5% (Carlo Erba)
Acrylamide /Bis-Acrylamide (30%/0,8%w/v) (Alfa Aesar) Agar-Agar (ROTH)
Agarose (CAMBREX) ATP (Jene Bioscience)
Bovine serum albumin - BSA 100x – 10 mg/µl (Biolabs) Carbenicilin (ROTH)
Cloramphenicol (ROTH) Cymal-4 (Affymetrix) C-Hega 8 (Affymetrix) DDM (Glycon)
DM (Glycon) dNTP (X)
DNA polymerase, Phusion High-Fidelity (Thermo Scientific)
DNA purification Kit, Zymocean Gel DNA Recovery Kit (Zymo Research´s) D-Saccharose (ROTH)
EDTA (Calbiochem) Ethanol absolute (ROTH)
Gene Ruller 1Kb 0,5 μg/ml (Thermo Sientific)Sodium Chloride ≥99,5% D=2,17 g/ml (ROTH) Fos-Choline (Anatrace)
Glycerine (ROTH)
His-Probe HRP (Thermo scientific) Imidazole (Merk)
22 LDAO (Anatrace)
Lysozime (Sigma) Mega-8 (Anatrace) Methanol (ROTH)
NEB buffer 4 (1x) – 50 mM Potassium Acetate, 20 mM Tris-acetate, 10 mM Magnesium Acetate, 1 mM DTT pH 7.9 ´
NotI-HF (Biolabs)
N-Octyl-β-D-Glucopyranoside (Affimetrix) N-Octyl- β-D-Thioglucopyranoside (Glycon)
Page RullerTM Plus Prestained Protein (Thermo scientific) Phusion DNA polymerase (Thermo scientific)
Phusion HF Buffer (5x) 75 mM MgCl2 (Thermo scientific)
Plasmid isolation kit, ZR BAC DNA Miniprep Kit (Zymo Research´s)
Plasmid purification kit, Wizard SV Gel and PCR Clean-Up System (Promega) pET-52b(+) (Novagen)
Potassium Chloride ≥ 99,0% D=1,98 g/ml (Sigma)
Primary antibody: Anti-His IgG (Fc Specific)-Alkaine Phosphatase antibody) (GE Healthcare) SacI-HF (Biolabs)
Sodium dodecyl sulphate SDS (ROTH)
Secondary antibody: Anti-Mouse IgG (Fc Specific)-Alkaline Phosphatase conjugated (Sigma Aldrich)
Supersignal West Pico Chemiluminescent Substrate (BioRAD) SYBR Safe (Invitrogen)
Triptone (ROTH)
Tris base ≥ 99,0% (Sigma) Triton X-100 (ROTH) Tween-20 (Merk)
T4 DNA Ligase 1U/µl (Invitrogen) Vircon (Rely+ON)
Western Blot reagent – BCIP/NBT Liquid Substate System (Sigma Aldrich) XmaI (Biolabs)
23
Genomic DNA and targets for Staphylococcus aureus ad Clostridium difficile
Genomic DNA used for cloning was Staphylococcus aureus COL strain and Clostridium
difficile 630 strain. They were kindly provided by Bacterial Cell Biology laboratory (ITQB) and
Microbiology Development laboratory (ITQB), respectively.
The selected S. aureus targets were SrrB gene (KEGG cede SACOL1534, 1752 bp), AgrC gene (KEGG cede SACOL2025, 1293 bp), KinB gene (KEGG cede SACOL0020, 1827 bp), PhoR gene (KEGG cede SACOL1739, 1665 bp), GraS gene (KEGG cede SACOL0717, 1041 bp), Unk gene (KEGG cede SACOL0202, 1557 bp), (attachment A table 5.1). The C. difficile targets were VanS gene (KEGG cede CD630_16250, 1143 bp), SrrB gene (KEGG cede CD630_14650, 1254 bp), Unk gene (KEGG cede CD630_16890, 1233 bp), GraS gene (KEGG cede CD630_15790, 1857 bp), KinB gene (KEGG cede CD630_17830, 1434 bp), SaeS gene (KEGG cede CD630_35990, 1194 bp), BceS gene (KEGG cede CD630_15300, 1005 bp), AgrC gene (KEGG cede CD630_06100, 1338 bp), (Appendix A, table 5.1).
PCR chain reaction of the S. aureus and C. difficile target genes
All targets were amplified by polymerase chain reaction (PCR) (MyCycler TM Thermal Cycler, BioRAD) and cloned into pET-52b(+), which contains a N-terminal Strep•Tag II (cleavable by HRV 3C) and a 10x Histidine affinity tag in the C-terminus (cleavable by Thrombin). The reaction mix include 0.2 μM forward and reverse primers (Appendix A, table 3.2 and 3.3), 100 ng of template DNA, 200 μM dNTPs, 1x Phusion HF buffer and 2.5 U DNA polymerase. The PCR protocol for each target is described in Table 3.1. The size of the amplified genes were confirmed by 0.8% (w/v) agarose gel electrophoresis (Mini Electrophoresis system - VWR), visualized by Transiluminator Safe Imager TM 2.0 (Invitrogen) and purified using Zymoclean Gel DNA Recovery Kit, (Appendix B, protocol nr 1).
Table 3.1 - PCR conditions used for SrrB and AgrC genes of MRSA
Steps Temperature Time 1 Initial denaturation 98ºC 30 sec
2 Amplification (30 cycles)
Denaturation 98ºC 10 sec
Annealing 65ºC 30 sec
Extension 72ºC 1 min 30 sec
3 Final extension 72ºC 7 min
24
Double digestion of pET-52b(+),MRSA SrrB and AgrC
The pET52-b(+) vector, and SrrB and AgrC S. aureus targets were double digested with specific restriction enzymes – XmaI and SacI-HF. SrrB double digestion reaction was prepared using 635 ng DNA insertion, 3 μg BSA, 10 U XmaI and 20 U SacI-HF in 1x NEB buffer 4. AgrC double digestion reaction comprised 419.25 ng DNA insertion, 3 μg BSA 10 U XmaI and 20 U SacI-HF in 1x NEB buffer 4. Double digestion reaction mix of pET-52b(+) comprises 1078,4 ng vector DNA, 3 μg BSA, 10 U XmaI and 20 U SacI-HF in 1x NEB buffer 4.
Samples were incubated in a dry bath (Labnet) for 3h at 37ºC, analyzed by 0.8% (w/v) agarose gel electrophoresis and purified with Zymoclean Gel DNA Recovery Kit. Samples were stored at -20ºC.
Ligation reaction (S. aureusSrrB and AgrC in pet52b(+))
For SrrB ligation reaction 191.5 ng digested DNA insert, 12.3 ng digested vector DNA, 1 U T4 ligase at 1x NEB buffer 4 were mixed. For AgrC ligation reaction 418 ng digested DNA insert, 12,3 digested vector DNA, 1 U T4 ligase at 1x NEB buffer 4 were mixed. Samples were incubated for 3h at 37ºC and transformed into E.coli XL-10.
Competent cell production protocol
One colony of E. coli was selected from the LB agar plate and was inoculated into 10 ml LB broth medium and incubated overnight at 37ºC in the shaker (MaxQ 4000 Barnstead lab-line) at 180 rpm. The pre-inoculum was added to 400 ml of fresh LB medium, incubated at 37ºC, with 180 rpm, until OD600 reached 0.6. Cell culture was placed on ice for 15 min and was centrifuged (JA-14 rotor, Allegra X-12R) at 4000 rpm for 8 min at 4ºC. Next, the pellet was gently ressuspended in 100 ml of ice-cold 100 mM potassium chloride (KCl), 50 mM manganese (II) chloride (MnCl2), 30 mM Potassium acetate (CH3COOK), 10 mM calcium chloride (CaCl2) and 15% glycerol and centrifuged as before. After the second centrifugation, the pellet was gently ressuspended in 20 ml of ice-cold 10 mM 3-(N-morpholino) propanesulfonic acid (MOPS), 10 mM potassium chloride (KCl), 75 mM calcium chloride (CaCl2) and 15% glycerol. Aliquots of 30x200 μl and 10x100 μl were prepared in sterile eppendorf tubes, flash frozen in liquid nitrogen and stored at -80ºC.
Cell Transformation
25 ng of previously prepared DNA (vector with putative insert) were mixed with 100 μl of several
E.coli XL-10 competent cells and incubated on ice for 15 min. Samples were placed in 42ºC dry bath
25
recovered. 150 μl of supernatant were spread on a LB agar plate with a sterilized glass rod supplemented with 100 µg/mL carbenicillin and incubated overnight at 37ºC.
Sequencing
Isolated colonies were chosen for each target and inoculated into 5 ml of LB broth medium with 100 µg/mL of carbenicillin. After 16 h at 37ºC in shaker at 190 rpm, all samples were purified with Zymoclean Gel DNA Recovery Kit. Obtained DNA was cleaved with SacI-HF and XmaI restriction enzymes and analysed by agarose gel (Appendix B, protocol nr 1). Positive colonies were selected and forward and reverse sequencing reaction were performed with 20 μl of plasmid DNA, with a concentration of 50-100 ng/μl. For forward and reverse sequencing reaction, T7 forward (TAATACGACTCACTATAGGG) and T7 reverse (CTAGTTATTGCTCAGCGG) primer were used. STAB VIDA sequencing service was used.
3.2 Expression, solubilization and purification
Expression tests protocols
Plasmids pET52b(+)-SrrB and pET52b(+)-AgrC were transformed into E.coli C43, BL21, BL21 Star and BL21 Gold, using the same protocol described above.One colony of each transformed cell type were inoculated in 50 ml LB broth medium with 100 µg/mL of carbenicillin and incubated overnight at 37ºC at 180 rpm. 500 μl of overnight culture was transferred to 10 ml of media with 1 mg/lcarbenicillin. Different media were tested - LB broth, TB, 2xYT and autoinduction medium. Cells were induced with 0.5 mM Isopropyl-β-D-thiogalactopyranoside (IPTG) when samples reached a specific OD600 (values depended on the media, TB: OD600 ≥ 1; LB: OD600=0.4-0.6; 2xYT: OD600=1; M9: OD600=0.7). Each sample was further incubated at different temperatures (37ºC, 28ºC and 21ºC) during different post-induction times (4h, 6h and overnight) in order to find the best expression conditions. Samples were centrifuged for 20 min at 8000 rpm (Eppendorf 5424R), precipitate was recovered and 40 samples were stored at -80ºC.
Extracting protein from bacteria
Membrane preparation using water lysis protocol (for small scale)
26
dH2O and incubated for 30 min at room temperature. The sample was centrifuged as before and the supernatant was discarded (cytoplasmic fraction). After that, pellet was homogenised in 1 ml of S3 (10 mM Tris-HCl pH 8, 5% glycerol, 1 mM mercaptoethanol).
The results were evaluated by SDS-PAGE and Western Blot (ChemiDoc MP Imager -BioRAD) or In Vision (Scanner Fujifilm fla 5100) techniques (Appendix B, protocol nr 2, 3 and 4).
Membrane preparation using cell disrupter protocol (for large scale)
In alternative to the above, this protocol can be used to disrupt sample of larger volumes, e.g. around 60 ml. Once the cell disruptor is refrigerated, two washing steps were performed, the first with 100 ml of dH2O and the second with 100 ml of buffer, both at 10 kPsi. After that, homogenised cells were passed twice at 27 kPsi and stored on ice. Further washing steps included the passage of 100 ml buffer, followed by 100 ml 1:100 diluted Virkon detergent (1 tablet was dissolved in 500 ml), 100 ml 70% ethanol, 100 ml 20% ethanol and finally 100-200 ml of dH2O addition.
Sample was centrifuged (JA-10/JA-14 rotor, Allegra X-12R) at 8 000 rpm for 20 min at 4ºC and the pellet was discarded. The supernatant was centrifuged (45Ti/70Ti rotor, Ultracentrifuge XL-10) at 40000 rpm for 2 h at 4ºC. The pellet, containing the cell membranes, was stored at -80ºC.
The results were evaluated by SDS-PAGE and Western Blot (ChemiDoc MP Imager -BioRAD) or In Vision (Scanner Fujifilm fla 5100) techniques (Appendix B, protocol nr 2, 3 and 4).
Solubilization tests
Solubilization of total cell membranes (10 mg/ml) was tested at different conditions. Three detergents, DM, DDM and Triton X-100 at 1.5% (w/v) were combined with various salt concentrations, NaCl at 250, 500 and 750 mM in buffer 50 mM Tris-HCl pH=7.5. Solubilization of 2 ml samples was performed during 2 h at 4ºC and, after, the samples were centrifuged (TLA-55 rotor, ultracentrifuge Optima TLX) 30 min at 40 000 rpm at 4ºC. Pellet was homogenised with 2 ml of 50 mM Tris-HCl pH 7.5. The presence of target protein in the pellet and soluble fraction were evaluated by SDS-PAGE and Western Blot (ChemiDoc MP Imager -BioRAD) or In Vision (Scanner Fujifilm fla 5100) techniques (Appendix B, protocol nr 2, 3 and 4).
Inner and Outer Membrane separation by Sucrose Gradient
27
After extracting separately the outer and inner membrane fraction, 20 mM Tris-HCl pH 7.5 was added to each sample in order to decrease EDTA traces. Samples were centrifuged for 2 h at 41 000 rpm at 4ºC using 70Ti rotor. The results were evaluated by SDS-PAGE and Western Blot (ChemiDoc MP Imager -BioRAD) or In Vision (Scanner Fujifilm fla 5100) techniques (Appendix B, protocol nr 2, 3 and 4).
Figure 3.1 - Scheme of sucrose solutions addition in the sucrose gradient
Sucrose gradient solution: x% sucrose, 20 mM Tris-HCl, 50 mM EDTA pH=7.5 (x=55, 50, 45, 40, 35, 30, 25%)
Purification
Protein purification by HPLC
28
Batch purification using magnetic beads (His Mag Sepharose Ni)
An Eppendorf containing magnetic beads was placed in the magnetic rack (MagRack 6) to remove the storage solution. Next, equilibration step was performed by resuspending the beads in 500 μl of binding buffer and subsequent removing. Then 1 ml of solubilized total membrane was added, ressuspended and incubated for 30 min with slow mixing at room temperature. After that, the supernatant was removed and several washing steps were realised. Washing step consist in addition of 500 μl of binding buffer, mixing and subsequent removing. Than elution step were performed using elution buffer (50 mM Tris (Sigma) pH=7.5, 250/500 mM NaCl, 1 M Imidazole, 0.02% DM or DDM) with several imidazole concentrations (20, 40, 60, 80, 500 mM or 20, 100, 250, 500 and 1 000 mM imidazole). 500 μl of each elution buffer was added, mixed, removed and stored to evaluate by SDS-PAGE and Western Blot (ChemiDoc MP Imager - BioRAD) or In Vision (Scanner Fujifilm fla 5100) techniques (Appendix B, protocol nr 2, 3 and 4).
Batch purification
2 ml of Ni Sepharose 6 Fast Flow slurry (GE Healthcare) were placed into a 15 ml falcon tube and sedimented by centrifugation (Eppendorf 5424R) at 500 xg for 5 min at 4ºC. Supernatant was discarded, replaced with distilled water and centrifuged at 500 xg for 5 min at 4ºC. This step was repeated 2 times. After washing, the matrix were ressuspended in a specific binding buffer for equilibration. After centrifugation, total membrane fraction previously solubilized was added and incubated at 4ºC overnight under mild agitation.
29
4.
Results and Discussion
4.1 DNA cloning of HK targets in pET-52b(+)
Histidine kinases are complex and difficult proteins to study. To increase our chances of success, several HK targets were cloned in pET-52b(+).
Cloning of AgrC and SrrB from S. aureus
The first targets were AgrC and SrrB HK´s. PCR was performed has described in Materials and Methods, and the results were analysed by 0.8% agarose gel. Figure 4.1 shows single bands in the gel, indicative of the high specificity from the designed primers. AgrC gene size is 1250 bp, and from the band location in the agarose gel (between 1500 bp and 1000 bp of DNA ladder), we concluded that the observed band corresponds to AgrC target. The same conclusion was obtained for the SrrB gene, 1749 bp in size, the band is located between 2000 bp and 1500 bp. The chosen targets were successfully amplified.
Figure 4.1 - 0.8% agarose gel. PCR results for AgrC and SrrB genes. Lanes: L - GeneRulerTM 1 kb DNA ladder; all bands correspond to 50 µl of putative amplified AgrC and SrrB genes.
30
Figure 4.2 - 0.8% agarose gel. PCR results for AgrC and SrrB genes. Lanes: L - GeneRulerTM 1 kb DNA ladder; all bands correspond to 50 µl of putative amplified AgrC and SrrB genes.
Despite a stronger intensity in the gel, DNA concentration was lower than previous experiments. AgrC concentration was 10.5 ng/μl and SrrB was 10 ng/μl. Operator error or kit contamination are possible explanations for such lower concentration.
The following step consisted in the double digestion experiment of amplified DNA targets using the PCR product with higher concentration (AgrC 21.3 ng/µl and SrrB 16.4 ng/µl). Results are presented in a figure 4.3. AgrC and SrrB bands were extracted from the gel and DNA was purified. At the same time, pET-52b(+) double digestion was performed (figure 4.4).
Figure 4.3 - 0.8% agarose gel. Double digestion results for AgrC and SrrB genes. Lanes: L - GeneRulerTM 1 kb DNA ladder; all bands correspond to 30 µl of putative amplified AgrC and SrrB genes.
31
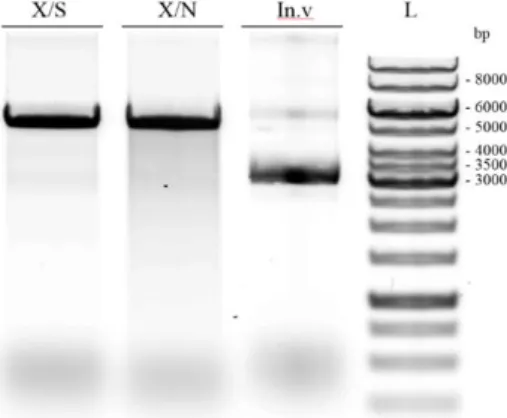
Figure 4.4 - 0.8% agarose gel. Results of pET-52b(+) double digestion. Lanes: X/S –digestion with XmaI and SacI-HF; X/N –digestion with XmaI and NorI; In.v – intact pET-52b(+), L- GeneRulerTM 1 kb DNA ladder. pET-52b(+) digested with XmaI and SacI-HF, or with XmaI and NotI-HF, are located between 6 kbp and 5 kbp. Intact pET-52b(+) is located around 3 kbp band. When digested, the vector is an opened ring, and its conformation interferes with running through the agarose gel – running is slower comparing to a non-digested vector. Intact vector exhibits a more compact conformation (supercoiled) and runs faster. Such characteristic explains the difference around 3 kbp between digested (Figure 4.4, lanes X/S and X/N) and non-digested vector bands (Figure 4.4, lane In.V). The double digestion was successful.
After double digestion procedure, we proceeded to ligation reaction and transformation into
E.coli XL-10. No colonies have appeared which means that cloning was unsuccessful. The problem may
reside in the double digestion reaction – one of the enzymes might be nonfunctional. In order to check this hypothesis, pET-52b(+) was digested with XmaI and SacI-HF separately.
Figure 4.5 - 0.8% agarose gel. Results of pET-52b(+) double digestion. Lanes: SacI –digestion with SacI-HF; XmaI –digestion with XmaI; In.v – intact pET-52b(+), L- GeneRulerTM 1 kb DNA ladder.
32
Gel DNA Recovery Kit (Zymo Research). PCR experiments were performed using product from 1st PCR (Figure 4.6).
Figure 4.6 - 0.8% agarose gel. PCR results for AgrC and SrrB genes. Lanes: L - GeneRulerTM 1 kb DNA ladder; all bands correspond to 50 µl of putative amplified AgrC and SrrB genes.
DNA was extracted from the agarose gel and concentration was measured. AgrC concentration was 64.5 ng/µl and SrrB was 97.7 ng/µl, confirming that previous cloning experiments failed because of contaminated DNA gel extraction kit. Polymerase chain reaction was followed by double digestion (figure 4.7). After gel extraction, concentration of SrrB and AgrC targets were 38.8 ng/µl and 34.5 ng/µl, respectively.
Figure 4.7 - 0.8% agarose gel. Double digestion results for AgrC and SrrB genes. Lanes: L - GeneRulerTM 1 kb DNA ladder; all bands correspond to 30 µl of putative amplified AgrC and SrrB genes.
33
Figure 4.8 - 0.8% agarose gel. Results of SrrB vector double digestion. Lanes: SrrB1 – colony nº1, SrrB2 – colony nº2, L- GeneRulerTM 1 kb DNA ladder, SrrB3 – colony nº3, SrrB4 – colony nº4.
Positive colonies hold a band around 2 000 bp that corresponds to SrrB insert (1749 bp). All other two bands will correspond to pET-52b(+) (located between 8 kbp and 5 kbp ladder bands). Negative colonies (SrrB2 and SrrB4) present just one band (between 6 kbp and 5 kbp) that corresponds to the vector without DNA insert. In figure 4.9, AgrC double digestion results are presented. AgrC1 and AgrC3 colonies were selected, because they present a band located between 1500 bp and 1000 bp that corresponds to AgrC insert (1250 bp).
Figure 4.9 - 0.8% agarose gel. Results of AgrC vector double digestion. Lanes: AgrC1 – colony nº1, AgrC2 – colony nº2, AgrC3 – colony nº3, L- GeneRulerTM 1 kb DNA ladder, AgrC4 – colony nº4, AgrC5 – colony nº5.
34 Cloning of other S. aureus and C. difficile targets
More HK targets were chosen for the cloning into pET-52b(+), S. aureus targets were: KinB (1827 bp), GraS (1041 bp), PhoR (1665 bp)and Unk (1557 bp); and C. difficile targets were: SaeS (1194
bp), BceS (1005 bp), AgrC (1338 bp), SrrB (1254 bp), KinB (1434 bp), GraS (1857 bp), Unk (1233 bp)
and VanS (1143 bp). 1st PCR results are presented in the figure 4.10 and 4.11.
Figure 4.10 - 0.8% agarose gel. PCR results of S. aureus (KinB, GraS, PhoR and Unk) and C. difficile (SaeS, BceS, AgrC and SrrB) genes. Lanes: L- GeneRulerTM 1 kb DNA ladder; all band correspond to 50 µl of putative amplified genes.
Figure 4.11 - 0.8% agarose gel. PCR results of C. difficile (KinB, GraS, Unk and VanS) genes. Lanes: L- GeneRulerTM 1 kb DNA ladder; all bands correspond to 50 µl of putative amplified genes.
All samples contain one single band, except C. difficile AgrC sample (Figure 4.10), where amplification was unsuccessful (no band). For targets with positive amplified genes, bands were extracted from gel as previously described and concentrations were measured. Concentrations of S. aureus target gene were [KinB]= 177.5 ng/µl, [GraS]=13.2 ng/µl, [PhoR]=74.4 ng/µl and [Unk]=56.9 ng/µl and concentrations of C. difficile targets were [SaeS]= 96.6 ng/µl, [BceS]=19.5 ng/µl, [SrrB]=65.2 ng/µl, [KinB]=93.3 ng/µl; [GraS]=4.8 ng/µl, [Unk]=36.4 ng/µl and [VanS]=107.7 ng/µl. Some targets, namely S. aureus GraS and
C. difficile BceS and GraS present low DNA concentrations. C. difficileAgrC target didn’t present any