ISSN 0104-6632 Printed in Brazil
www.abeq.org.br/bjche
Vol. 28, No. 01, pp. 1 - 8, January - March, 2011
Brazilian Journal
of Chemical
Engineering
METHANOGENIC POTENTIAL AND MICROBIAL
COMMUNITY OF ANAEROBIC BATCH
REACTORS AT DIFFERENT
METHYLAMINE/SULFATE RATIOS
D. V. Vich
1*, M. L. Garcia
2and M. B. A. Varesche
11
Laboratório de Processos Biológicos, (LPB), Departamento de Hidráulica e Saneamento, Escola de Engenharia de São Carlos, (EESC), Phone: + (55) (16) 3373-8358, Fax: + (55) (16) 3373-9550, Universidade de São Paulo, (USP), Engenharia Ambiental-Bloco 4-F,
Av. João Dagnone 1100, Santa Angelina, CEP: 13.563-120, C. P. 359, São Carlos - SP, Brasil. E-mail: [email protected], *[email protected]
2
Departamento de Petrologia e Metalogenia, Universidade Estadual Paulista Julio de Mesquita Filho, (UNESP), Phone: + (55) (19) 3526-2829, Avenida 24-A, 1515, Bela Vista, CEP: 13506-900, C. P. 178, Rio Claro - SP, Brasil.
E-mail: [email protected]
(Submitted: April 9, 2010 ; Revised: June 13, 2010 ; Accepted: June 29, 2010)
Abstract - Methylamine and sulfate are compounds commonly found in wastewaters. This study aimed to determine the methanogenic potential of anaerobic reactors containing these compounds and to correlate it with their microbial communities. Batch experiments were performed at different methylamine/sulfate ratios of 0.71, 1.26 and 2.18 (with respect to mass concentration). Control and experimental runs were inoculated with fragmented granular sludge. The maximum specific methane formation rates were approximately 2.3 mmol CH4 L
-1
g TVS-1 day-1 for all conditions containing methylamine, regardless of sulfate addition. At the end of the experiment, total ammonium-N and methane formation were proportional to the initial concentrations of methylamine. In the presence of methylamine and sulfate, Firmicutes (46%),
Deferribacteres (13%) and Proteobacteria (12%) were the predominant phyla of the Bacteria domain, while
Spirochaetes (40%), Deferribacteres (17%) and Bacteroidetes (16%) predominated in the presence of methylamine only. There was no competition for methylamine between sulfate-reducing bacteria and methanogenic archaea.
Keywords: Anaerobic process; Methylamine; Sulfate reduction; Methane formation; Microbial community.
INTRODUCTION
Methylamine is an organic compound with a molecular weight of 31.1 g.mol-1, boiling point of -6,32°C (760 mmHg) and characteristic unpleasant odor at concentrations up to 100 ppm. It is introduced into the environment through several industrialized processes. It is mainly used as an intermediate in organic synthesis, water gel explosives, accelerators, pharmaceuticals, insecticides, herbicides, plasticizers, N-methylpyrrolidine, methylalkanolamines, surface
compound to be studied, representing a variety of chemical classes.
Methanogenesis from methylamine yields carbon dioxide (CO2), methane (CH4) and ammonia (NH3). In pure cultures, the ratio of product formation is 1:3 for CO2 and CH4, respectively, as indicated by reaction 1. Unionized free ammonia is also produced in the conversion of methylamine to methane (Sossa
et al., 2004), which can be an important element when representing mass balances of the anaerobic process.
3 2 2 4 2 3
4 CH NH +2 H O→3 CH +1 CO +4 NH (Reaction 1)
Methylotrophy, the metabolism of microorganisms that consume organic compounds containing no carbon-carbon bonds (C1 compounds), such as methane, methanol and methylated amines, is an important part of the global carbon cycle on Earth (Kalyuzhnaya et al., 2008). With respect to the Bacteria domain, methylotrophic ability is especially widespread within the Proteobacteria phylum, encompassing the alpha, beta and gamma subdivisions (Hanson and Hanson, 1996, Kalyuzhnaya et al., 2006). Within the methanogenic archaea, the order Methanosarcinales contains species with the most versatile substrate spectrum, including microorganisms that are able to grow on methylotrophic substrates such as methanol or methylamines as their sole carbon and energy sources (Deppenmeier et al., 1999).
To our knowledge, there are few studies of methylamine removal through biological processes. Because methylamine removal efficiencies can be extremely high and energy recovery can be practiced, anaerobic digestion can be an advantageous alternative. The process stability might be negatively affected in the presence of sulfate, which is often found in wastewaters. This work aimed to determine the influence of sulfate at different concentrations on the specific methane production rate and the microbial community structure of anaerobic batch reactors containing methylamine.
MATERIALS AND METHODS
Granular sludge from an Upflow Anaerobic Sludge Blanket (UASB) reactor treating poultry wastes (Dacar, Tietê, SP, Brazil) was used as an inoculum in batch reactors containing [mg L-1]: NH4Cl [500], MgCl2.6H2O [400], KH2PO4 [100], CaCl2.2H2O [50], Tritriplex [45], FeSO4.7H2O [5.56], MnSO4.H2O [0.86], CoCl2.6H2O [1.7], ZnSO4.7H2O [2.1], H3BO3 [1.9], NiCl2 [0.2],
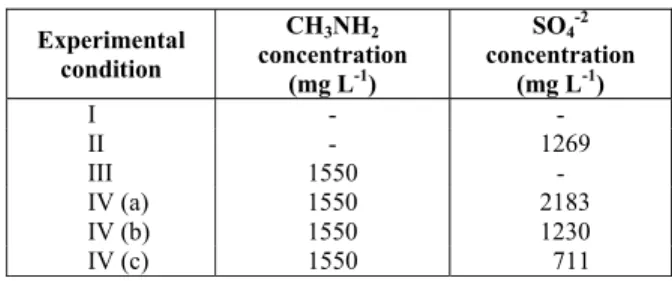
Na2MoO4 [0.1], NaHCO3 [1000], biotin [0.02], folic acid [0.02], thiamine HCl [0.05], riboflavin [0.05], niacin [0.05], calcium pantothenate [0.05], pyridoxine HCl [0.1], vitamin B12 [0.001], Na2S.9H2O [500] and methylamine [1550] (Touzel and Albagnac, 1983; Zinder et al., 1984). The reactors were mounted in 2000 mL bottles, with 1000 mL of reaction volume and 1000 mL of headspace, which was initially filled with helium gas (He, 100%). The experiments were performed in triplicate. Control conditions were set up as follows: I. no sulfate and no methylamine; II. no methylamine and sulfate addition; III. no sulfate and methylamine addition. Methylamine/sulfate experiments (IV) were designed with the following mass concentration ratios: 0.71 (a), 1.26 (b) and 2.18 (c) (Table 1).
Table 1: Methylamine and sulfate concentrations added to the anaerobic batch reactors.
Experimental condition
CH3NH2 concentration
(mg L-1)
SO4-2 concentration
(mg L-1)
I - -
II - 1269
III 1550 -
IV (a) 1550 2183
IV (b) 1550 1230
IV (c) 1550 711
Before inoculating the reactors, the sludge was previously washed, fragmented and kept under nitrogen (N2, 100%) flow. Throughout the experiments, the gas pressure in the headspace of the experimental bottles was not released. Incubation was performed by using a shaker at a stirring speed of 150 rpm and a heater at the temperature of 30±1°C.
Methanogenic Potential and Microbial Community of Anaerobic Batch Reactors at Different Methylamine/Sulfate Ratios 3
specific methane production rate was determined from the average mass of biomass in each reactor (g of total volatile solids – TVS).
Total ammonium-N (NH4+-N), sulfate (SO42-), sulfide (S2-) and TVS concentrations were quantified according to the Standard Methods for the Examination of Water and Wastewater (2005).
The microbial community present in the anaerobic batch reactors was analyzed by partial sequencing of the 16 subunit ribosomal RNA gene (16S rRNA). The total genomic DNA was extracted according to Melvin and Hobson (1994). For the Polymerase Chain Reaction (PCR), universal primers for Bacteria domain 27F and 1100R were used (Lane, 1991). The PCR products were purified with Illustra® GFX® kit (GE Healthcare®). Cloning was performed with pGEM® Easy Vector System I, according to the manufacturer's specifications. Samples were sequenced in the automatic sequencer ABI Prism® 310 (Applied Biosystem®). The sequences obtained were verified with the software DNAstar® (Lasergene® Sequence Analysis), aligned within the Greengenes NAST aligner (http://greengenes.lbl.gov/cgi-bin/nph-NAST_align.cgi) and phylogenetically analyzed with the software ARB (Ludwig et al., 2004).
RESULTS AND DISCUSSION
With respect to the control experiments, the methane concentrations were higher in the methylamine- and sulfate-free tests (~6 mmol CH4 L-1; Figure 1(a)) compared to the methylamine-free and
sulfate-containing reactors (~2 mmol CH4 L-1; Figure 1(b)). This was anticipated because it is well established that sulfate, when present in anaerobic media, creates a competition for substrate by acting as the final electron acceptor in the anaerobic respiration reaction.
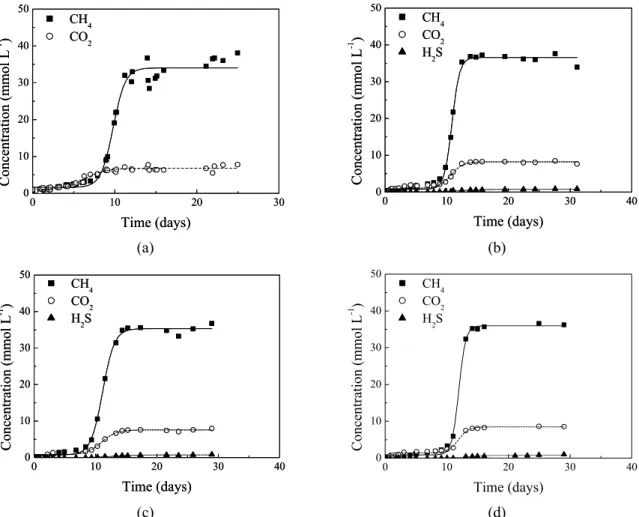
The highest headspace concentrations of CH4 and CO2 were of the same order of magnitude in the reactors that received methylamine as carbon source, regardless of the presence of sulfate and its concentration. The concentrations of CH4 and CO2 were approximately 36 and 8 mmol L-1, respectively (Figure 2 (a), 2 (b), 2 (c) and 2 (d)) in the reactors containing methylamine (with or without sulfate). Unlike the control cases (Figures 1 (a) and 1 (b)), the addition of sulfate in the process did not affect the highest produced methane concentration when methylamine was used as the sole carbon source. This indicates that methane-producing organisms and sulfate-utilizing organisms do not compete for methylamine, which is quite interesting because it makes anaerobic digestion of methylamine even more robust.
The maximum methane production rates were 13.16±0.61, 13.41±1.80, 11.65±0.44 and 14.24±0.028 mmol CH4 L-1 day-1 for the control (with methylamine and without sulfate) and for methylamine/sulfate ratios of 0.71, 1.26 and 2.18, respectively (Table 2). For these ratios, maximum specific methane production rates were 2.14±0.31, 2.41±0.27, 2.26±0.25 and 2.54±0.10 mmol CH4 L-1 g TVS -1 day -1, respectively (Table 2). These results were not statistically significantly different from each other (ANOVA: p = 0.46, F = 0.98; Fcrit = 4.76).
0 10 20 30
0 1 2 3 4 5 6 7
a
Co
nce
n
tratio
n (mmol
L
-1 )
Time (days) CH
4
CO
2
0 10 20 30
0 1 2 3 4 5 6 7
a
Co
nce
n
tratio
n (mmol
L
-1 )
Time (days) CH
4
CO
2
0 10 20 30 40
0 1 2 3
b
CH4 CO2 H2S
Co
nc
ent
rati
o
n
(mmol
L
-1 )
Time (days)
0 10 20 30 40
0 1 2 3
b
CH4 CO2 H2S
Co
nc
ent
rati
o
n
(mmol
L
-1 )
Time (days)
(a) (b) Figure 1: Concentration of CH4, CO2 and H2S (mmol L-1) over time (days) in the control reactor (a) without
0 10 20 30 0 10 20 30 40 50 a Co nce n tratio n (mmol L -1 ) Time (days) CH4 CO2
0 10 20 30
0 10 20 30 40 50 a Co nce n tratio n (mmol L -1 ) Time (days) CH4 CO2
0 10 20 30 40
0 10 20 30 40 50 b CH4 CO2 H2S
Conc entratio n (mmo l L -1 ) Time (days)
0 10 20 30 40
0 10 20 30 40 50 b CH4 CO2 H2S
Conc entratio n (mmo l L -1 ) Time (days) (a) (b)
0 10 20 30 40
0 10 20 30 40 50 c CH4 CO2 H2S
Conc entration (mmo l L -1 ) Time (days)
0 10 20 30 40
0 10 20 30 40 50 c CH4 CO2 H2S
Conc entration (mmo l L -1 ) Time (days)
0 10 20 30 40
0 10 20 30 40 50 d CH4 CO2 H2S
Con
cen
tratio
n (mmol L
-1 )
Time (days)
0 10 20 30 40
0 10 20 30 40 50 d CH4 CO2 H2S
Con
cen
tratio
n (mmol L
-1 )
Time (days)
(c) (d) Figure 2: Concentration of CH4, CO2 and H2S (mmol L-1) over time (days) in the control reactor with methylamine
only (a) and in the reactors with different methylamine/sulfate ratios (b) 0.71; (c) 1.26 and (d) 2.18): (■, ○, ▲) experimental data; (—, ----, -·-·-) data for CH4, CO2 and H2S production fit by the Boltzmann model.
Table 2: Methane production rates and total volatile solids concentration
Experimental condition MPRCH4
(mmol L-1 dia-1)
MSPRCH4
(mmol L-1 g TVS-1 day-1)
TVS (g L-1)
I 0.21±0.0017 0.045±0.0022 4.63
II 0.26±0.0037 0.05±0.0042 4.92
III 13.16±0.61 2.14±0.31 6.19
IV (a) 13.41±1.80 2.41±0.28 5.28
IV (b) 11.65±0.44 2.26±0.25 5.12
IV (c) 14.24±0.028 2.54±0.14 5.31
Legend: MPRCH4 - maximum methane production rate; MSPRCH4 - maximum specific methane production rate;
TVS – total volatile solids; values represent mean and standard deviation.
The pH decreased significantly during the tests at the different methylamines/sulfate ratios (Table 3). Due to the addition of methylamine (electron donor), the CO2 concentrations, ~8 mmol L-1 (Figures 2 (a), 2 (b), 2 (c) and 2 (d)), were higher than the CO2 concentrations in the control, ~2 mmol L-1 (without addition of methylamine) (Figures 1 (a) and 1 (b)). The accumulation of CO2 in the tests was responsible for the further decrease of pH. Because the
Methanogenic Potential and Microbial Community of Anaerobic Batch Reactors at Different Methylamine/Sulfate Ratios 5
methylamine and sulfate (data: TOT-S-2=[H2S]+[HS-] +[S2-]; pKa1 = 6.99 and pKa2 = 12.92; HH2S = 0.4 L/L; TOT-S-2 = 0.00469 mol L-1 [Figure 3 (b)]; [H2S]aq = 0.0025 mol L-1 [Figure 2 (b), 2 (c), and 2 (d)]). The theoretical pH was found to be 6.94, while the measured pH was ~7.14 (Table 3). Even though the theoretical and measured pH values are similar, the biological phenomena involved in determining the final measured pH are too complex. If we consider CO2 formation and its aqueous chemistry, the theoretical pH could be even lower than the
predicted one. This is balanced out by the added buffer compounds and others, such as ammonia, that are produced during the biological reactions.
Total ammonium-N (Figure 4) and sulfide (Figure 3 (b)) were produced during the experiment. The final concentration of total ammonium-N was around 1100 mg NH4+-N L-1 for all methylamine/sulfate ratios, substantiating the process represented by reaction 1. Control reactors (without methylamine as a source of C and N) had a concentration of ammonium of ~300 mg NH4+-N L-1.
Table 3: Initial and final pH for the different methylamine/sulfate ratios
Control
(no methylamine) 0.71 1.26 2.18
Initial pH 8.92±0.08 8.92±0.07 8.97±0.02 8.94±0.13
Final pH 7.67±0.09 7.08±0.04 7.14±0.04 7.19±0.05
Values represent mean and standard deviation.
0 10 20 30 40 50 60 70 80
0 400 800 1200 1600 2000 2400
a
Su
lfa
te c
onc
entration
(mg L
-1 )
Time (days)
0 10 20 30 40 50 60 70 80
0 400 800 1200 1600 2000 2400
a
Su
lfa
te c
onc
entration
(mg L
-1 )
Time (days)
0 10 20 30 40 50 60 70 80
0 50 100 150 200 250 300
b
S
u
lfide concentration (mg L
-1 )
Time (days)
0 10 20 30 40 50 60 70 80
0 50 100 150 200 250 300
b
S
u
lfide concentration (mg L
-1 )
Time (days)
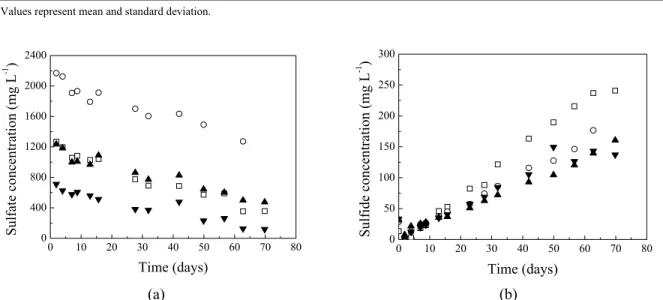
(a) (b) Figure 3: Concentration of sulfate (a) and sulfide (b) over time in the anaerobic batch reactors: □ – control
(without methylamine and with sulfate); ○ - 0.71; ▲ - 1.26 e ▼ - 2.18.
0 10 20 30 40 50 60 70 80
0 200 400 600 800 1000 1200 1400
NH
4
+ -N
concentra
tion (mg L
-1 )
Time (days)
Sulfide concentrations values were about 150 mg L-1 in the reactors subjected to different sulfate concentrations, regardless of the methylamine/sulfate ratio. Control reactors (without methylamine and with sulfate) achieved an average sulfide concentration of 241 mg L-1 (Figure 3 (b)). According to these results, it is possible to infer that methanogenesis was favored by the addition of methylamine and that a negative effect on sulfidogenesis occurred, possibly due to methylamine inhibition of sulfate-consuming microorganisms and/or scavenging of free protons (H+) to form ammonium and methane by acetoclastic methanogens.
The control reactors with sulfate (without methylamine) consumed 71.9% of the added sulfate (1269 mg L-1). The reactors with methylamine/sulfate ratios of 0.71, 1.26 and 2.18 consumed 41.3%, 61.6% and 83.2% of all the sulfate added, for sulfate concentrations of 2183, 1230 and 711 mg L-1, respectively (Figure 3 (a)). These percentages reveal greater efficiencies of consumption of sulfate when it is present at lower concentrations.
The microscopic analysis confirmed the similarity of the morphologies that are expected to be present in the reactors containing methylamine (Vich, 2006).
Microorganisms similar to those belonging to the
Methanosarcinales family were the representative ones for the Archaea domain (Figure 5(c)). The
Bacteria domain was represented by rods and cocci-rods (Figure 5 (b)), cocci (Figure 5(a)), and filaments (Figure 5 (d)).
For the control reactors fed with methylamine and without addition of sulfate, the microbial community structure related to the Bacteria domain was mainly represented by the phyla Spirochaetes (40%),
Deferribacteres (17%) and Bacteroidetes (16%) (Figure 6 (a)). The phyla Firmicutes (46%),
Deferribacteres (13%) and Proteobacteria (12%) were predominant in the reactor containing methylamine and sulfate at the ratio of 1.26 (Figure 6 (b)). Despite this shift of populations in the bacterial community that resulted from the addition of sulfate, methane production did not change in the tests with addition of sulfate. It should be pointed out that the phylum Proteobacteria was enriched by sulfate addition (from 5 to 12%), which is in agreement with the literature (Hanson and Hanson, 1996; Kalyuzhnaya et al., 2006); the Proteobacteria
phylum contains species capable of converting methylotrophic substrates.
(a) (b)
(c) (d) Figure 5: Phase contrast microscopy of the anaerobic batch reactor biomass (methylamine/sulfate ratio of 1.26):
Methanogenic Potential and Microbial Community of Anaerobic Batch Reactors at Different Methylamine/Sulfate Ratios 7
Spirochaetes 40%
Deferribacteres 17% Bacteroidetes
16% Firmicutes
5%
Others 5%
Chloroflexi 9% Proteobacteria
5%
Unclassified 3%
Spirochaetes 4%
Deferribacteres 13%
Thermotogae 9%
Firmicutes 46% Others
9%
Chloroflexi 6%
Proteobacteria 12% Unclassified
1%
(a) (b) Figure 6: Bacterial community structure in the control reactor with methylamine and without sulfate (a) and in
the reactor with a methylamine/sulfate ratio of 1.26 (b).
Sarti (2007) analysed the granular sludge used in our work by the Fluorescent in situ Hybridization
(FISH) technique. The sludge was sampled from an Upflow Anaerobic Sludge Blanket (UASB) reactor treating poultry wastes (Dacar, Tietê, SP, Brazil), which contained sulfate (there is no information on the presence of methylamine in this digester). The microbial population distribution within a biomass sample was 49.8%, 56.7% and 27.9% for the FISH probes EUB338 (Bacteria), ARC915 (Archaea) and BRS385 (sulfate-consuming bacteria), respectively. These percentages represent a sludge with high methanogenic potential and it might have facilitated methylamine removal from the media, as the methane production seems to be driven predominantly by methanogenic activity because: i. the bacterial community changed, but the methane production did not; ii. total ammonium-N and methane formation obeyed methanogenic stoichiometric levels (reaction 1). For instance, the theoretical methane and total ammonium-N concentrations formed from methylamine consumption at a concentration of 1550 mg L-1 (1-L reaction and headspace volumes) are approximately 37 mmol L-1 and 700 mg N L-1, respectively. We found methane and total ammonium-N production values of ~36 mmol/L (Figures 2 (a), 2 (b), 2 (c), and 2 (d)) and ~800 mg N L-1 (Figure 4) (difference between experimental conditions II and IV [(a), (b), and (c),]), respectively. If methylamine-consuming bacterial activity were high, which might have been the case if a much longer adaptation time had been allowed, it is likely that methane formation would decrease with increasing sulfate concentrations.
CONCLUSIONS
The addition of sulfate inhibited the production of methane only in the control reactors without addition of methylamine. In the presence of methylamine, the addition of different concentrations of sulfate did not influence the production of methane, even though the bacterial community structures were altered, indicating that methanogenic archaea and sulfate-reducing bacteria did not compete for this source of carbon and that bacterial methylamine degradation does not occur to a significant extent.
REFERENCES
APHA-AWWA-WPCF, Standard Methods for the Examination of Water and Wastewater. 20th ed. American Public Health Association/American Water Works Association/Water Environment Federation, Washington, DC, USA (2005).
Deppenmeier, U., Lienard, T., Gottschalk, G., Novel Reactions Involved in Energy Conservation by Methanogenic Archaea. FEBS Letters, 457, 291-297 (1999).
Hanson, R. S., Hanson, T. E., Methanotrophic Bacteria. Microbiological Reviews, 60, 437-471 (1996).
Systematic and Evolutionary Microbiology, 56, 2819-2823 (2006).
Kalyuzhnaya, M. G., Lapidus, A., Ivanova, N., Copeland, A. C., McHardy, A. C., Szeto, E., Salamov, A., Grigoriev, I. V., Suciu, D., Levine, S. R., Markowitz, V. M., Rigoutso, I., Tringe, S. G., Bruce, D. C., Richardson, P. M., Lidstrom, M. E., Chistoserdova, L., High-Resolution Metagenomics Targets Specific Functional Types in Complex Microbial Communities. Nature Biotechnology, 26, no. 9, 1029-1034 (2008).
Lane, D. J., 16S/23S rRNA Sequencing in Nucleic Acid Techniques. John Wiley and Sons Inc., New York (1991).
Ludwig, W., Strunk, O., Westram, R., Richter, L., Meier, H., Yadhukumar, A.,Buchner, T., Lai, S., Steppi, G., Jobb, G., ARB: A Software Environment for Sequence Data. Nucleic Acids Research, 32, 1363-1371 (2004).
Melvin, A. N. W. T., Hobson, P. P., Identification of Anaerobic Digester Bacteria Using Polimerase Chain Reaction Method. Bioresource Technology, 47, 73-80 (1994).
Sarti, E. L., Oxygen Influence on Methanogenic Archaea and Sulfate Reducing Bacteria's Growth
in Anaerobic Batch Reactors. M.Sc. Thesis, University of São Paulo (2007).
Sossa, K., Alarcón, M., Aspé, E., Urrutia, H., Effect of Ammonia on the Methanogenic Activity of Methylaminotrophic Methane Producing Archaea
Enriched Biofilm. Anaerobe, 10, 13-18 (2004). Thauer, R. K., Biochemistry of Methanogenesis: a
Tribute to Marjory Stephenson: 1998 Marjory Stephenson Prize Lecture. Microbiology, 144, 2377-2406 (1998).
Touzel, J. P., Albagnac, G., Isolation and Characterization of Methanococcus mazei Strain MC3. FEMS Microbiology Letters, 16, 241-245 (1983).
Vich, D.V., Methanogenic Activity and Microbial Community Involved in the Degradation of Methylamine. M.Sc. Thesis, University of São Paulo (2006).
Yaws, C. L., Matheson Gas Data Book. 7th Ed. McGraw-Hill, New York (2001).