ISSN 0104-6632 Printed in Brazil
www.abeq.org.br/bjche
Vol. 28, No. 01, pp. 89 - 94, January - March, 2011
Brazilian Journal
of Chemical
Engineering
PRECIPITATION OF AMORPHOUS SiO
2
PARTICLES AND THEIR PROPERTIES
S. Musi
ć
1*, N. Filipovi
ć
-Vincekovi
ć
1and L. Sekovani
ć
21
Ruđer Bošković Institute, Phone: + 385 1 4561 094, Fax: + 385 1 4680 107, P.O. Box 180, HR-10002 Zagreb, Croatia.
E-mail: [email protected]
2
Faculty of Geotechnical Engineering, University of Zagreb, Varaždin, Croatia.
(Submitted: April 20, 2010 ; Revised: September 23, 2010 ; Accepted: October 5, 2010)
Abstract - The experimental conditions were optimized for the synthesis of amorphous SiO2 particles by the
reaction of neutralization of sodium silicate solution with H2SO4 solution. Amorphous SiO2 particles were
characterized by XRD, FT-IR, FE-SEM, EDS and microelectrophoresis. The amorphous peak was located at
2θ = 21.8o in the XRD pattern. Primary SiO2 particles were ~ 15 to ~ 30 nm in size and they aggregated into
bigger particles. Amorphous SiO2 particles showed a specific surface area up to 130 m
2
g-1, dependent on the
parameters of the precipitation process. The EDS spectrum of amorphous SiO2 particles did not show
contamination with sulfate or other ions, which cannot be excluded in traces. pHzpc =1.7 was obtained by
microelectrophoresis.
Keywords: Precipitated SiO2; XRD; FT-IR; FE-SEM; EDS; Microelectrophoresis
INTRODUCTION
Precipitated SiO2 (silica) has found various
applications as filler in rubber and plastics, absorbent, drying powder, substrate for catalysts, anticorrosion
agent, etc. Generally, precipitated SiO2 can be
produced by mixing of aqueous solutions of sodium metasilicate and a mineral acid (Winyall, 1984). For example, Schlomach and Kind (2004) precipitated silica by simply adding 50% sulphuric acid into sodium metasilicate solution. The primary silica particles had a uniform size at 22.7 nm. Jesionowski (2002) investigated the precipitation of silica from sodium metasilicate solution using hydrochloric acid. Nonionic surfactants, polydisperse mono(4-nonylphenyl)polyoxyethylene glycol ethers were used as emulsifiers. Spherical silica particles were obtained by using the ultrasonic bath. The precipitated silica had a specific surface area in the interval of 120-260 m2/g. Also, Jesionowski (2001) investigated precipitation of silica from sodium metasilicate and sulfuric acid in
emulsions. Cai et al. (2009) used carbon dioxide to precipitate silica from sodium metasilicate solution.
The size of the aggregated SiO2 particles obtained by
dynamic light scattering was about 160 nm. The production of nanofibrillar silica (amorphous) from natural chrysotile asbestos was also investigated. (Wang et al. 2006; Liu et al.2007).
The properties of precipitated SiO2 depend
strongly on the conditions of its synthesis, such as the synthesis temperature, time of precipitation, pH, addition of coagulant, and modes of washing and
drying. These factors influence the size of the SiO2
particles, their aggregation and specific surface area. The optimization of the properties of precipitated SiO2 is not an easy task.
In the present work we focus on the precipitation
of amorphous SiO2. The optimization of the
synthesis factors was achieved, so that precipitated
SiO2 produced as described in the present work can
EXPERIMENTAL
Synthesis of Precipitated SiO2
The commercial aqueous solution of sodium silicate (water glass) having a chemical composition
in the range 7.8 – 8.5% Na2O, 24.8 – 27% SiO2, 64 –
67% H2O, and specific weight 1.35 – 1.36 g mL-1
was used. After filtration, the sodium silicate solution was diluted in distilled water in the ratio of
1:4 by volume. A concentrated H2SO4 solution was
diluted in distilled water in the ratio of 1:10 by
volume. This H2SO4 solution was used to neutralize
the silicate component by addition at a constant speed and strong mixing of the precipitation system using a high energy disperser. The speed of adding
the dilute H2SO4 solution depended on the
temperature. In the temperature interval of 80-90°C,
the speed of adding H2SO4 was 120 - 50 min. The
dilute H2SO4 solution was added up to pH 9 - 9.5.
The pH was measured at room temperature. At this pH and a temperature of 80-90°C, the precipitated system was additionally heated for 42 - 17 min. This was followed by cooling the precipitated system to
room temperature. Then, dilute H2SO4 solution was
added up to pH 5.5. At this pH, NaCl solution was added over 30 min. The concentration of NaCl varied between 1 and 5 g/L of the reaction mixture.
Coagulated SiO2 was separated from the mother
liquor and subsequently washed with distilled water until there was a negative reaction for sulfate ions, as
controlled with 0.1 M BaCl2 solution. The separated
cake was dried in a cyclone dryer.
Instrumentation
pH values were measured with a pHM-26 instrument and a combined glass electrode with an operating range of up to pH ~ 14, both manufactured by Radiometer (Denmark).
The X-ray powder diffraction pattern was recorded using an APD 2000 diffractometer
manufactured by ItalStructures (Riva Del Garda,
Italy).
The Fourier transform IR spectrum was recorded
using a Perkin-Elmer spectrometer (Model 2000).
The specimen was pressed using a spectroscopically pure KBr matrix.
The BET measurement was performed using a
FlowSorb II 2300 surface area analyzer (Micromeritics, Norcross, GA, USA).
Electrophoretic mobilities were measured using a microelectrophoresis apparatus manufactured by
Rank Brothers, Cambridge, U.K.
A thermal field emission scanning electron microscope (FE-SEM, model JSM-7000F)
manufactured by Jeol Ltd. (Japan) was used.
FE-SEM was linked to an EDS/INCA 350 (energy
dispersive X-ray analyzer) manufactured by Oxford
Instruments Ltd. (UK). Sample was not coated with an electrically conductive layer.
RESULTS AND DISCUSSION
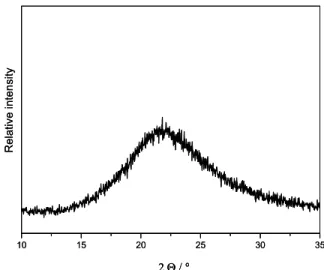
Fig. 1 shows an X-ray powder diffraction pattern
of precipitated SiO2. An amorphous peak with the
equivalent Bragg angle at 2θ = 21.8o was recorded.
Martinez et al. (2006) prepared amorphous SiO2 by
the sol-gel procedure, subjected it to thermal treatment, then analyzed it using the Rietveld refinement. In their work, an amorphous peak was
centered at 2θ = 23o. With an increased heating
temperature, this peak was shifted to lower 2θ
values. Depending on the molar ratio (R) of water to TEOS (R = 5 or 11.66) and the heating temperature, the amorphous structure transformed to quartz-like or cristobalite-like structures. Zhang et al. (2008) also recorded one broadened XRD peak for
amorphous silica centered at a 2Θ value close to our
measurement. Only this XRD peak, corresponding to the amorphous phase, was present upon heating the starting material up to 800°C. Upon heating
amorphous silica at 1000°C, tetragonal α
-crystobalite and a small fraction of monoclinic tridymite were obtained.
10 15 20 25 30 35
Re
lative
inten
s
ity
2 Θ / o
2 Θ /o
10 15 20 25 30 35
Re
lative
inten
s
ity
2 Θ / o
2 Θ /o
2 Θ /o
Figure 1: X-ray powder pattern of precipitated SiO2
with a characteristic amorphous peak
Jesionowski and Krysztafkiewicz (1999)
silicate with dilute HCl, H2SO4 or CO2 in
alcohol-containing media. Dispersibility and size of the SiO2
particles depended on the nature of the alcohol added.
In the presence of isopropanol, SiO2 particles were
525 nm in size, with a tendency to form aggregates
1340 nm in size. The precipitation of SiO2 in the
presence of ethylene glycol yielded particles 112 nm
in size, whereas in the presence of glycerine SiO2
particles 360 nm in size were formed. Pajonk et al.
(1995) prepared SiO2 aerogels using
polyethoxydisiloxanes obtained by the reaction of tetraethoxysilane (TEOS) and water in the presence of sulfuric acid. Sol-gel reactions were conducted under acidic, neutral or basic conditions in methanol, ethanol or acetone. Hyeon-Lee et al. (1997) applied
the aero-sol-gel procedure to prepare SiO2 powder
with a very high specific surface area, ~ 400 m2g-1. An inverse microemulsion sol-gel procedure was used to
prepare SiO2 particles of colloidal dimensions
(Espiard et al. 1995). The sol-gel procedure was also
used to prepare porous and spherical SiO2 particles
(Hirose et al. 1994). Spherical SiO2 particles showed a
tendency to increase in size with an increase of ultrasonic energy during the synthesis of these particles (Enomoto et al. 1996).
In the present work, a specific surface area of up
to 130 m2g-1 could be obtained. This is important,
especially if we consider the relative simplicity of
the procedure for the production of amorphous SiO2
as applied in the present work.
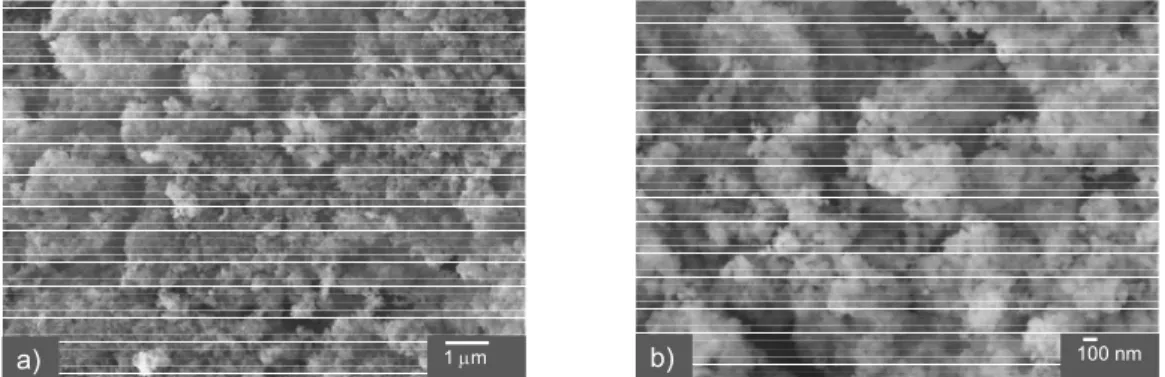
Fig. 2 shows FE-SEM images of the amorphous
SiO2 particles at different optical magnifications. The
majority of primary SiO2 particles were ~15 to ~ 30 nm
in size. These primary particles showed a tendency to form bigger particles (aggregates). Fig. 3 shows the
EDS spectrum of amorphous SiO2 particles. This
spectrum showed only the presence of silicon and oxygen. An excess of oxygen in relation to the stoichiometric ratio Si:O = 1:2 can be attributed to the presence of water and –SiOH groups. The analysis of
precipitated SiO2 showed that it contained 7.63% of
"structural" water and 2.36% of “free water” (moisture). For comparison, the EDS spectrum of
precipitated SiO2 crystallized at high temperature was
recorded under the same instrumental conditions and a fully stoichiometric ratio Si:O = 1:2 was obtained due to
removal of H2O molecules and condensation of –SiOH
groups. The EDS spectrum did not show the presence of sulfate, chloride or sodium ions, thus indicating that these ions were well removed in the mother liquour. Generally, sulfate ions can specifically adsorb on (hydrous) oxide surfaces, similar to phosphates or
chromates (Musić et al. 1986). Their adsorption
decreases with a pH-increase, which is opposite to metal cation adsorption, i.e., the adsorption of metal cations
increases with a pH-increase (Musić et al. 1988). A
good removal of SO24− and Cl
ions can also be due to a low pHzpc of the amorphous SiO2 particles. Fig. 4 shows
the dependence of electrophoretic mobility on the pH of the SiO2 suspension. The zero point of charge is located
at pH = 1.7. Above pHzpc = 1.7 the surface of the
amorphous SiO2 particles is negatively charged.
Fig. 5 shows the FT-IR spectrum of precipitated SiO2. The IR band at 3437 cm-1 is due to the stretching
vibration of H2O molecules. Correspondingly, the IR
band at 1632 cm-1 is due to the bending vibration of
H2O molecules. The shoulder at 3246 cm-1 could be
assigned to the stretching vibrations of Si-OH groups in
the structure of amorphous SiO2. The presence of the
Si-OH group is proved as bonded water. The very
strong and broad IR band at 1111 cm-1 with a shoulder
at 1188 cm-1 is usually assigned to the TO and LO
modes of the Si-O-Si asymmetric stretching vibrations.
The IR band at 956 cm-1 can be assigned to silanol
groups. In the case of alkali silicate glasses, this band is
assigned to Si-O- stretching vibrations. The IR band at
800 cm-1 can be assigned to Si-O-Si symmetric
stretching vibrations, whereas the IR band at 474 cm-1
is due to O-Si-O bending vibrations. Murphy and
Greytak (1979) assigned the IR band at 380 cm-1 to the
Si-OH wagging mode. In the present work, the IR band at 380 to 377 cm-1 is recorded as a shoulder at 378 cm-1.
a) 1 μm b) 100 nm
Figure 3: EDS spectrum of precipitated SiO2.
Figure 4: Electrophoretic mobility of amorphous SiO2 particles as a function of the pH of the suspension.
Bock and Su (1970) recorded the IR spectrum of fused silica and compared it with the results of vibrational calculations. For fused silica, the IR
bands at 377, 465, 800, 950, 1100 and 1190 cm-1
were recorded. These IR bands also appear in crystalline silica (quartz, crystobalite and tridymite). Of course, the crystalline silicas have more pronounced IR bands with narrower line-widths. Amorphous silica and crystalline silica can really only be distinguished on the basis of measurements
in the far-IR region. Vibrational spectra of silica glasses have been studied (Philips, 1987; Tomozawa et al. 2005) and IR spectroscopy used to monitor
changes in amorphous SiO2 during its heating up to
1150°C (Chmel et al. 1990). Innocenzi (2003) used IR spectroscopy to investigate different stages during the sol-gel formation of silica. The FT-IR spectrum shown in Fig. 5 agrees well with the spectrum
obtained for amorphous SiO2 precipitated by the
carbonation method (Cai et al. 2009).
4000 3500 3000 2500 2000 1500 1000 500 378
1188
570
474 800 956
1111 3246
1632
3437
SiO2
Re
la
tive transmitta
nce
Wave number / cm-1
CONCLUSION
Precipitated silica was produced by neutralization
of sodium silicate solution (water glass) with H2SO4
solution. The synthesis parameters, such as temperature, time of mixing, pH and the amount of coagulant were optimized. Precipitated silica in the form of powder, as obtained with the optimized parameters, could reach a specific surface area of up to 130 m2g-1.
X-ray powder diffraction of precipitated silica
showed one amorphous peak located at 2θ = 21.8o
and the FT-IR spectrum was typical of that known
for amorphous SiO2.
FE-SEM inspection showed primary SiO2 particles
~15 to ~ 30 nm in size. These particles showed a tendency to aggregate (secondary particles).
The EDS spectrum did not show a contamination
of precipitated SiO2 with sulfate or other ions.
"Foreign" ions could be present at the level of traces. Amorphous SiO2 particles contained "structural" and
“free” water (moisture) which were responsible for
excess oxygen in these particles. pHzpc =1.7 was
determined by microelectrophoretic measurements.
Properties of precipitated silica produced at the
technological level using the same procedure matched those obtained at the laboratory level.
REFERENCES
Bock, J., Su, G.-J., Interpretation of the infrared spectra of fused silica. J. Amer. Ceram. Soc., 53, p. 69 (1970).
Cai, X., Hong, R. Y., Wang, L. S., Wang, X. Y., Li, H. Z., Zheng, Y., Wei, D. G., Synthesis of silica powders by pressured carbonation. Chem. Eng. J., 151, p. 380 (2009).
Chmel, A., Mazurina, E. K., Shashkin, V. S., Vibrational spectra and defect structure of silica prepared by non-organic sol-gel process. J. Non-Crystall. Solids, 122, p. 285 (1990).
Enomoto, N., Koyano, T., Nakagawa, Z., Effect of ultrasound on synthesis of spherical silica. Ultrasonics Sonochemistry, 3, p. S105 (1996). Espiard, P., Guyot, A., Mark, J. E., Surface
functionalized colloidal silica particles from an inverse microemulsion sol gel process. J. Inorg. Organometallic Polym., 5, p. 391 (1995).
Hirose, A., Yamashita, H., Maekawa, T. Synthesis of
porous SiO2 spherical particles by sol-gel methods
in W/O emulsion. Analytical Sci. (Japan), 10, p. 737 (1994).
Hyeon-Lee, J., Beaucage, G., Pratsinis, S. E., Aero-sol-gel synthesis of nanostructured silica powders. Chem. Mater., 9, p. 2400 (1997).
Innocenzi, P., Infrared spectroscopy of sol-gel derived silica-based films: a spectra-microstructure overview. J. Non-Crystall. Solids, 316, p. 309 (2003).
Jesionowski, T., Krysztafkiewicz, A., Properties of highly dispersed silicas precipitated in an organic medium. J. Dispersion Sci. Technol., 20, p. 1609 (1999).
Jesionowski. T., Preparation of colloidal silica from sodium metasilicate solution and sulphuric acid in emulsion medium. Colloids & Surfaces A: Physicochem. Eng. Aspects, 190, p. 153 (2001). Jesionowski, T. Characterization of silicas
precipitated from solution of sodium metasilicate and hydrochloric acid in emulsion medium. Powder Technol., 127, p. 56 (2002).
Liu, K., Feng, Q., Yang, Y., Zhang, G, Ou, L., Lu, Y., Preparation and characterization of amorphous silica nanowires from natural chrysotile. J. Non-Crystall. Solids, 353, p. 1534 (2007).
Martinez, J. R., Palomares, S., Ortega-Zarzosa, G., Ruiz, F., Chumakov, Y., Rietveld refinement of
amorphous SiO2 prepared via sol–gel method.
Mater. Lett., 60, p. 3526 (2006).
Murray, C. A., Greytak, T. J., Intrinsic surface phonons in amorphous silica. Phys. Rev., B 20, 3368 (1979).
Musić, S., Ristić, M., Tonković, M., Sorption of
chromium (VI) on hydrous iron-oxides. Z. Wasser, Abwasser-Forsh. 19, p. 186 (1986).
Musić, S., Ristić, M., Adsorption of trace elements
or radionuclides on hydrous iron oxides J. Radioanal. Nucl. Chem., 120, p. 289 (1988). Pajonk, G. M., Elaloui, E., Achard, P., Chevalier, B.,
Chevalier, J. -L., Durant, M., Physical properties of silica gels and aerogels prepared with new polymeric precursors. J. Non-Crystall. Solids, 186, p. 1 (1995).
Philips, J. C., Structural model of Raman “defect” bands of vitreous silica. Phys. Rev., B 5, p. 6409 (1987).
Schlomach, J., Kind, M., Investigation of semi-batch precipitation of silica. J. Coll. Interface Sci., 277, p. 316 (2004).
Tomozawa, M., Hong, J. -W., Ryu, S. -R., Infrared (IR) investigation of the structural changes of silicaglasses with fictive temperature. J. Non-Crystall. Solids, 351, p. 1054 (2005).
natural chrysotile. J. Coll. Interface Sci., 295, p. 436 (2006).
Winyall, M. E., "Silica Gels: Preparation and Properties”, in: Applied Industrial Catalysis, 3, p. 43, Academic Press, Inc. (1984).
Zhang, G., Xu, Y., Xu, D., Wang, D., Xue, Y., Su, W.,
Pressure-induced crystallization of amorphous SiO2