ISSN 1517-7076 artigo e-11894, 2017
Autor Responsável: Carlos Vargas Data de envio: 21/10/2016 Data de aceite: 16/06/2017
10.1590/S1517-707620170004.0228
Análisis y modelamiento de simulaciones de
esfuerzos residuales en piezas plásticas
inyectadas empleando correlaciones
robustas
Analysis and modeling of simulated residual stress
of mold injected plastic parts by using
robust correlations
Carlos Vargas 1, Juan Sierra 2, Juan Posada 2, Juan F. Botero-Cadavid 3
1 Instituto tecnológico metropolitano - Grupo materiales avanzados y energia (Línea nuevos materiales) – Calle 73 #76 a
354 via al volador, Medellín, Colombia. e-mail: [email protected] 2
Instituto tecnológico metropolitano - Grupo calidad, metrologia y producción (Línea transformación avanzada de mate-riales) - Calle 73 #76 a 354 via al volador, Medellín, Colombia.
3
Universidad nacional de Colombia – Escuela de física – Calle 59 a # 63 – 20, Medellín, Colombia. e-mail: [email protected]; [email protected]; [email protected]
RESUMEN
La inyección de termoplásticos es uno de los procesos mas ampliamente usados para fabricar piezas plásticas. La evaluación de los esfuerzos residuales generados durante el proceso de inyección es de gran importancia para la calidad y desempeño del producto. El presente estudio evalúa los esfuerzos residuales en una muestra de ensayos de tensión inyectada, empleando el software de simulación Moldex 3D, para dos tipos de políme-ros, polipropileno y policarbonato. Los esfuerzos residuales obtenidos por simulación a partir de un diseño de experimentos fueron modelados posteriormente mediante una técnica de regresión multivariable robusta. Los resultados mostraron que los esfuerzos residuales pueden ser adecuadamente modelados con un ajuste polinomial cuadrático. Para ambos materiales evaluados, los niveles más bajos de esfuerzos residuales se encontraron a la temperatura de molde más alta y a la temperatura de inyección más baja.
Palabras clave: Esfuerzos residuales, moldeo por inyección, regresión multivariable robusta, simulación, diseño de experimentos.
ABSTRACT
The injection molding process is the most widely used processing technique for polymers. The analysis of residual stresses generated during this process is crucial for the part quality assessment. The present study evaluates the residual stresses in a tensile strength specimen using the simulation software Moldex3D for two polymers, polypropylene and polycarbonate. The residual stresses obtained under a simulated design of ex-periment were modeled using a robust multivariable regression technique. The results shown that residual stresses could be successfully modeled with a quadratic polynomial fit. For both materials, the lowest level of residual stresses was found at the highest mold temperature and the lowest melting temperature.
Keywords: Residual stresses, injection molding, robust multivariable regression, simulation, design of ex-periments.
1. INTRODUCTION
is forced to suffer drastic deformations, with a residual thermal history, the final properties obtained on the injected pieces could be radically modified.
The presence of high residual internal tensions in injected parts can occur as a consequence of high pressures, temperature gradients of the molten material, and temperature gradients in the mold walls. These causing contractions, bending, and other defects in the piece that can affect the performance of the injected products during lifetime [1]-[4].
Several polymers are employed in the injection molding process, among them polyolefins, such as polyethylene (PE) and polypropylene (PP) from the semi-crystalline type of polymers. Engineering polymers are a type of materials used where high physical, mechanical, chemical, and thermal requirements need to be fulfilled by the produced parts. These parts are commonly found in machines of a wide range of industries which include cosmetics, automotive, aerospace, and naval, among others.
Some of these applications where high thermal or mechanical properties are required employ the dop-ing with additives and reinforcdop-ing materials. Those additives not only increase the properties of the injected polymers but also can alter the processing conditions, requiring higher temperatures and pressures, which in turn can increase the internal residual stresses [5].
Nowadays, the demand of satisfying the high requirements in injected products makes necessary to be able to know and predict the influence of the internal residual stresses on the deformations and bending of the finished pieces. Predicting this behavior relies on an adequate knowledge of the involved mechanisms inter-acting to produce defects and anomalies in finished parts.
Multiple studies have been proposed with the purpose of explain and predict the phenomenon of re-sidual stresses. In [6], this phenomenon is attributed to two causes, the first being the macromolecular orien-tation of the material due to stresses induced by tensions of the flow. The second cause is the stresses caused during the cooling stage of the part. There is a proportional reduction in the contractions of the part as pack-ing pressure increases, this is explained from the raise in the incompack-ing material durpack-ing the stage of pressure sustainment. As the packing pressure rises, the difference between the tensile and compressive stresses also increases. According to [7], thermally induced residual stresses have a more significant impact on the part than those that occur as a consequence of the flow front. This kind of effects are sometimes neglected when simulations and theoretical predictions are performed, which in turn can cause adverse results since these type of stresses can affect the properties and performance of the manufactured part. This lessening of proper-ties could be a result of high macromolecular orientations inside the injected material that could, on the long term, cause dimensional variations affecting the dimensional stability of the parts.
Some studies also suggest that mold temperature is one of the most critical parameters in the injection process, since it has been shown that when this temperature is high enough lower residual stresses are caused [8]. Several models have been used to predict residual stresses including: the model of flow induced stresses, which describes the mechanisms of formation or accumulation of flow stresses during the stages of filling and pressure sustainment [9]; the model of thermal induced stresses, and model of formation of thermally induced stresses [10].
Present research work studies the residual stress prediction, by using the Moldex 3D software, in a wide range of the previously mentioned variables, in particular for an amorphous polymer (Polycarbonate) and for a semicrystalline polymer (Polypropylene). A three level factorial design was used to collect a lot of data of effect of previously mentioned variables in the residual stresses. Since a lot of information was ob-tained, it is important to obtain a predictive model for residual stress prediction. Although the obvious ap-proach is a modeling by using a least square regression with a quadratic polynomial, it is recognized some limitations of this approach. Particularly, the least square regression is questionable when residuals do not follow a normal distribution (presence of outlier data) and when some degree of collinearity of independent variables is observed. To overcome the mentioned drawbacks of least square regression, robust techniques have been developed, being the most popular the Andrew´s sine method, the Huber´s method and the Tuk-ey’s Biweight method. In this particular research work, a Huber´s robust method with a C constant equal to 1,345 was used [11].
2. MATERIALS AND METHODS
2.1 Materials
homo-polymer from SABIC (575P) and the polycarbonate from GE (LEXAN 144R). In both cases, all properties of the polymers required for the simulations are included in the Moldex 3D software database.
2.2 Geometry
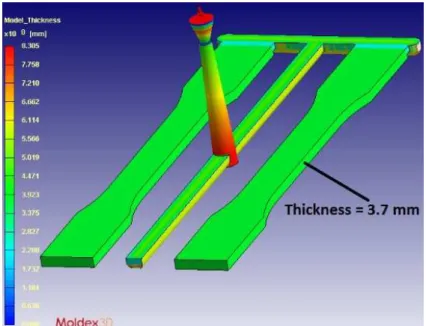
The selected geometry in the simulation was a 3.7 mm thickness ASTM D638 specimen [12] for tensile strength. Figure 1 shows the number of cavities and the runner system to feed the melted polymer into the mold.
Figura 1: Part to analyze injection molding process (Cavities, runner system and thickness).
2.3 Processing conditions
For each polymer two design of experiments (DOE) were performed, in order to include different processing conditions that affect the residual stresses. First DOE evaluated the influence of mold wall temperature and injection temperature at fixed conditions of cooling time and packing. The second DOE evaluated the influ-ence of cooling time and packing step (time and pressure) in residual stress. Table 1 to Table 4 list the varia-bles and levels used for each DOE for Polypropylene and Polycarbonate.
Table 1: DOE for polycarbonate at different levels of injection temperature and mold wall temperature. (At cooling time = 10 s, packing time = 7.7 s and packing pressure = 600 bar).
VARIABLE LEVEL 1 LEVEL 2 LEVEL 3
Injection
temperatu-re [°C]
290 305 320
Mold wall
tempera-ture [°C]
50 80 110
Table 2: DOE for polycarbonate at different levels of cooling time, packing time and pressure. (At injection temperature = 305 °C, mold wall temperature = 80 °C and filling time = 1 s).
VARIABLE LEVEL 1 LEVEL 2 LEVEL 3
Remaining cooling
time [s]
6 10 15
Packing time [s] 4 7.7 10
Packing pressure
[bar]
Table 3: DOE for polypropylene at different levels of injection temperature and mold wall temperature (At cooling time = 13 s, packing time = 10 s and packing pressure = 800 bar).
VARIABLE LEVEL 1 LEVEL 2 LEVEL 3
Injection
temperatu-re [°C]
210 240 270
Mold wall
tempera-ture [°C]
20 40 60
Table 4: DOE for polypropylene at different levels of cooling time, packing time and packing pressure. (At injection temperature = 240 °C, mold wall temperature = 40 °C and filling time = 1 s).
VARIABLE LEVEL 1 LEVEL 2 LEVEL 3
Remaining cooling
time [s]
10 13 16
Packing time [s] 7 10 13
Packing pressure
[bar]
600 800 1000
2.4 Simulation of residual stress
Simulations were performed using the Moldex 3D software, all phases of injection molding process were evaluated (filling, packing, cooling and warpage). The warpage phase includes the calculations of residual stresses. In order to evaluate a most realistic process, cooling channels were included with the proper temper-ature and coolant flow to reach the adequate mold wall tempertemper-ature. Figure 2 shows the configuration of the mold with the cavity being filled, the cooling channels, and the mesh of finite volume that allows the injec-tion molding process to be simulated and solved. Figure 3 shows a detail of the number of elements in the mesh through the thickness (6 elements), such refinement level is intended to get results more precise. Ac-cording to other similar studies this number of mesh elements through thickness is enough to get adequate simulation results [13] – [15]. The value of the residual stress reported was the Von Mises stresses, which is the mean value of residual stress at x, y, z directions (which is the equivalent value …).
Figura 3: Mesh refinement.
2.5 Robust multivariable regression technique
A multivariable regression technique of the data obtained from the design of experiment was used to obtain a predictive model of the simulations. The least Squares technique is the most common method used for data regression. However, robust regression provides an alternative to least squares regression when the outliers violate the assumption of normally distributed residuals in the least squares regression. In this study a Hub-bert robust analysis with a C constant equal to 1.345 was used. The regression analysis was done evaluating a specific point at the surface of injected part (shown in Figure 4). That spot was selected intentionally because the surface of the injected part gives the main mechanical resistance, and because that zone has a high failure probability when a tensile test is performed on the part.
Figura 4: Selected zone to measure residual stresses in analyzed part.
3. RESULTS AND DISCUSSION
3.1 Polycarbonate analysis
used for the model. The lowest level of residual stress is observed at the highest mold temperature and the lowest melt temperature. The highest level of residual stress is observed at the lowest mold and melt tempera-ture. The effect of melt temperature in residual stress could be explained as follow.
As the melt temperature increases, the gate freezing is delayed, such that more material can be inject-ed in the mold, thus decreasing the amount of shrinkage and therefore, the residual stresses are lower. The effect of mold temperature could be evidenced, since an increase of this parameter also delays the gate freez-ing, which in turn decreases shrinkage and residual stresses [16], [17]. Additionally, with a higher mold tem-perature, the unsolidified region is thicker and lasts longer, allowing a higher packing effect. This also con-tributes to diminish residual stress. Similar trends to the one here reported were observed in other studies [5], [6], [8].
Figure 6 shows the regression of the DOE for Polycarbonate at different levels of cooling time, pack-ing time, and pressure. The regression coefficient and adjusted regression coefficient are presented in the same figure. Although a lower degree of correlation was observed compared with the one obtained for vari-ous mold and melt temperatures, the quadratic polynomial robust regression is still suitable. The lowest level of residual stress is observed at the highest cooling time and at the highest packing pressure. The highest lev-el of residual stress is observed at the lowest cooling time and at the lowest packing pressure. These results are foreseeable since more material can be injected during the packing stage as the packing pressure increases, this additional material compensates the shrinkage in the central region of the molded part [18] – [22]. How-ever, as the packing pressure also increases, the gradient between tensile and compressive stresses becomes larger. Additionally, the higher the cooling time the higher the macromolecular relaxation time, thus lower level of residual stresses were observed [5], [6], [23]- [25].
Table 5: Results of DOE for polycarbonate at different levels of injection temperature and mold wall temperature. (At cooling time = 10 s, packing time = 7.7 s and packing pressure = 600 bar).
SIMULATION INJECTION
TEM-PERATURE [°C]
MOLD WALL TEMPERATURE [°C]
RESIDUAL STRESS VON MISES [MPA]
1 290 50 36.01
2 305 50 35.88
3 320 50 34.39
4 290 80 25.18
5 305 80 24.16
6 320 80 24.86
7 290 110 14.43
8 305 110 15.50
9 320 110 16.77
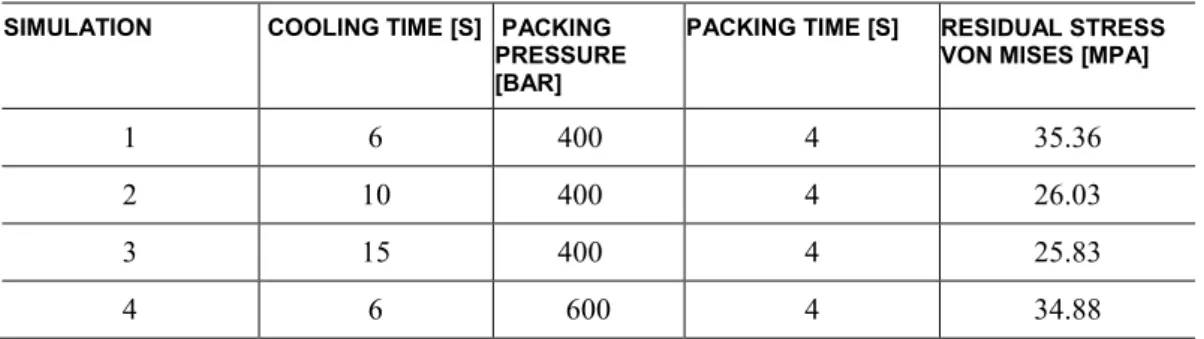
Table 6: Results of DOE for polycarbonate at different levels of cooling time, packing time and packing pressure. (At injection temperature = 305 °C, mold wall temperature = 80 °C and filling time = 1 s).
SIMULATION COOLING TIME [S] PACKING
PRESSURE [BAR]
PACKING TIME [S] RESIDUAL STRESS
VON MISES [MPA]
1 6 400 4 35.36
2 10 400 4 26.03
3 15 400 4 25.83
SIMULATION COOLING TIME [S] PACKING PRESSURE [BAR]
PACKING TIME [S] RESIDUAL STRESS
VON MISES [MPA]
5 10 600 4 25.47
6 15 600 4 25.23
7 6 800 4 31.06
8 10 800 4 24.32
9 15 800 4 24.11
10 6 400 7.7 24.72
11 10 400 7.7 27.17
12 15 400 7.7 27.08
13 6 600 7.7 24.09
14 10 600 7.7 24.16
15 15 600 7.7 25.79
16 6 800 7.7 20.74
17 10 800 7.7 20.70
18 15 800 7.7 22.25
19 6 400 10 26.14
20 10 400 10 26.42
21 15 400 10 26.34
22 6 600 10 24.96
23 10 600 10 25.17
24 15 600 10 25.21
25 6 800 10 21.56
26 10 800 10 21.70
Figura 5: Von Mises stress for polycarbonate at different levels of mold and melt temperature. (At cooling time = 10 s, packing time = 7.7 s and packing pressure = 600 bar).
3.2 Polypropylene analysis
Table 7 and Table 8 show the residual stress results of the two DOE evaluated for Polypropylene. Figure 7 presents the regression of the DOE for Polypropylene at different levels of mold and melt temperature. The regression coefficient and adjusted regression coefficient are presented in the figure, revealing an excellent correlation with a quadratic polynomial fit model. The formula of the quadratic polynomial obtained in this robust regression is shown below the figure. The DOE for Polypropylene at different levels of mold and melt temperature can also be accurately modeled using the surface response curves. In the case of polypropylene, a considerable degree of curvature was observed. The lowest and highest levels of residual stress exhibit the same trend of that one of the polycarbonate. The lowest level of residual stress is observed at the highest mold temperature and at the lowest melt temperature. On the other hand, the highest level of residual stress is observed at the lowest mold and melt temperature. Similarly to the previously presented case, as the melt temperature increases, the gate freezing is delayed, and more material can be injected inside the mold, thus decreasing the amount of shrinkage and therefore, lessening the residual stresses. The effect of the mold tem-perature can also be explained since an increase of this parameter also causes delays in the gate freezing, which in turn decreases shrinkage and the residual stresses. Additionally, with a higher mold temperature the unsolidified region is thicker and lasts longer, allowing a higher packing effect. Which also contributes to lower the residual stress.
Figure 8 presents the regression of the DOE for polypropylene at different levels of cooling time, packing time, and pressure. The regression and adjusted regression coefficients are presented in the same figure. As in the case of the polycarbonate, the robust regression for this DOE in the polypropylene shows a lower degree of correlation than the one obtained for the DOE with temperatures, however, the quadratic polynomial robust regression is still suitable. The lowest level of residual stress is observed at a cooling time of 25 seconds and at the highest packing pressure. Whereas the highest level of residual stress is obtained at the lowest mold and at the lowest melt temperature. These results were expected, since more material is add-ed during the packing stage as the packing pressure increases, thus there is a compensation of the shrinkage in the central region of the molded part. However, as the packing pressure increases, the difference between tensile and compressive stresses becomes larger. The higher degree of curvature observed in the polypropyl-ene response, if compared with the one from the polycarbonate, could be explained by the higher shrinkage registered in a semi-crystalline material, where thermal and crystallization shrinkage phenomena occur. Ad-ditionally, higher cooling times allow for a higher macromolecular relaxation time, thus lower level of resid-ual stresses can be observed. For the particular case of the simulated polypropylene, a minimum value of residual stress around 25 seconds of cooling time was observed as previously mentioned. However, addition-al data for higher cooling times are required to be conclusive about this behavior. This scenario however, was not explored in this work as it may lead to unrealistically long cooling times that may not reflect those ob-served in industry practices where high productivity is a must.
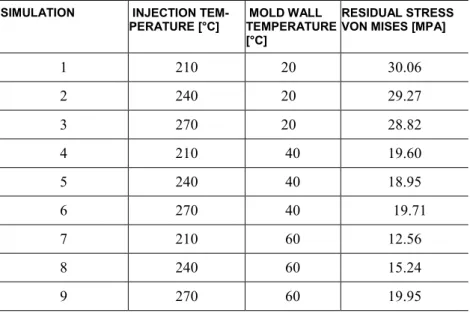
Table 7: Results of DOE for polypropylene at different levels of injection temperature and mold wall temperature (At cooling time = 13 s, packing time = 10 s and packing pressure = 800 bar).
SIMULATION INJECTION
TEM-PERATURE [°C]
MOLD WALL TEMPERATURE [°C]
RESIDUAL STRESS VON MISES [MPA]
1 210 20 30.06
2 240 20 29.27
3 270 20 28.82
4 210 40 19.60
5 240 40 18.95
6 270 40 19.71
7 210 60 12.56
8 240 60 15.24
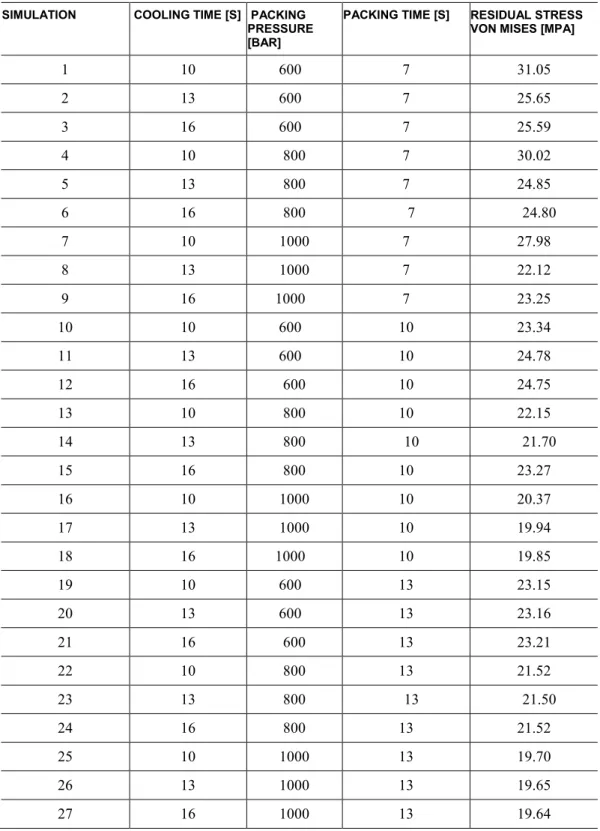
Table 8: Results of DOE for polypropylene at different levels of cooling time, packing time and packing pressure. (At injection temperature = 240 °C, mold wall temperature = 40 °C and filling time = 1 s).
SIMULATION COOLING TIME [S] PACKING
PRESSURE [BAR]
PACKING TIME [S] RESIDUAL STRESS
VON MISES [MPA]
1 10 600 7 31.05
2 13 600 7 25.65
3 16 600 7 25.59
4 10 800 7 30.02
5 13 800 7 24.85
6 16 800 7 24.80
7 10 1000 7 27.98
8 13 1000 7 22.12
9 16 1000 7 23.25
10 10 600 10 23.34
11 13 600 10 24.78
12 16 600 10 24.75
13 10 800 10 22.15
14 13 800 10 21.70
15 16 800 10 23.27
16 10 1000 10 20.37
17 13 1000 10 19.94
18 16 1000 10 19.85
19 10 600 13 23.15
20 13 600 13 23.16
21 16 600 13 23.21
22 10 800 13 21.52
23 13 800 13 21.50
24 16 800 13 21.52
25 10 1000 13 19.70
26 13 1000 13 19.65
Figura 7: Von Mises stress for Polypropylene at different levels mold and melt temperature. (At cooling time= 13 s, packing time = 10 s and packing pressure = 800 bar).
4. CONCLUSIONS
The robust multivariable regression technique showed to be a valuable tool for modeling the data obtained from the simulation of the injection molding process. As it was illustrated in this manuscript, a considerable amount of information was successfully correlated and a predictive tool was derived from the data obtained from a design of experiments (DOE) using a Moldex 3D simulation. It was showed that a quadratic polyno-mial function is suitable for predicting and analyzing simulated data, and furthermore, the advantages of ro-bust regression methodology were evident.
The results obtained at the simulations were congruent with theoretical phenomena. The most predom-inant variables in the residual stress produced in the injection molding process are the mold and the melt temperatures, the time and pressure of packing, and the cooling time. The lower residual stresses were shown to occur with high mold and melt temperatures, as well as with high pressures and times of packing, and enough cooling time. Future work is currently in progress to include other parameters such as the thickness effect, effect in the mechanical properties, and the validation of the residual stress prediction using the stand-ardized technique of polarization measurements.
5. ACKNOWLEDGEMENT
The authors acknowledge to the Instituto Tecnologico Metropolitano, ITM and the Universidad Nacional de Colombia for supporting the present research work.
6. BIBLIOGRAFIA
[1] MACÍAS, C., MEZA, O., PÉREZ, E., “Relaxation of residual stresses in plastic cover lenses with appli-cations in the injection molding process,” Engineering Failure Analysis., v. 57, pp. 490–498, Nov. 2015. [2] SORTINO, M., TOTIS, G., KULJANIC, E., “Comparison of Injection Molding Technologies for the Production of Micro-optical Devices,” Procedia Engineering., v. 69, pp. 1296–1305, 2014.
[3] KIHLANDER, J., Finite Element simulation of vibrating plastic components, Thesis M.Sc., Linköping University, Göteborg, Sweden, 2013.
[4] LI, M., ZHANG, H.M., NIE, Y, “Simulation Analysis of Residual Stress of the Plastic Gear Based on Moldflow,” Key Engineering. Materials., v. 501, pp. 339–343, Jan. 2012.
[5] ACEVEDO-MORANTES, M.T., BRIEVA-SARMIENTO, M., REALPE-JIMÉNEZ, A., “Effect of the molding temperature and cooling time on the residual stresses of crystal polystyrene,”, DYNA, v. 81, n. 187, pp. 73–80, 2014.
[6] CHOI, D., AND IM, Y., “Prediction of shrinkage and warpage in consideration of residual stress in inte-grated simulation of injection molding”, Composite Structures, v. 47, n. 1999, pp. 655–665, 1999.
[7] KIM, S.H., KIM, C.H., OH, H., et al., “Residual stresses and viscoelastic deformation of an injection molded automotive part”, Korea-Australia Rheology Journal, v. 19, n. 4, pp. 183–190, 2007.
[8] WENG, C., LEE, W.B.B., TO, S., “Birefringence techniques for the characterization of residual stresses in injection-moulded micro-lens arrays”, Polymer. Testing., v. 28, n. 7, pp. 709–714, 2009.
[9] AZAMAN, M.D., SAPUAN, S.M., SULAIMAN, S., et al., “Numerical simulation analysis of the in-cavity residual stress distribution of lignocellulosic (wood) polymer composites used in shallow thin-walled parts formed by the injection moulding process”, Material and Design., v. 55, pp. 381–386, Mar. 2014. [10] GUEVARA-MORALES, A., FIGUEROA-LÓPEZ, U., “Residual stresses in injection molded prod-ucts”, Journal of Materials. Science., v. 49, no. 13, pp. 4399–4415, Mar. 2014.
[11] Anonymous., https://stat.ethz.ch/education/semesters/ss2012/regression/Part9.pdf. [Accessed: 10-Jun-2016].
[12] ASTM International (2010), D638, Standard test method for tensile properties of plastics. [13] ÖSTERGREN, A., Prediction of residual stresses in injection moulded parts, Thesis M.Sc., CHALMERS UNIVERSITY OF TECHNOLOGY, Göteborg, Sweden, 2013.
[14] OLIVEIRA, J.A.P. Análise numérica de tensões induzidas pelo escoamento não isotérmico de um polí-mero no preenchimento de cavidades de paredes finas, Universidade Federal do Rio Grande do Sul, Porto Alegre, Brazil, 2012.
the 2nd International Conference on Manufacturing Engineering, Quality and Production Systems, pp.77-82, Constantza,Romania, 30 June, 2010.
[16] SIEGMANN, A., BUCHMAN, A., KENIG, S. “Residual stresses in polymers III: The influence of in-jection-molding process conditions,” Polymer Engineering and Science., v. 22, n. 9, pp. 560–568, Jun. 1982. [17] HASTENBERG, C.H.V., WILDERVANCK, P.C., “The Measurement of Thermal Stress Distributions Along the Flow Path in Injection-Molded Flat Plates”, Polymer Engineering and Science, v. 32, n. 7, pp 506-515, Apr. 1992.
[18] KURT, M., SABAN KAMBER, O., KAYNAK, Y., et al., “Experimental investigation of plastic injec-tion molding: Assessment of the effects of cavity pressure and mold temperature on the quality of the final products,” Materials and Design., v. 30, n. 8, pp. 3217–3224, Sep. 2009.
[19] POSTAWA, P., KOSZKUL, J., “Change in injection moulded parts shrinkage and weight as a function of processing conditions,” Journal of Materials Processing Technology, v. 162, pp. 109–115, 2005.
[20] JANSEN, K.M.B., VAN DIJK, D.J., HUSSELMAN, M.H., “Effect of processing conditions on shrink-age in injection molding,” Polymer Engineering and Science., v. 38, n. 5, pp. 838–846, May 1998.
[21] JANSEN, K.M.B., TITOMANLIO, G., “Effect of pressure history on shrinkage and residual stress-es?injection molding with constrained shrinkage,” Polymer Engineering and Science, v. 36, n. 15, pp. 2029– 2040, Aug. 1996.
[22] BUSHKO, W.C., STOKES, V.K. “Solidification of thermoviscoelastic melts. Part II: Effects of pro-cessing conditions on shrinkage and residual stresses,” Polymer Engineering and Science, v. 35, n. 4, pp. 365–383, Feb. 1995.
[23] WANG T., AND YAN Y., “Residual Stress Simulation and Process Optimization of Injection Molded Part,” http://en.cnki.com.cn/Article_en/CJFDTOTAL-SLGY201212015.htm, [Accessed: 13-Jun-2016]. [24] WANG, X., ZHAO, G., WANG, G., “Research on the reduction of sink mark and warpage of the mold-ed part in rapid heat cycle molding process,” Materials and Design, vol. 47, pp. 779–792, 2013.