Efect of Cold Work on Cavitation Resistance of an Austenitic Stainless Steel Coating
Juliane Ribeiro da Cruza, Sérgio Luiz Henkeb, Ana Soia Clímaco Monteiro d’Oliveiraa,b*
Received: August 3, 2015; Revised: December 13, 2015; Accepted: July 13, 2016
Machining procedures of welding deposits are usual and result on cold work hardened surfaces. The
cold work efect on cavitation erosion of an austenitic stainless steel surface is assessed. FeCrMnSiB coatings were processed by PTA on AISI 304 plates. Specimens were grouped as the cold work deformed surface (CWHS) and the undeformed polished surface (UPS) specimens. Top surface and
transverse section of coatings were analysed for slip lines and hardness changes by light microscopy
and Vickers microhardness measurements. Ultrasonic cavitation tests were conducted in accordance to ASTM G32-10. CWHS specimens exhibited slip lines and hardened surfaces while UPS specimens did not show traces of slip lines and had insigniicant changes on microhardness. Cold work prior to cavitation indirectly increased the nominal incubation time and reduced the maximum erosion rate. Cold work increases the duration of the acceleration period postponing the onset of the maximum
erosion rate and enhancing cavitation resistance.
Keywords: Cold work deformation, Plastic deformation, Cold work hardening, Cavitation erosion, Acceleration period, Nominal incubation time, Incubation period, Fe-Cr-Mn-Si austenitic stainless steel
* e-mail: [email protected]
1. Introduction
The surface of hydraulic machinery is often eroded by
a mechanism named cavitation. Cavitation erosion occurs
when bubbles form in the liquid in regions where the absolute
pressure is below its vapor pressure. Under these conditions
bubbles collapse violently generating water jets and shock waves against the surface of parts1. Hydraulic components can be manufactured with carbon steel, austenitic and
martensitic stainless steels (such as AISI 304 and ASTM A743 CA6NM)2-4 or even cast iron5,6. Parts are often coated with cavitation resistant materials in order to enhance service life or as a consequence of a repair procedure.
Cavitation erosion behavior of materials is often
represented by the characteristic curves of cumulative
mass loss (Figure 1a) and erosion rate (Figure 1b) versus cavitation exposure time. According to the ASTM G32-10
standard, data distribution allows to identify the three stages of cavitation erosion, i. e., incubation period, acceleration
period and maximum-rate period. Notwithstanding, the boundaries of each stage can be difuse, as perceived by the incubation period deinition in the mentioned standard
(the period in which the erosion rate is zero or negligible
compared to other stages, A in Figure 1a and 1b), that leaves
room for a subjective interpretation.
The cavitation resistance of a material is frequently
characterized by the incubation period and maximum erosion
rate7,9-13. Another less subjective parameter used to measure
the initial period of cavitation and required in technical
reports by ASTM G32-10, is the nominal incubation time
(determined by the interception between the cavitation time
axis and the extension of the maximum erosion rate line itting, B in Figure 1a and 1b).
The incubation stage is of particular importance in low
stacking fault alloys, such as MnSi and Co alloyed austenitic
stainless steels. These alloys accommodate the impact of
shock waves creating stacking faults and extending the
incubation period8-10,14,15. In other metallic alloys, strain hardening during cavitation also plays an important role as a mechanism partially responsible for the magnitude of the incubation period16. Therefore, the ability of the alloy to accommodate plastic deformation can be associated with an enhanced cavitation resistance. That leads to the hypothesis that machined surfaces that undergo cold work deformation
may have a detrimental efect on cavitation resistance, as
a high dislocation density can be found on the surface, compromising the ability to accommodate further plastic
deformation. However, literature shows that stainless steels with a cold worked surface exhibit an improved cavitation
erosion resistance, associated with both an increase on the nominal incubation time and the reduction on the erosion rate11,12. Such improvement is attributed to an increase in hardness and resistance to plastic deformation11. The formation
of a {1 0 1} // surface texture under cold-work may also
increase the cavitation erosion11. The understanding of this
apparent contradiction between the expected efect of cold
aPost graduate program in Materials Science and Engineering, Universidade Federal do Paraná – UFPR, Centro Politécnico, CEP 81531-990, Curitiba, PR, Brazil
bMechanical Engineering Department, Universidade Federal do Paraná – UFPR, Centro Politécnico,
Figure 1: Characteristic curves of cumulative mass loss and erosion rate vs. cavitation exposure time. The three initial stages of cavitation are identiied: incubation period, acceleration period and maximum rate period. Nominal incubation time is also indicated
work deformation on cavitation resistance and experimental indings is highly signiicant since surfaces of hydraulic equipment are machined before exposure to cavitation
erosion susceptible environments.
This study aims to assess the efect of cold work deformed structures on the cavitation resistance of a FeCrMnSiB
austenitic stainless steel coating and to contribute to the
discussion on the efect of deformed structures on the
cavitation erosion behavior.
2. Experimental procedures
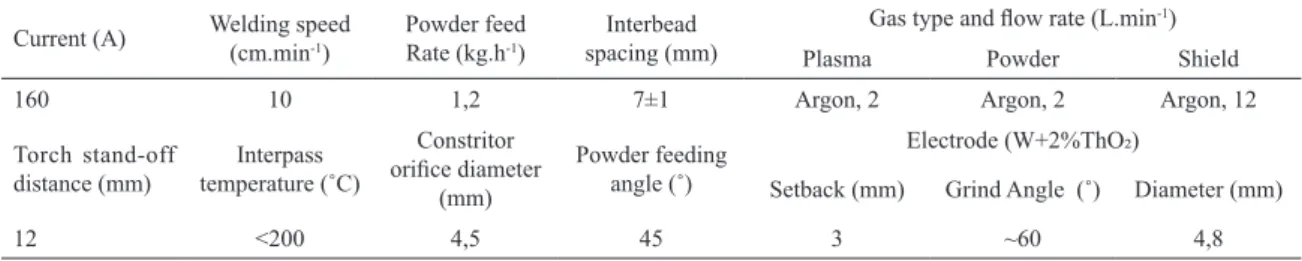
Coatings were processed on 102x50x13mm plates of AISI 304 stainless steel by Plasma Transferred Arc with the parameters listed on Table 1. A non-commercial FeCrMnSiB austenitic stainless steel (patent pending) was deposited. One
layer composed of eight overlapping beads was produced.
Before removing specimens for cavitation erosion tests,
face milling was carried out at the top and bottom surfaces to guarantee parallelism.
Milling was conducted in a semiautomatic vertical milling machine under 300rpm spindle speed, 200mm/min feed speed and 0.2mm depth of cut increments. To obtain
lat test surfaces the total depth of cut varied from 1 to 2mm.
Two similar sets of specimens were prepared, each
composed of two groups, one corresponding to the as-machined surfaces, identiied as cold work deformed surface (CWHS). The other, denominated undeformed polished surface (UPS), was further ground and polished to remove
the deformed layer caused by the machining. Each set was
Table 1: PTA hardfacing parameters used to process the coatings on AISI 304 substrates
Current (A) Welding speed (cm.min-1) Powder feed Rate (kg.h-1) spacing (mm)Interbead
Gas type and low rate (L.min-1)
Plasma Powder Shield
160 10 1,2 7±1 Argon, 2 Argon, 2 Argon, 12
Torch stand-off
distance (mm) temperature (˚C)Interpass
Constritor oriice diameter
(mm)
Powder feeding
angle (˚)
Electrode (W+2%ThO2)
Setback (mm) Grind Angle (˚) Diameter (mm)
12 <200 4,5 45 3 ~60 4,8
cavitation resistance characterization only, to improve
results reliability and to access the experimental procedures repeatability. Top surface and cross-section of UPS and CWHS 1 specimens from both groups were prepared using
standard metallographic procedures with silicon carbides abrasive paper down to 1200mesh followed by polishing
down to 0.3μm alumina. Etching by immersion in Marble reagent for up to three seconds allowed to examine the surface and cross-section under light microscope for the
presence of slip lines traces, typically present in cold worked microstructures. The thickness of the cold work deformed layers was measured under light microscope with the aid of image analysis software.
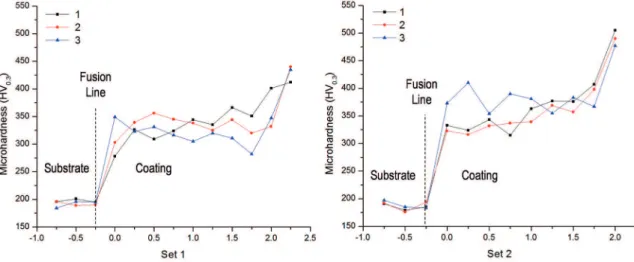
Microhardness proiles are an average of three proiles
with indentations every 0.25 mm, up to 50 µm from the top
surface, Figure 2. To calculate the average hardness of the cross-section, substrate measurements were discarded. So were the outliers, identiied with the aid of box plot graphs, considering a coeicient of 0.5.
Figure 2: Cross-section of coating. Arrows indicate the rows of
microhardness measurements and the fusion line
Vickers microhardness measurements under a 0.3kgf
load were also carried out at the surface of UPS and CWHS 1 specimens. Surface hardness as an average of at least 10
measurements was determined. In order to guarantee that
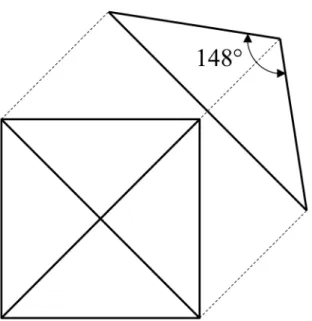
the hardness measurements refer to the deformed layer only, the depth of Vickers hardness indentation was calculated by trigonometry as being the height of a square based pyramid. Vickers hardness HV is the ratio between the applied force
F (kgf) and the area of impression A (mm2), equation 1. The latter is dependent on the average diagonal of the base
da (mm) equation 2. By replacing equation 2 in equation
1 and solving for da, it is possible to calculate the average diagonal as a function of Vickers hardness and the force
applied (equation 3). As the angles formed between the edges of the Vickers pyramid are of 148° 17 (Figure 3), the
depth of the Vickers indentation may be expressed by simple trigonometry relation, as shown on equation 4.
( )
HV
=
F
A
1
,
( )
A
sen
d
d
2
136
2
1 854368
2
a a 2 2
c
=
=
,
( )
d
aF
1 854368
HV
3
2
=
$
,
( )
tan
dp
d
2
148
0 5
4
ac
=
S
X
Ultrasonic vibratory cavitation erosion tests were performed
by the stationary method with test conditions in conformance
to ASTM G32-10: deionized water at 25±2°C, test specimen at an immersion depth of 15mm, peak-to-peak displacement amplitude of 48μm and standof distance of 500±10μm. The tip of the horn used, Figure 4, difers from the standard and
holds a total area of 2.75cm2. Specimens were exposed to
cavitation erosion up to 48hs. The variation of erosion rate with cavitation time was determined by numerical diferentiation (calculated by averaging the slopes of two adjacent points), using OriginLab software. To clearly display data tendency, a linear it was added to data in the maximum rate period, as well
as a 2nd order polynomial it to the acceleration period and a 4th or 5th order polynomial it to the erosion rate versus cavitation
time curve. The maximum erosion rate will be presented per
examination (Figure 5). The analysis revealed the
presence of slip lines at the surface and transversal
section of CWHS specimens, as expected following
cold work deformation.
Vickers microhardness profile on the cross-section of CWHS specimens, Figure 6, shows a hardness
increase towards the surface, associated with the surface
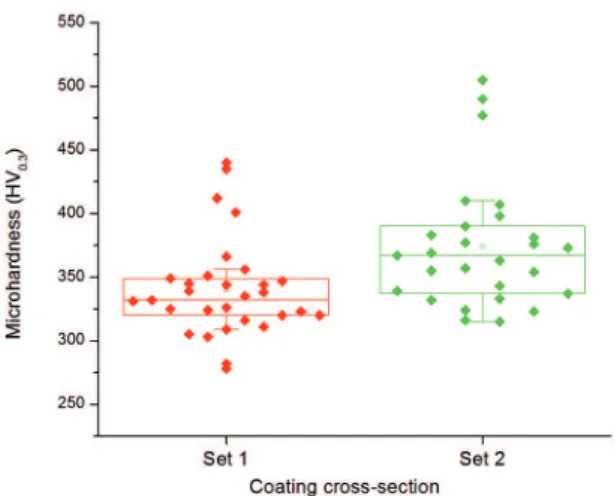
deformation. The box plot graph of the cross-section
microhardness, used to identify the outliers and to calculate the average microhardness of the undeformed
cross-section, is shown in Figure 7.
Vickers microhardness of UPS and CWHS specimens, measured at the top surface and cross-section of coatings (as an average of cross section measurements, excluding the outliers), Figure 8, also illustrate the effect of cold work deformation. CWHS specimens exhibited a higher
surface hardness, when compared to that measured at
cross-section of coatings. The undeformed condition of UPS specimens resulted on a surface hardness closer to that measured at the cross-section, unaffected by
the hardening at the surface. Assessing the penetration depth of the microhardness indentation confirms that microhardness at the surface of coatings is a reliable measure of the hardening caused by cold work. As observed and measured with an image analysis software,
cold work affected a thickness of ~100μm (Figure 5c),
whereas the depth of Vickers hardness indentation
(equation 4) on the surface of CWHS specimens is limited to a maximum of 5.35μm.
The higher hardness and the presence of slip lines
on CWHS specimens endorse the cold work hardening of the coatings. On the other hand, the similar hardness of UPS surfaces and cross-section of coatings together
with the absence of slip lines corroborate the undeformed
state of UPS coatings. Therefore, it is accepted that
subsequent testing of these surfaces can contribute to the understanding of the effect of deformed structures by cold work on the cavitation behavior.
3.2. Cavitation erosion behavior
Cavitation erosion behavior assessed by the variation
of the cumulative mass loss and erosion rate with cavitation
time is shown in Figure 9 (Set 1) and 10 (Set 2). Specimens CWHS 1 and 2 are represented in diferent graphs, (a) and (b),
to avoid superposition of data and keep legibility. As a base
for comparison, UPS data of graph (a) is repeated in graph (b). The erosion rate versus time curve for UPS, CWHS 1 and CWHS 2 specimens is presented in graphs (c), (d) and (e). To allow direct comparison of CWHS specimens, the maximum rate periods of all three specimens are represented in igure (f), along with the linear it equations used in the nominal incubation period and maximum erosion rate
calculation, Table 2.
Figure 3: Angle between edges of Vickers indenter17.
Figure 4: Geometry of the horn tip.
The hypothesis that the end of acceleration period in the
CWHS specimens is marked by the complete removal of the hardened layer is raised and assessed. For that purpose, the
mean depth of erosion at the end of the acceleration period is compared with the cold worked layer thickness. The mean depth of erosion MDE was calculated as described in
ASTM G32-10, considering a stainless steel density ds of 7.80g.cm-3, a cavitation area Ac of 2.75cm2 and mass losses
m (at the end of the acceleration period) of 3.4 and 2.53mg, respectively, for the CWHS specimens, equation 5.
( )
MDE
d A
m
5
s c
=
3. Results and Discussions
3.1 Surface starting condition
Figure 5: Presence of slip lines on top and cross-section of CWHS specimen, Fig. 5a and 5c, in contrast with its absence on the UPS specimen, Fig. 5b and 5d
Figure 6: Vickers microhardness proile on the cross-section of CWHS specimens, showing a hardness increase towards the surface.
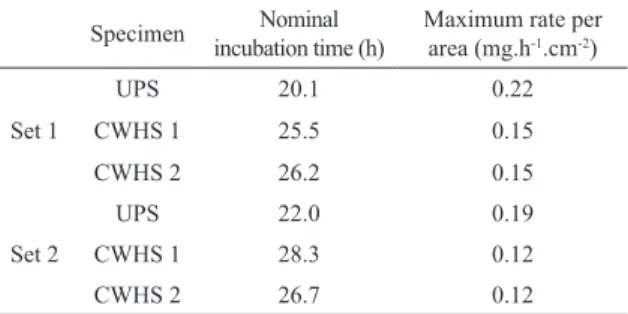
Results on Table 2 show that the nominal incubation time increases on deformed surfaces, in other words that
the onset of the maximum erosion rate is delayed. Cold
work deformation also contributed to a reduction in the
maximum erosion rate, which is in accordance with the
Figure 7: Indication of outliers in the cross-section microhardness of CWHS samples
Figure 8: Vickers microhardness measured at the surface of UPS and CWHS specimens and at the cross-section, unafected by the
cold work hardening at the surface
maximum erosion rate for sets 1 (~32%) and 2 (~37%).
Although this improvement in cavitation resistance is
expressive, cold-work hardening was reported to reduce the maximum erosion rate of a UNS S31803 austenitic stainless steel in 80%11. It is worth noting that the similar
performances of specimens CWHS 1 and 2, in each set (Table 2), indicate a satisfying repeatability of the experimental
procedures adopted.
Cavitation resistance can be said to increase because cold work deformation delays the onset of the maximum erosion rate and reduces its value. However, considering
the incubation stage a slight reduction on cavitation
resistance of CWHS specimens can be identiied Figure 9(a) and 10(a). In both sets, the advent of mass loss starts earlier in CWHS 1 than in UPS specimens (6 and 12hs for CWHS 1 specimens of set 1 and 2, as opposed to 10 and 16hs for the respective UPS specimens). Both these indings remain in accordance with the literature that
states an enhanced performance as the establishment of
the maximum erosion rate is postponed, but also with the hypothesis of the negative efect of deformation previous
to cavitation erosion that compromises the incubation time.
These conlicting observations require further evaluation
of the measured cavitation erosion. Detailed analyses of
Figure 9 and 10 show that the main impact of the initially
deformed structures is on the transitory stage between
the incubation period and the onset of maximum erosion rate, the acceleration period. Cold work surfaces exhibit a magniied acceleration period (approximately 14hs for UPS, 24hs for CWHS 1 and 20hs for CWHS 2 specimens, set 1, and approximately 14 for UPS, 30hs for CWHS 1 and 24hs for CWHS 2 specimens, set 2). This stage is the key to assess the efect of cold work hardening on the cavitation
behavior. As mentioned before the boundaries between each stage are scatter and the acceleration period might
end-up being incorporated into the nominal incubation time or in maximum erosion rate. If initial mass loss during the
acceleration period is considered negligible, it can easily be incorporated in the incubation period that will be assumed to
have increased. On the other hand, if part of the acceleration period is incorporated to the maximum-rate period, results
can indicate a false reduction in the erosion rate. Therefore, it can be shown that deformation of surfaces previous to cavitation erosion, as those caused by machining, result on an enhanced cavitation erosion behavior associated with
the expansion of the acceleration period and the delay of the onset of the maximum erosion rate.
Results might suggest that the end of the acceleration
period, when the onset of the maximum erosion rate is identiied, is related to the removal of the cold work
layer. In as much, it is important to correlate the erosion depth measured after the acceleration period and the
thickness of the cold work deformed layer as identiied on the transverse cross-section of coatings. The mean
depth of erosion measured at the end of the acceleration
period is approximately of 1.6 and 1.2μm for sets 1 and
2, respectively. These measurements are almost an order of magnitude lower than the total thickness of the cold worked hardened layer, indicating that the end of the acceleration period is not associated with the complete removal of the deformed layer. A better understanding is gained if one considers the events taking place during
the acceleration period that culminate on the maximum erosion rate. In the acceleration period the efect of erosion
mechanisms accounting for mass loss is less relevant than the accommodation of the deformation induced by shock waves that impact on the surface. As the test proceeds, the erosion mechanism becomes more important until that, at the end of the acceleration period, a balance between strain hardening mechanisms and the operating erosion mechanism during cavitation is achieved. This balance accounts for the constant erosion rate that characterizes
the maximum erosion rate in Figure 9 and 10.
Regarding the raised hypothesis to the efect of cold
Figure 9: Cumulative mass loss and erosion rate over cavitation time for UPS, CWHS 1 and CWHS 2 specimens of Set 1. Extension of the acceleration period induced by the cold work hardening efect
complete removal of the cold work deformed layer being
the trigger to the onset of maximum erosion rate, it is
possible to state that:
Cavitation resistance is enhanced because cold work deformation magniied the acceleration period, a transition stage between the incubation period and maximum erosion
rate;
The maximum erosion rate is reached as a balance
between strain hardening and acting erosion mechanisms
is established, event that is not related to the removal of the cold work deformed structure.
4. Conclusions
Under the conditions tested in this study, regarding the deformed structure produced by machining (cold work) on the cavitation erosion behavior of a FeCrMnSiB stainless
Figure 10: Cumulative mass loss and erosion rate over cavitation time for UPS, CWHS 1 and CWHS 2 specimens of Set 2. Extension of the acceleration period induced by the cold work hardening efect.
• The deformed structure produced by machining
magniied the acceleration period during cavitation
erosion, increasing the resistance to cavitation of the surface.
• Cold work deformation anticipated the onset of mass loss during cavitation.
• Cold work deformation postponed the onset of the
maximum erosion rate and indirectly increased the
nominal incubation time.
• Cold work deformation reduced the maximum erosion rate during cavitation.
• The end of acceleration period in cold work deformed surfaces is not marked by the complete removal of the deformed microstructure layer.
5. Acknowledgements
Table 2: Nominal incubation time and maximum erosion rate per area.
Specimen incubation time (h)Nominal Maximum rate per area (mg.h-1.cm-2)
Set 1
UPS 20.1 0.22
CWHS 1 25.5 0.15
CWHS 2 26.2 0.15
Set 2
UPS 22.0 0.19
CWHS 1 28.3 0.12
CWHS 2 26.7 0.12
support for this project. Special thanks go to Leandro João da Silva, M.Eng, for helpful discussions.
6. References
1. Brennen CE. Cavitation Bubble Collapse. In: Brennen CE.
Cavitation and Bubble Dynamics. New York: Oxford University Press; 1995. p. 79-112.
2. Duncan W Jr. Turbine Repair. In: Facilities Instructions, Standards & Techniques. Denver: United States Department of the Interior - Bureau of Reclamation; 1989. p. 1-65.
3. Steel Founders’ Society of America. Supplement 8 High Alloy Data Sheets Corrosion series.Steel Casting Handbook; 2004.
p. 1-93. [Cited 2015 Jun 10]. Available from: www.sfsa.org/ sfsa/pubs/hbk/s8.pdf
4. Materials for Propeller Fabrication. Rules for Classiication and
Construction: Materials and Welding. Hamburg: Germanischer Lloyd Aktiengesellschaft; 2009. p. 1-30. [Cited 2015 Jun 10].
Available from: http://www.gl-group.com/infoServices/rules/
pdfs/gl_ii-1-5_e.pdf
5. Morrow SJ. Materials Selection for Seawater Pumps. In: Proceedings of the Twenty-Sixth International Pump Users Symposium; 2010.
p. 73-80. [Cited 2016 Jul 19]. Available from: http://turbolab.
tamu.edu/proc/pumpproc/p26/ch09_Morrow.pdf
6. Francis R. Pumps and Valves. In: Guides to Good Practice in Corrosion Control. National Physics Laboratory; 2000. p. 1-11. [Cited 2015 Jun 10]. Available from: http://www.npl.co.uk/ upload/pdf/pumps.pdf
7. Niederhofer P, Huth S. Cavitation erosion resistance of high interstitial CrMnCN austenitic stainless steels. Wear. 2013;301(1-2):457-466.
8. Kim JH, Na KS, Kim GG, Yoon CS, Kim SJ. Efect of manganese
on the cavitation erosion resistance of iron–chromium–carbon–
silicon alloys for replacing cobalt-base Stellite. Journal of Nuclear Materials. 2006;352(1-3):85-89.
9. Ribeiro HO, Buschinelli AJA, Dutra JC, D’Oliveira ASCM. Resistência à erosão por cavitação de aços inoxidáveis austeníticos CrMnSiN depositados por PTA. Soldagem & Inspeção. 2010;15(2):121-129.
10. Cruz JR. Inluência do boro na resistência à cavitação de
revestimentos processados com pós atomizados e com misturas mecânicas de pós elementares de Fe-Cr-Mn-Si-B. [Dissertação de Mestrado]. Curitiba. Universidade Federal do Paraná; 2014.
11. Mesa DH, Garzón CM, Tschiptschin AP. Inluence of
cold-work on the cavitation erosion resistance and on the damage
mechanisms in high-nitrogen austenitic stainless steels. Wear.
2011;271(9-10):1372-1377.
12. Mills DJ, Knutsen RD. An Investigation of the tribological
behaviour of a high-nitrogen Cr-Mn austenitic stainless steel. Wear. 1998;215(1-2):83-90.
13. Santos JF, Garzón CM, Tschiptschin AP. Improvement of the cavitation erosion resistance of an AISI 304L austenitic stainless
steel by high temperature gas nitriding. Materials Science and Engineering: A. 2004;382(1-2):378-386.
14. Santa JF, Blanco JA, Giraldo JE, Toro A. Cavitation erosion
of martensitic and austenitic stainless steel welded coatings.
Wear. 2011;271(9-10):1445-1453.
15. Xiaojun Z, Procopiak LAJ, Souza NC, D’Oliveira ASCM. Phase transformation during cavitation erosion of a Co stainless steel. Materials Science and Engineering: A. 2003;358(1-2):199-204.
16. Yabuki A, Noishiki K, Komori K, Matsumura M. The Surface Behavior of Metallic Materials During the Incubation Period of Cavitation Erosion. In: Totten GE, Wills DK, Feldmann DG, eds. Hydraulic Failure Analysis: Fluids, Components,
and System Efects. ASTM STP 1339. West Conshohocken:
American Society for Testings and Materials; 2001. p. 357-369.
17. Franco Júnior AR, Pintaúde G, Sinatora A, Pinedo EC, Tschiptschin