Studying the electrical, thermal, and photocatalytic activity of nanocomposite of polypyrrole with the photoadduct of K3[Fe(CN)6] and diethylenetriamine
Syed Kazim Moosvia, Kowsar Majida*, Tabassum Araa
aDepartment of Chemistry, National Institute of Technology Srinagar-190 006, J & K, India
Received: December 24, 2015; Revised: May 10, 2016; Accepted: June 18, 2016
The present work reports the synthesis of nanocomposite of polypyrrole with [Fe(CN)3(dien)].H2O photoadduct via in-situ oxidative chemical polymerisation. Photoadduct was synthesised by irradiating an equimolar mixture of K3[Fe(CN)6] and diethylenetriamine (dien) using Osram photo lamp. The successful synthesis of photoadduct was proved by Elemental analysis, UV-Vis and FTIR spectra. Nanocomposite of photoadduct with PPY was then prepared by oxidative chemical polymerization using FeCl3 as oxidant. The successful synthesis of the nanocomposite was conirmed from FTIR,
XRD and SEM. The nanocomposite showed signiicant increase in thermal stability, dielectric constant
and ac-conductivity as compared to pure polypyrrole. The photocatalytic activity of the materials was also studied against the methyl orange (MO) dye under UV-Vis light and nanocomposite showed
eicient photocatalytic activity (91 % degradation after 2 hrs) than pure PPY which showed only 24% degradation of dye after 2 hrs. Thus as synthesised nanocomposite can be efectively utilised for the
removal of organic dyes.
Keywords: Polypyrrole (PPY), nanocomposite, photocatalytic study, thermal Study, electrical study.
1. Introduction
Conducting polymers have attracted a considerable attention from all polymer branches owing to their interesting technological applications such as energy storage devices, sensors, and strong EMI materials1.
However to make them technologically more viable, tuning of various physical and chemical properties is essential. For this purpose many conducting polymer/ inorganic composites have been made which show improved properties compared with those of pure conducting polymers or inorganic materials2. The
creation of polymer/ inorganic nanocomposites has attracted intensive research owing to their unique physical properties3. Properties such as environmental
stability, processibility, mechanical properties, solubility for processing and thermal stability can be enhanced by forming a polymer nanocomposite4. Conducting polymer
nanocomposites ind applications in batteries, molecular electronics, conducting paints and photovoltaic cells5.
Among organic conducting polymers, polypyrrole (PPY) is of special interest because of its easy preparation and unique properties such as excellent environmental stability and potential application in electronic devices6,7. Composites composed of PPY
with nanoparticles are currently of great research interest. In this direction, various composites of PPY have been synthesized with various organic, inorganic metal oxides, SWCNT, MWCNT, nanoparticles by
chemical or electrochemical route8. For instance PPY/
TiO2 nanocomposite exhibit photocatalytic activity9, nanocomposite of polypyrrole with silicon has been reported to show Li storage properties10, PPY/CNT
nanocomposite as electrode for supercapacitor11,
nanocomposite of PPY with nanoparticle has been reported to show enhanced thermal stability, dielectric constant and ac- conductivity12 etc. The aim of this
paper is to synthesise a nanocomposite of polypyrrole with nanophotoadduct of photoactive transition metal complex viz. potassium hexacyanoferrate(III) and diethylenetriamine (dien) ligand. Since nanophotoadduct contains both organic and inorganic ligands, can prove as potent iller and is expected to be able to make various augmentations in nanocomposite properties such as electrical, thermal and photocatalytic properties. SEM, XRD and FTIR spectra were used here to investigate the morphology and structure of the products.
2. Experimental
2.1. Chemicals
Materials used in this work were pyrrole (Himedia), potassium ferricyanide, anhydrous ferric chloride and diethylenetriamine (dien) all supplied by Loba chemicals. Pyrrole monomer was puriied by simple distillation. All the chemicals used in the experimental work were of analytical grade. Distilled deionised water was used throughout this work.
2.2. Physical measurements
UV-Vis absorption spectrum was obtained on double beam spectrophotometer (PG instruments T80). FTIR analysis was done by using Perkin Elmer RX–1, FTIR spectrophotometer by mixing the powder with dry KBr. Irradiation was done with Osram UV photolamp. SEM analysis was carried out by using Hitachi FE –SEM, Model S – 3600N. XRD pattern was obtained on PW 3050 base difractometer, operating with Cu-Kα radiations (λ = 1.54060Å). Dielectric study was carried out using Agilent 4285 A precision LCR meter at room temperature in the frequency range of 20Hz - 1MHz. For this purpose the powder was pressed into circular pellets of diameter 10 mm and thickness 2.35 mm. Silver paint was applied on both sides of the pellet and air dried to have good ohmic contact.
2.3. Synthesis of nanophotoadduct
The photoadduct of K3[Fe(CN)6] and diethylenetriamine (dien) was synthesised by irradiating an equimolar mixture of K3[Fe(CN)6] and dien in water for half an hour using Osram photolamp. The mixture was irradiated till the color changed from yellow to dark brown. This process was carried out in dark. The mixture was concentrated on water bath and cooled to room temperature. The product obtained was then recrystallized for puriication and was subjected to various spectroscopic and surface characterizations. The reduction of photoadduct to nanosize was done by ball milling using 30 zirconium balls of 5 mm size for 10 hrs at 450 rpm. The reduction of photoadduct to nanosize was conirmed from XRD.
2.4. Synthesise of PPY/ nanophotoadduct composite
Chemical method was used for the preparation of nanocomposite of PPY with nanophotoadduct in non-aqueous medium (Chloroform). FeCl3 was used as an oxidising agent. In a typical experiment, 0.055 mol FeCl3 in 180 ml of chloroform was added to the stirred solution of 0.022 mol (in 70 ml chloroform) of distilled pyrrole monomer drop wise. To this mixture 1g of nanophotoadduct was then added for nanocomposite formation. The mixture was kept stirring for 24 hours. After 24 hours product was iltered and was then washed several times with methanol in order to remove oligomers and impurities. The black powder was then dried at room temperature.
2.5 Photocatalytic activity
The photocatalytic eiciency of the PPY and its nanocomposite was studied for degradation of methyl
orange (MO) dye in presence of UV-Vis light using Mercury-Xenon arc lamp with the range of wavelength from 250 – 580 nm. The power of the lamp used was 470 watts. 0.4g of PPY and nanocomposite was suspended into the 50 ppm aqueous solution of MO (200ml). Prior to irradiation the suspension was stirred for some time in dark so as to attain adsorption – desorption equilibrium. Then the suspension was irradiated under Mercury-Xenon arc lamp. During irradiation stirring was maintained to keep the mixture in suspension. At the given time intervals 5 ml of sample were collected from the suspension and analysed by a UV-Vis double beam spectrophotometer (PG instruments T80). The absorbance of MO solution was recorded at a wave length of 500 nm.
3. Results and discussions:
3.1. UV -Visible characterization:
The UV-Vis spectra of an aqueous solution mixture of K3[Fe(CN)6]and diethylenetriamine shows two peaks at 230 nm and 417 nm before irradiation as shown in Figure 1(a). These peaks are assigned to charge transfer transitions13. After irradiation the spectra (Figure 1(b))
shows two peaks at λmax of 230 nm and 444 nm. Thus
a shift of peak from 417 nm to 445 nm has taken place which indicates some change in the energy levels of transition metal complex has taken place due to the incorporation of dien, hence indicates the successful photoirradiation and photosubstitution.
Figure 1: UV-Visible spectra of : aqueous solution of K3[Fe(CN)6]
and diethylenetriamine (dien) (a) before irradiation and (b) after irradiation.
3.2. Elemental analysis:
[Fe(CN)3(dien)].H2O. The observed percentage of C, N, and H are 32.79%, 32.83% and 5.65%, respectively, against the calculated percentages C = 32.58%, N =32.58%, and H = 5.82%.
3.3. FTIR Characterization
FTIR spectra of K3[Fe(CN)6], nanophotoadduct, PPY and nanocomposite are shown in Figure 2 (a-d). FTIR of K3[Fe(CN)6] as shown in Figure 2(a) exhibit peaks at (3464 cm-1, 1630 cm-1 ), (2118, 2076, 2043)
cm-1 and 511 cm-1 which are attributed to ν (OH) of
lattice water (symmetric and antisymmetric), δ(H-O-H), ν(C≡N) and ν (Fe-CN) vibrational modes respectively14.
The FTIR spectra of diethylenetriamine exhibits peaks at 3300 cm-1, 3000 cm-1, 1800 cm-1, 1600 cm-1, 1400
cm-1, 1200 cm-1, 900 cm-1. These peaks are assigned
to NH2 stretching vibration (ν-NH2), CH2 stretching vibration(ν-CH2), NH2 bending (δ- NH2), τ-CH2, CH2 bending (δ-CH2), CN stretching vibration ( ν-CN) & NH stretching vibration (ν-NH ) respectively15.
Figure 2: FTIR spectra of (a) K3[Fe(CN)6], (b) nanophotoadduct, (c) Polypyrrole and (d) nanocomposite.
The FTIR spectra of photoadduct as shown in Figure 2 (b) shows a broad peak at 3500 cm-1 owing to (NH
2,
NH and CH2) stretching vibrations. This peak is broad since H2O also gives a peak in the same the region
assigned to its symmetric vibration. Presence of water is also conirmed from the absorption peak at 1620 cm-1. The presence of water outside the coordination
sphere is also conirmed from thermal analysis, which shows a weight loss equivalent to one mole of water, observed at a temperature range of 28 °C to 103 °C. Peaks at 2043 cm-1 due to C≡N stretching, (1620,
1508) cm-1 due to (NH
2 bending, CH2 bending, CH2
wag, NH2 wag),1211 cm-1 due to CH
2 deformations
(1100,1000, 757 ) cm-1 due to skeletal stretching
vibration of C-C, C-N, 587 cm-1 due to N-C-C-N and
N-Fe-N bending vibration clearly indicate the presence of characteristic peaks of both K3[Fe(CN)6] and dien, though with some shifts, thus proving the successful formation of photoadduct.
Figure 2(c) shows the FTIR spectra of PPY. Polypyrrole exhibit characteristic peaks at 3391 cm-1,
1536 cm-1, 1444 cm-1, 1297 cm-1, 1041 cm-1, 784 cm-1
and 606 cm-1 which are attributed to ν (N-H), ν (C-C),
ν (C=C), ν (C-N), C-N in plane deformation mode, C-H & N-H in plane deformation vibration and C-H outer bending vibrations respectively. The insertion of photoadduct in the PPY matrix is evident by the appearance of a peak at 2084 cm-1 (Figure 2(d)),
which is due to ν (C≡N). This peak appears at 2043 cm-1 in the nanophotoadduct with a strong intensity.
This decrease in intensity and shifting of absorption peak by 41 cm-1 indicates the successful insertion of
nanophotoadduct in the polypyrrole matrix. Further the insertion of photoadduct in PPY is also evident by appearance of absorption peaks due to dien with some shifts. Such peak shifting is mainly attributed to the interaction between PPY and photoadduct. This interaction may cause high eiciency of charge separation and prompt synergistic efect to enhance the photocatalytic eiciency of PPY.
Thus from the discussion of FTIR spectra of K3[Fe(CN)6], nanophotoadduct, pure PPY and the nanocomposite of PPY with synthesised nanophotoadduct, the successful formation of photoadduct and its nanocomposite is evident.
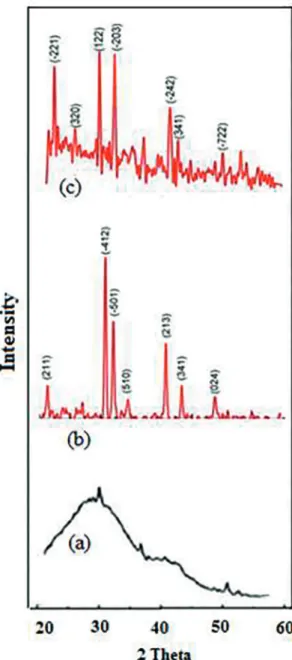
3.4. XRD
The XRD data has been analysed using powder X software. The XRD difraction pattern of PPY, nanophotoadduct and nanocomposite is shown in Figure 3 (a-c) respectively. PPY shows a hump at 2 theta value of 30° which indicates its amorphous nature16. The appearance
full width at half maximum and θ is the Bragg angle. The average crystallite size of the nanophotoadduct and nanocomposite comes out to be 20 nm and 19 nm respectively.
3.5 SEM characterization
Figure 4(a-c) shows the SEM micrographs of nanophotoadduct, PPY and its nanocomposite respectively. SEM micrograph of photoadduct shows lat like crystals of irregular shapes. SEM micrograph of pure PPY shows grooves and spongy nature. However, the SEM of composite exhibits compact nature due to encapsulation of photoadduct within the matrix. This shows the successful formation of composite.
3.6. Thermal analysis
TGA of PPY shows two transitions as shown in Figure 5 (a). The irst one which starts soon after ambient temperature with a weight loss of 3% may be attributed to the loss of embedded moisture. The second transition starts from 250 °C and ends at 580 °C with a weight loss of 100% and is due to the degradation of whole polymer chain17. The TG curve of photoadduct
shows three transitions as shown in Figure 5(b). The irst transition from 28 °C to 103 °C with a weight loss of 6.9% corresponds to the loss of one mole of water and is in accordance with the calculated weight loss of 7%. The second transition starts from 103 °C and ends at 258 °C with a weight loss of 19.5 % may be due to the loss of N2H4 and NH3, released by the degradation of dien ligand. This transition is in accordance with the calculated weight loss of 19.2%. The third transition starts from 547 °C and ends at 853 °C. This transition corresponds to the weight loss of 52.5 % and may be due to the loss of three molecules of HCN and two C2H2 moieties. This is in accordance with the calculated weight loss of 52.1%. The rest is the residue left. The thermogram of nanocomposite shows three main transitions as shown in Figure 5 (c). The irst transition from ambient to 62°C with a weight loss of 8% can be attributed to the loss of moisture. The second transition starts from 62 °C and ends at 260 °C with a weight loss of about 26 % and may be due to the loss of ligand moiety form photoadduct. Then thermogram runs parallel up to 537°C where from a steep decomposition takes place till 838°C which may be due to the degradation of polymer chain and then it again runs parallel. From these results it is clear that the thermal stability of nanocomposite has signiicantly increased as compared to pure PPY. This conirms that the presence of photoadduct is responsible for the high thermal stability of nanocomposite in comparison with pure PPY.
Figure 3: XRD of (a) PPY (b) nanophotoadduct (c) nanocomposite.
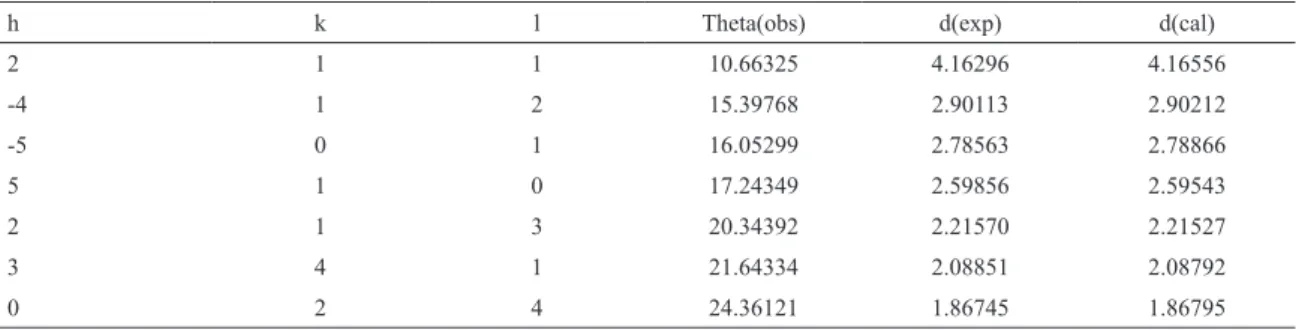
= 106.3) obtained after reinement shows monoclinic structure of nanophotoadduct. The lattice parameters obtained for nanocomposite after reinement are a = 13.96298, b = 10.36719, c = 8.339, α = γ = 89.5 and β = 106.5). Thus the monoclinic structure of photoadduct is retained in the nanocomposite. The value of calculated d spacing is in agreement with the experimental d spacing as shown in table 1.1 and 1.2 respectively. The average crystallite size of nanophotoadduct and nanocomposite was calculated using Scherrer formula;
/
cos
( )
D
=
K
m b
i
1
/
( )
IxL
VxA
2
v
=
6
]
g
]
g
@
’’
’
tan
( )
4
f
=
f
d
’
C d
p/
A
( )
3
f
=
f
c
’’
( )
v
2
5
ac
r f
v
=
Table 1.1: Parameters evaluated from XRD of nanophotoadduct of potassium hexacyanoferrate(III) with diethylenetriamine.
h k l Theta(obs) d(exp) d(cal)
2 1 1 10.66325 4.16296 4.16556
-4 1 2 15.39768 2.90113 2.90212
-5 0 1 16.05299 2.78563 2.78866
5 1 0 17.24349 2.59856 2.59543
2 1 3 20.34392 2.21570 2.21527
3 4 1 21.64334 2.08851 2.08792
0 2 4 24.36121 1.86745 1.86795
Table 1.2: Parameters evaluated from XRD data of nanocomposite of PPY with nanophotoadduct of potassium hexacyanoferrate(III) with diethylenetriamine.
h k l Theta(exp) d(exp) d(cal)
-2 2 1 11.33226 3.92847 3.92643
3 2 0 13.00917 3.42192 3.42347
1 2 2 15.00638 2.97497 2.97678
-2 0 3 16.23697 2.75490 2.75885
-2 4 2 20.72989 2.17622 2.17724
3 4 1 21.38762 2.11229 2.11218
-7 2 2 25.02207 1.82118 1.82121
3.7. Electrical Studies
I-V characteristics of PPY and its nanocomposite recorded at room temperature are found to show ohmic behaviour as shown in Figure 6 (a & b). From the I-Vcurves of PPY and its nanocomposite the values of dc electrical conductivity (σ) have been calculated by using the following relation18.
where I is the current, V is the voltage, L is the thickness and A is the cross-section area of sample. The dc conductivity at room temperature in case of PPY and its nanocomposite comes out to be 5.38 ×10⁻⁷ S cm-1 and
4 × 10⁻⁶ S cm-1 respectively. Thus nanocomposite shows
enhanced conductivity in comparison to PPY which can be attributed to the compactness and ordered structure of nanocomposite as is also evident from SEM and XRD.
3.8. Dielectric study:
Dielectric response of synthesised nanocomposite of PPY has been carried out by Agilent 4285A precision LCR meter as a function of frequency in the range of 20Hz-1MHz. Figure 7 (a-d) shows variation of ɛ′, ɛ″,
dielectric loss (tan δ), and ac conductivity (σac) with
the frequency of applied electric ield. The parameters have been calculated by using following relations:
where Cp is the capacitance, d is the thickness of sample, ɛͦ is the permittivity of the free space (ɛͦ = 8.854
× 10-12F/m), and A is the efective area.
Figure 7 (a & b) depicts the frequency dependence of both real and imaginary part of dielectric constant. It is observed that dielectric constant decreases with increase in frequency. The decrease in dielectric constant is sharp initially from 20 Hz to 103 Hz and
then decreases slowly with increase in frequency and shows almost frequency independent behaviour at higher frequency region. The variation of dielectric constant with frequency may be explained on the bases of space charge polarization phenomenon19. At higher frequencies the value of dielectric constant remains almost constant; this is natural as the polarization of the induced moment could not synchronize the applied electric ield at higher frequencies.
Variation of tan δ with frequency is shown in Figure 7. (c). It is observed that the tan δ shows a decreasing trend with increase in frequency. It is evident from the graph that the loss decreases rapidly in low frequency region and slowly in the higher frequency region. The low loss values at higher frequencies (0.85 at 106 Hz)
show the potential applications of nanocomposite in high frequency microwave devices.
Figure 7 (d) shows the variation of ac - conductivity at room temperature with frequency in the range of 20 Hz to 1 MHz. The ac - conductivity increases with increase in frequency. The frequency dependent behaviour can be explained on the bases of interface charge polarisation (Max-well Wagner-Sillars efect)20.
% Degradation
C
C
C
t100
0 0
#
=
-Figure 4: SEM micrographs of (a) nanophotoadduct (b) PPY (c) nanocomposite.
Figure 5: TGA of (a) PPY (b) nanophotoadduct (c) nanocomposite.
metal-polymer composites due to the accumulation of charges carriers at the interfaces. T.K Vishnuardhan et al have reported that the ac - conductivity of pure PPY is 1.26 × 10⁻⁴ S/cm at 105 Hz21. Nanocomposite
shows higher ac-conductivity (2.46×10⁸ S/m at the
same frequency) than pure polymer. The improvement of ac-conductivity for nanocomposite comes from the efective dispersion of nanophotoadduct in the PPY matrix (shown in SEM images), which might encourage the formation of a more eicient network for charge transport in the polypyrrole matrix, resulting in higher conductivities.
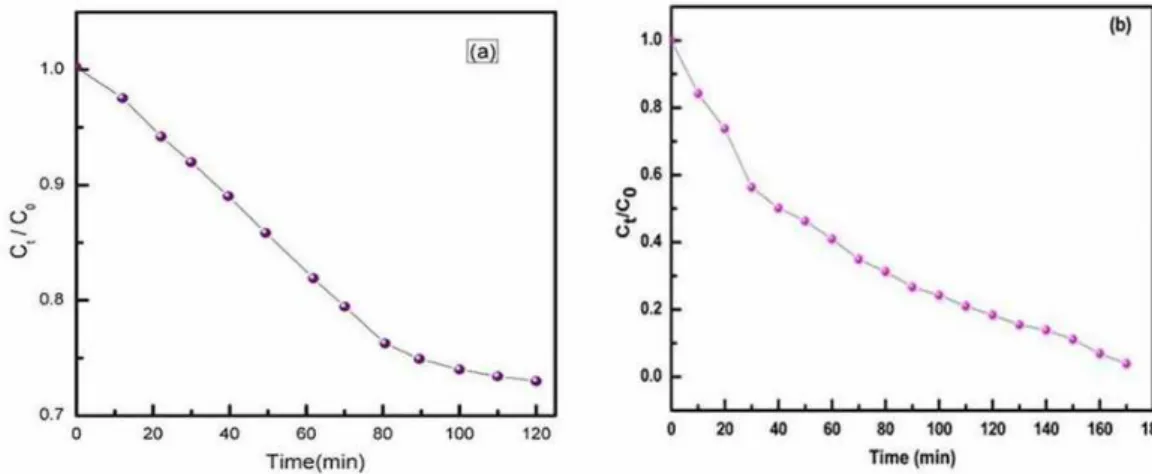
3.9. Photocatalytic activity
In order to investigate the photocatalytic activity of nanocomposite, the photodegradation experiment of MO dye under UV-Vis light was carried out.
The percentage dye degradation was calculated using the formula
Prior to irradiation the suspension of catalyst and dye was stirred in dark for 50 minutes so as to attain adsorption-desorption equilibrium between the catalyst and the dye. Figure 8 (b) shows the adsorption of dye is quite rapid in the irst 30 minutes and then rises slowly with increase in adsorption time which indicates the attainment of adsorption-desorption equilibrium. It is clear from the Figure 8 (b) that the concentration of MO dye decreases with the irradiation time. The photocatalytic eiciency of nanocomposite is 91% in 2 hrs irradiation time which is far higher than pure PPY (Figure 8 (a)) which shows only 27% in 2 hrs irradiation time. The enhancement in dye degradation can be attributed to the synergistic interaction between PPY and nanophotoadduct which improves the charge transfer due to increased surface area of nanocomposite. The photocatalytic activity begins with the generation of electron hole pairs in the catalyst under UV-Vis light. These photoelectrons and holes form powerful oxidising species like O2•‾,
•OH, and HO•
2 etc. by reacting with the adsorbed
O2, OH- andH
2O. The radical species (O2
•‾,•OH, and
HO•
2) thus generated degrade the MO dye adsorbed
on the catalyst surface into small molecules like CO2 and H2O22. Thus the reason for the enhanced
photocatalytic activity of nanocomposite might be due to the increased charge separation and the generation of oxyradicals (O2•‾,•OH and HO•
2).
Figure 6: I-V characteristics of (a) PPY (b) nanocomposite.
Figure 7: Variation of (a) real permittivity (b) imaginary permittivity (c) tangential loss (d) ac- conductivity with frequency.
C0 and Ct are the concentration of MO dye at time 0 and t, respectively. The Kobs is the observed pseudo irst-order rate constant and t is the reaction time. The value of kobs for nanocomposite is 7.62 × 10⁻³ and for
PPY is 2.4 × 10⁻³ which clearly indicates the enhanced
photocatalytic activity of nanocomposite as compared to PPY. Thus nanocomposite can be applied as an efective photocatalyst for the degradation of organic dye pollutants.
4. Conclusion
A nanocomposite of PPY and [Fe(CN)3(dien)].H2O photoadduct was successfully synthesised which was conirmed from FTIR, XRD and SEM characterization techniques. The nanocomposite showed enhanced thermal stability & electrical properties. The nanocomposite also exhibited good photocatalytic activity against MO dye degradation.
5. Acknowledgement
The authors are thankful to Prof Rajat Gupta, Director NIT Srinagar, for help and support.
6. References
1. John H, Thomas RM, Jacob J, Mathew KT, Joseph R. Conducting polyaniline composites as microwave absorbers. Polymer composites. 2007;28(5):588-592.
2. Mispa KJ, Subramaniam P, Murugesan R. Studies on ion-exchange properties of polyaniline Zr(IV) tungstoiodophosphate nanocomposite ion exchanger. Journal of Polymers. 2013;2013:356058. 3. Deivanayaki S, Ponnuswamy V, Mariappan R, Jayamurugan P.
Synthesis and characterization of polypyrrole/TiO2 composites by chemical oxidative method. Optik - International Journal for Light and Electron Optics. 2013;124(12):1089-1091. 4. Uygun A, Yavuz AG, Sen S, Omastová M. Polythiophene/SiO2
nanocomposites prepared in the presence of surfactants and their application to glucose biosensing. Synthetic Metals.
2009;159(19-20):2022-2028.
5. Wang H, Lin T, Kaynak A. Polypyrrole nanoparticles and dye absorption properties. Synthetic Metals. 2005;151(2):136-140. 6. Wei S, Mavinakuli P, Wang Q, Chen D, Asapu R, Mao Y,
et al. Polypyrrole-titania nanocomposites derived from
diferent oxidants. Journal of the Electrochemical Society. 2011;158(11):K205-K212.
7. Lu X, Chao D, Chen J, Zhang W, Wei Y. Preparation and characterization of inorganic/organic hybrid nanocomposites based on Au nanoparticles and polypyrrole. Materials Letters. 2006;60(23):2851-2854.
8. Majid K, Tabassum R, Shah AF, Ahmad S, Singla ML. Comparative study of synthesis, characterization and electric properties of polypyrrole and polythiophene composites with tellurium oxide. Journal of Materials Science: Materials in Electronics.
2009;20(10):958-966.
9. Luo Q, Li X, Wang D, Wang Y, An J. Photocatalytic activity of
polypyrrole/TiO2 nanocomposites under visible and UV light.
Journal of Materials Science. 2011;46(6):1646-1654. 10. Chew SY, Guo ZP, Wang JZ, Chen J, Munroe P, Ng SH, et al.
Novel nano-silicon/polypyrrole composites for lithium storage.
Electrochemistry Communications. 2007;9(5):941-946.
11. Lu X, Dou H, Yuan C, Yang S, Hao L, Zhang F, et al. Polypyrrole/ carbon nanotube nanocomposite enhanced the electrochemical
capacitance of lexible graphene ilm for supercapacitors. Journal of Power Sources. 2012;197:319-324.
12. Varshney S, Singh K, Ohlan A, Jain VK, Dutta VP, Dhawan SK. Synthesis, characterization and surface properties of Fe2O3 decorated ferromagnetic polypyrrole nanocomposites. Journal of Alloys and Compounds. 2012;538:107-114.
13. Alexander JJ, Gray HB. Electronic structures of hexacyanometalate complexes. Journal of the American Chemical Society.
1968;90(16):4260-4271.
14. Nakagawa I, Shimanouchi T. Infrared spectroscopic study on the co-ordination bond-II: Infrared spectra of octahedral metal cyanide complexes. Spectrochimica Acta. 1962;18(1):101-113. 15. Yao W, Yu SH, Jiang J, Zhang L. Complex wurtzite ZnSe
microspheres with high hierarchy and their optical properties.
Chemistry (Weinheim an der Bergstrasse, Germany). 2006;12(7):2066-2072.
16. Upadhyay J, Kumar A. Investigation of structural, thermal and dielectric properties of polypyrrole nanotubes tailoring with silver nanoparticles. Composites Science and Technology.
2014;97:55-62.
17. Najar MH, Majid K. Nanocomposite of polypyrrole with the nanophotoadduct of sodium pentacyanonitrosylferrate(II) dihydrate and EDTA: A potential candidate for capacitor and a sensor for HF radio wave detection. Synthetic Metals. 2014;198:76-83. 18. Shaktawat V, Jain N, Saxena R, Saxena, NS, Sharma TP. Electrical
conductivity and optical band gap studies of polypyrrole doped
with diferent acids. Journal of Optoelectronics and Advanced Materials. 2007;9(7):2130-2132.
19. Farid MT, Ahmad I, Aman S, Kanwal M, Murtaza G, Ali I, et al.
Structural, electrical and dielectric behaviour of Nixco1-xNdyFe2 -yO4 nano-ferrites synthesized by sol-gel method. Digest Journal
of Nanomaterials and Biostructures. 2015;10(1):265-275. 20. Irfan M, Shakoor A, Ali B, Elahi A, Tahira, Ghouri MI, et al.
Structural and dielectric properties of polyaniline/TiO2 Nano-composites. European Academic Research. 2014;2(8):10602-10621. 21. Vishnuvardhan TK, Kulkarni VR, Basavaraja C, Raghavendra SC. Synthesis, characterization and a.c. conductivity of polypyrrole/Y2O3 composites. Bulletin of Materials Science.
2006;29(1):77-83.
![Figure 1: UV-Visible spectra of : aqueous solution of K 3 [Fe(CN) 6 ] and diethylenetriamine (dien) (a) before irradiation and (b) after irradiation.](https://thumb-eu.123doks.com/thumbv2/123dok_br/18882622.423023/2.765.395.692.682.904/figure-visible-spectra-aqueous-solution-diethylenetriamine-irradiation-irradiation.webp)
![Figure 2: FTIR spectra of (a) K 3 [Fe(CN) 6 ], (b) nanophotoadduct, (c) Polypyrrole and (d) nanocomposite.](https://thumb-eu.123doks.com/thumbv2/123dok_br/18882622.423023/3.765.75.365.498.944/figure-ftir-spectra-fe-cn-nanophotoadduct-polypyrrole-nanocomposite.webp)