© 2016 IBRACON © 2016 IBRACON
Hourglass-shaped specimen: compressive strength
of concrete and mortar
(numerical and experimental analyses)
Corpo de prova na forma de ampulheta: resistência
à compressão de concretos e argamassas
(análises numérica e experimental)
a Civil Construction, Academic Unit 1, Federal Institute of Paraíba, João Pessoa, PB, Brazil; b Department of Civil Engineering, Federal University of Paraíba, João Pessoa, PB, Brazil; c Department of Materials Engineering, Federal University of Paraíba, João Pessoa, PB, Brazil.
Received: 28 Nov 2015 • Accepted: 03 Mar 2016 • Available Online: 12 Jul 2016
U. T. BEZERRA a
S. M. S. ALVES a [email protected]
N. P. BARBOSA b [email protected]
S. M. TORRES c [email protected]
Abstract
Resumo
Cylindrical specimens whose diameter is equal to half its height have been used worldwide. The statistical scattering in experimental testing of cementitious materials is a phenomenon known in literature and one reason is linked to the geometry of the specimens, which implies the
possibil-ity of diferent failure modes. This paper shows the evaluation of an hourglass-shaped sample , in which the highest stress occurs at the centre of the specimen, with negligible inluence of stress distribuition from its ends. An amount of 260 cylindrical and hourglass samples were tested,
with varying water/cement ratio and age. FEM analyses showed that stress in the central part of the hourglass specimens is 2.25 higher than that
present at its ends. Modes of failure occured in diferente ways in cylindrical specimens, whereas only one mode of failure was veriied in hourglass specimens. The cylindrical samples showed bimodal frequency distribution, demonstrating the inluence of the central part (material properties)
and of its ends (boundary conditions), while the hourglass displayed a Gaussian distribution.
Keywords: hourglass, specimen geometry, compressive strength, cementitious material, FEM.
Corpos de prova cilíndricos com diâmetros iguais à medtade da altura tem sido empregados em todo o mundo. A dispersão estatística de re-sultados em experimentos com materiais cimentícios é um fenômeno conhecido da literatura e uma das razões deste fenômeno corresponde à geometria dos corpos de prova, o que pode explicar a ocorrência de diferentes modos de ruptura. Este trabalho mostra a avaliação de corpos de
prova na forma de ampulheta, com a imposição de que tensões de ruptura ocorram em sua parte central, tornando desprezível a inluência das
condições de contorno de suas extremidades (pratos da máquina universal de ensaios). Um total de 260 corpos de prova cilíndricos e na forma de ampulheta foram testados, variando-se o fator água/cimento, empregando concreto e argamassa além da variação das dimensões dos corpos de
prova. O método dos elementos initos foi emprgado para analisar as tensões despertadas nos modelos. As análises mostraram que as tensões
máximas ocorrem na parte central das amostras de ampulheta com valor 2,25 maior do que as tensões despertadas em suas extremidades. Os ensaios mostraram que ocorreram diferentes modos de ruptura nas amostras cilíndricas, enquanto que nas amostras na forma de ampulheta um único modo de ruptura foi observado. Além disso, enquanto as amostras cilíndricas mostraram distribuições de Gauss bimodais para as
frequên-cias dos resultados, o que parece demonstrar a inluência da propriedade do material (parte central) e a inluência dos pratos da máquina de en -saiso (condições de contorno), as amostras na forma de ampulheta apresentaram sempre distribuições de Gauss unimodais para os resultados.
1. Introduction
“One naturally wonders who or what people irst discovered that
lime, when burnt and slaked with water, together with sand as an additive, can be used as a mortar. The answer has to be: we will never know - it just happened”. This inquiry, spoken by Hamelau [1], may very well be paraphrased as the problem of this paper and be rewritten as: “one naturally wonders who or what engineer or
institution irst established that the geometry of the specimens of
cementitious material should be a cube or a cylinder? The answer has to be: we will never know - it just happened”. Of course there are some names, institutions and curiosities in this story; after all, it is not as old as the invention of mortar. In 1836, in Germany, the
irst tests to evaluate mechanical properties of cementitious materi -als began. So, that country has shown itself as a great center of research in mechanical properties of cementitious materials from the mid-nineteenth century [2].
From the historic and pleasant testimony of Professor Antonio Car-los Reis Laranjeiras [3], who personally experienced some of the historical moments of the engineering in Europe, this paper was
able to approach something of what happened during the deinition
of the geometry of specimens for cementitious materials.
The adoption of specimens for mechanical tests with diferent geo -metries occurred at the beginning of last century. The cubic form was adopted initially in Germany, where there is an extensive tra-dition regarding early studies on concrete technology. The initial idea was to obtain a specimen with surfaces perfectly parallel for being submitted to compressive testing. Turns out that a 15-cm-sided cube had an excellent parallelism of its faces. For concretes and machines of that period, these dimensions appeared to be adequate, because larger dimensions was not able to be used, due to the machines’ capacity.
The United States school, however, followed another pattern. They adopted the cylindrical form, with larger ease of confection, once it does not run the risk of developing heterogeneous density as it is typical at edges of a cubic form. However, for this form, it still
appeared the problem of top surface inishing, that generally beco -mes irregular, and it is frequently necessary to correct it by adding molten sulfur or cement paste on such surface.
Early in the 20th century, the cylinder with height/diameter ratio equal to one proved to be inadequate, because the failure modes
were strongly inluenced by the friction of the machine plates on
the surfaces of the specimens. Then, the German engineer Hubert Rüsch conducted studies about slenderness and determined that the value of 2 was the most appropriate relationship between the height and diameter of the specimen. The idea of Rüsch was that the planes of rupture did not pass by the machine plates. Even though it was a reasonable approach, many specimens had (and still have) a tendency to break through their extremities, making it
diicult to determine the actual value of the material strength. The
other problem concerning cylindrical samples preparation, related
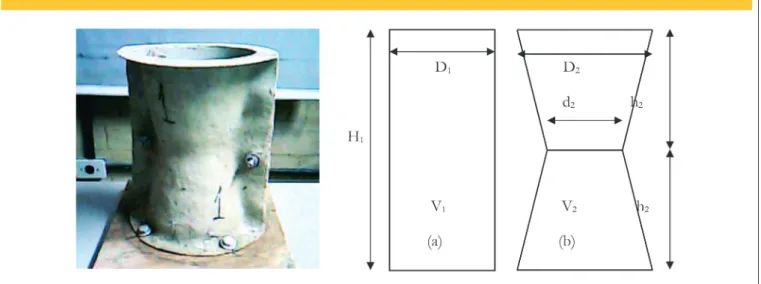
to the surface inishing, was recently solved by simply putting a lid
on the top of the form (Figure 1 (a)) and positioning it horizontally (Figure 1 (b)). With this, a slight edge over the height of the spec-imen is produced, but this does not compromise its cross section,
because the reduction produced is insigniicant.
In the course of time, several researchers have studied new ge-ometries that could alter some of the peculiarities in concrete compressive strength tests as well as others aspects of materials.
Figure 1 – Specimens with lid in
vertical (a) and horizontal (b) positions
B
A
512 IBRACON Structures and Materials Journal • 2016 • vol. 9 • nº 4
Hampel et al. [4] and Pivonka et al. [5] performed studies on pre-diction of failure mode in concrete samples (Figure 2). However, they neglected to account for the friction between the loading
plat-ens and the specimen (a procedure that signiicantly simpliies the structural analysis, but does not solve the problem of the inluence from the extremities). Because the Poisson efect [6], in the contact
platen-specimen friction, stresses necessarily arise due to the dif-ference of freedom to deformation of the central part of the speci-men and the restriction of its ends. These stresses are negligible in the case of samples of high slenderness, which was considered at the time of the choice of height/diameter ratio of 2 (cylindrical form). However, for this relationship, another problem comes out,
which is the beginning of the efects of buckling, studied by Leon
-ard Euler in the 18th century [7]. So, it is not easy to ind a geom -etry that does not present limitations (i.e., engineering should be
content with a geometry that has fewer problems, instead of an ideal geometry).
Another question, addressed by Bažant and Becq-Giraudon [8],
refers to the evaluation of cross sections subjected to compressive
stress by the fracture mechanics of Griith. From the analysis of
some accidents involving concrete structures, these researchers have proposed a way to predict the fracture energy of concrete from the compressive strength, size of aggregates, etc.
Speciically focused on failure modes of high strength concrete,
several researchers evaluated both cubic and cylindrical samples, like Tue and Tung [9], Vonk [10] and Viso et al. [11], observing that
the irst break with a format similar to an hourglass, and the latter
tends to a plan that breaks across the ends (Figure 3).
In research conducted on the fatigue behavior of metals (through alternating cycles of compression and tension), Miwa et al. [12]
1 http://www.mathworks.com - Student version.
2 Licensed Software to Santa Catarina Federal University. Mix System is a system developed by Engineer Ricardo Sergio Pinheiro Medeiros and marketed by TQS Informática Ltda.
A
B
C
Figure 4 – Cylindrical failure modes according to Brazilian standard [14])
Conic Shear-conic Shear-diagonal Shear; and Column-like
B
B
B
B
B
analyzed modiied cylindrical specimens of small dimensions. The
novelty of such work is that the specimen geometry is the hourg-lass shape.
There are several important factors that afect the assessment
of such strength, namely: (i) stress rate; (ii) height-to-base ratio; (iii) surface-related defects of the specimens such as planar-ity, parallelism and horizontality of the contact faces and also (iv) contact-related defects such as frictions and roughness be-tween specimens and machine surfaces. Geometry of testing
specimens also afects the assessment of the actual strength
of the material. For instance, compressive strength determined by cubic specimens is almost 15 % higher than that obtained in cylindrical ones [13]. Under compressive loads, it has been shown that most failure patterns in cylindrical samples follow an hourglass shape due to shear stress, which direct cracking
propagation orientated 45º in relation to the load direction [6].
However, there are several instances when crack proiles do not
necessary follow such trend, which is evidently due to geometric features rather than intrinsic properties of the materials. Indeed, as pointed out by the Brazilian standard NBR 5739 – 1994 [14],
it is expected that cylindrical specimens might fail in at least ive
possible ways, as shown in Figure 4. In these modes, it is pos-sible to see the cracks generally pass through the contact fac-es in all modfac-es with just one exception. This might corroborate
the view that the strength distribution can be greatly afected by
contact factors as pointed out earlier.
In the book Estructuras de Hormigon Armado (Spanish for Rein-forced Concrete Structures), the Russian authors Sigalov and Bay-kov [15] analysed an interesting illustration (Figure 5) which deals with how specimens are subjected to compressive stress break.
Figure 5 – Failure modes of cubic specimens (from [15])
With friction between the plates Without friction between the plates
B
B
A
B
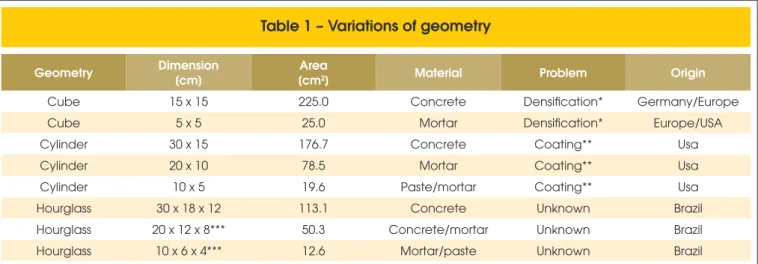
Table 1 – Variations of geometry
Geometry Dimension
[cm]
Area
[cm2] Material Problem Origin
Cube 15 x 15 225.0 Concrete Densification* Germany/Europe
Cube 5 x 5 25.0 Mortar Densification* Europe/USA
Cylinder 30 x 15 176.7 Concrete Coating** Usa
Cylinder 20 x 10 78.5 Mortar Coating** Usa
Cylinder 10 x 5 19.6 Paste/mortar Coating** Usa
Hourglass 30 x 18 x 12 113.1 Concrete Unknown Brazil
Hourglass 20 x 12 x 8*** 50.3 Concrete/mortar Unknown Brazil
Hourglass 10 x 6 x 4*** 12.6 Mortar/paste Unknown Brazil
514 IBRACON Structures and Materials Journal • 2016 • vol. 9 • nº 4 In this igure, it is possible to see the characteristic bi-cone of
rupture in the case (a). Thus, from observation of natural rup-ture in cubic and cylindrical specimens, and with the literatu-re literatu-refeliteratu-rences, this work deals with the modeling of concliteratu-rete specimens in an hourglass shape to evaluate the compressive strength.
So, even with the elimination and/or reduction of some pro-blems presented by the geometry and form of preparation of specimens over the 20th century (and also in the beginning of this one), an unsolved problem still remains: what to do for the boundary conditions (edges) have no influence in the measu-res of the compmeasu-ressive strength of cementitious materials? Or else: how to make the platens of the machines do not interfere in the magnitude of the compressive strength of cementitious materials?
This study proposes a new geometry for the molds to cast specimens of cementitious materials, incorporating the solu-tions obtained during the 20th century, and significantly redu-cing the problems from the influence of boundary conditions.
2. Materials and experimental program
Variations in geometry experienced in the last century are summarized in Table 1. It can be seen that the cubes
predomi-nate in Europe, while the cylinders are mostly present in the Americas.
In the last lines of the Table 1 (in bold typing), three new geom-etries of specimens that are proposed in this paper, for testing cementitious materials, are included.
2.1 Materials
Concrete and mortar with Portland cement CP II (equivalent to Pozzolan-Modified Portland Cement type I (MP) of the ASTM classification) were prepared (quartz sand, granitic coarse ag-gregate and potable water were used). The mold releasing was made 24 hours after casting the samples, followed by water curing until 7 and 28 days (after tests) at room temperature. The strength was determined by dividing the force by the area (half height) of the samples. The data was analyzed by Gauss-ian curve [16] fitted with least square method.
2.2 Experimental approach
Two shapes were used: (i) cylinder and (ii) hourglass shape (details in Figure 6 and Table 2).
For higher dimension specimens, adopted for concrete, a vari-ation of water/cement ratio was used to analyze the difficulty in
Figure 6 – Hourglass mold made by fiberglass and polyester. Cylinder (a) and hourglass (b)
Table 2 – Characteristics of geometries tested
Geometry Material Mold H1
[cm]
h2 [cm]
D1 [cm]
D2 [cm]
d2 [cm]
Aextreme [cm2]
Acentre [cm2]
V1 [cm3]
2V2 [cm3]
Cylinder Mortar Steel 10.00 – 5.00 – – 19.63 – 196.35 –
Hourglass Mortar Acrylic 10.00 5.00 – 3.00 2.00 28.27 12.57 – 198.97
Cylinder Concrete Styren 20.00 – 10.00 – – 78.54 – 1570.80 –
accomplishing densification of concrete in the hourglass mold type, due to necking of the central section.
For the mortars, 20 specimens for each age (7 days and 28 days) were casted. For concrete, due to its natural heterogene-ity, 30 specimens of each condition were prepared. Czarnecki
et al. [17] conducted statistical studies on concrete specimens, and adopted the quantity of 36 as an adequate number of tests,
considering distribution of T-test (signiicance level of 95%).
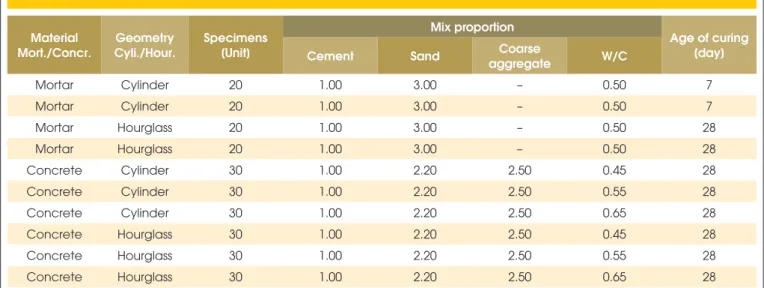
The mixes used for the preparation of the specimens are listed in Table 3.
Concerning the difficulty of casting, the traditional procedure, specified in the Brazilian Standard (12 strokes per layer for a total of 2 layers), fits satisfactorily in the hourglass shape specimens, for those prepared with both high and low water/ cement ratio (0.65 and 0.45).
2.3 Numerical approach
Numerical simulation was carried out by means of Finite El-ement Method (FEM), using the Structural Analysis Program (SAP) software and Ritz method (brick Wilson formulation) [18, 19]. The material was assumed to be perfectly elastic, with modulus of elasticity of 30 GPa, and Poisson’s ratio of 0.2. The discrete FEM models for both geometries can be seen in Figure 7.
On the top and bottom of the samples, the joint horizontal displacements were restricted. On the bottom, even vertical displacements were restricted. In all the other nodes, all 6 de-grees of freedom were released. This procedure allows the Poisson’s effect, which is compatible with the actual testing of compressive strength, practiced in laboratories.
Table 3 – Geometries – mix proportion of tested samples
Material Mort./Concr.
Geometry Cyli./Hour.
Specimens [Unit]
Mix proportion
Age of curing [day]
Cement Sand Coarse
aggregate W/C
Mortar Cylinder 20 1.00 3.00 – 0.50 7
Mortar Cylinder 20 1.00 3.00 – 0.50 7
Mortar Hourglass 20 1.00 3.00 – 0.50 28
Mortar Hourglass 20 1.00 3.00 – 0.50 28
Concrete Cylinder 30 1.00 2.20 2.50 0.45 28
Concrete Cylinder 30 1.00 2.20 2.50 0.55 28
Concrete Cylinder 30 1.00 2.20 2.50 0.65 28
Concrete Hourglass 30 1.00 2.20 2.50 0.45 28
Concrete Hourglass 30 1.00 2.20 2.50 0.55 28
Concrete Hourglass 30 1.00 2.20 2.50 0.65 28
Note: no additives, admixtures and/or superplasticizers were used.
!"#$%&'( )*&+*,*'(-.
glass-like (b) FEM mesh
516 IBRACON Structures and Materials Journal • 2016 • vol. 9 • nº 4
3. Results and discussion
3.1 Mortar analysis
3.1.1 Experimental analysis
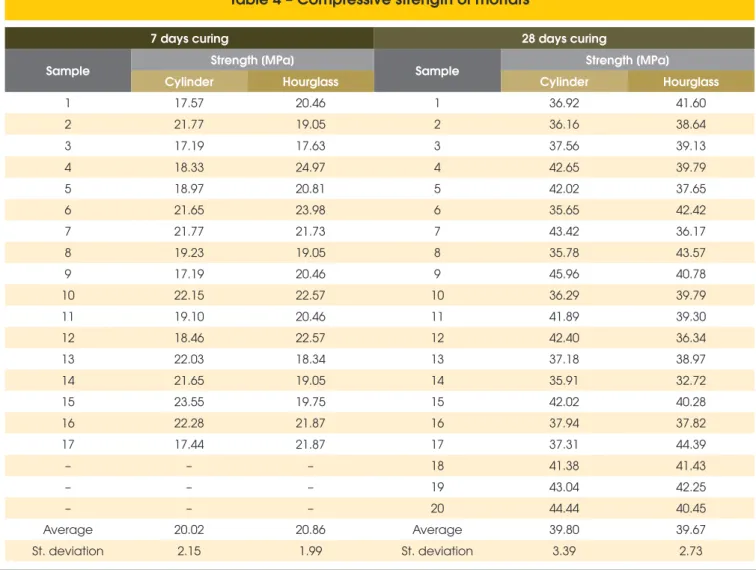
Table 4 shows the compressive strength results for both shapes at the ages of 7 and 28 days.
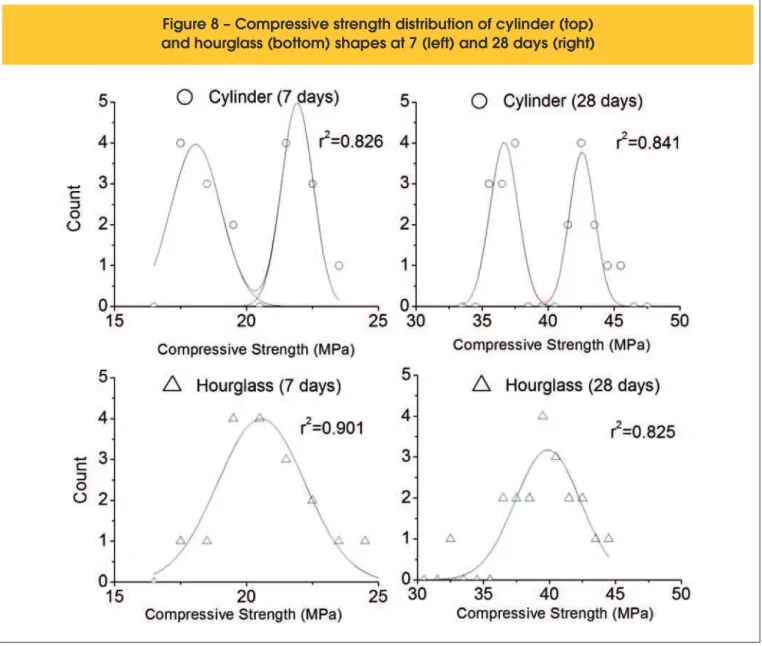
A irst look shows that the average of both shapes was very sim -ilar at both ages despite the reduced section at the middle of the
hourglass specimens. Hence, there should be no signiicant efect
of the specimens shape on the assessment of the compressive strength of the mortar.
Nevertheless, the standard deviation was slightly higher for cylin-der-shaped specimens, which was greater at later age.
Nonethe-less, a closer look at the stress distribution reveals that the efect of specimens shape were rather diferent at both ages as can be
seen in Figure 8.
For cylindrical shapes, a Gaussian itting could only be performed with certain signiicance when two peaks were considered, sug
-gesting two groups of efects dominating the strength of such
specimens. This trend was not observed for the hourglass shape
in which a single Gaussian peak was able to it the data with bet
-ter correlation coeicients at both ages. This might indicate that the diferent failure modes, as suggested by the aforementioned standard ([14], Figure 4), might have inluenced such a trend. It is
interesting to note that the velocity of the rupture was much slower for hourglass shapes, because of its smooth section reduction var-iation. This might represent an interesting alternative in the case of high strength concrete in which rupture is very abrupt.
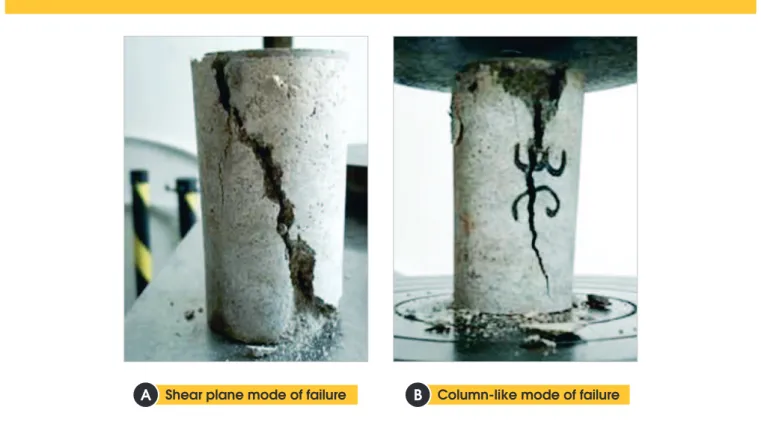
Figures 9 and 10, respectively, show typical failure modes in cylin-drical and hourglass-like specimens. Indeed, whereas most failure modes in cylinders were shear (Figure 9(a)) and column-like (Fig-ure 9(b)), shear mode of fail(Fig-ure was the only mode observed in all hourglass shape specimens ((Figure 10(a) and (b)). The fact that cracks propagated through contact faces in cylinders, but not in hourglass shape, seems to corroborate the view that the reduction of section, as in hourglass shapes, helps to concentrate stresses in sections. Hence, there is evidence to suggest that the latter seems
less afected by contact-surface-related problems than the former
shape. In fact, the normal stress on the top of the cylinder sam-ple is twice as high as that of hourglass shape samsam-ple. Therefore,
Table 4 – Compressive strength of mortars
7 days curing 28 days curing
Sample Strength [MPa] Sample Strength [MPa]
Cylinder Hourglass Cylinder Hourglass
1 17.57 20.46 1 36.92 41.60
2 21.77 19.05 2 36.16 38.64
3 17.19 17.63 3 37.56 39.13
4 18.33 24.97 4 42.65 39.79
5 18.97 20.81 5 42.02 37.65
6 21.65 23.98 6 35.65 42.42
7 21.77 21.73 7 43.42 36.17
8 19.23 19.05 8 35.78 43.57
9 17.19 20.46 9 45.96 40.78
10 22.15 22.57 10 36.29 39.79
11 19.10 20.46 11 41.89 39.30
12 18.46 22.57 12 42.40 36.34
13 22.03 18.34 13 37.18 38.97
14 21.65 19.05 14 35.91 32.72
15 23.55 19.75 15 42.02 40.28
16 22.28 21.87 16 37.94 37.82
17 17.44 21.87 17 37.31 44.39
– – – 18 41.38 41.43
– – – 19 43.04 42.25
– – – 20 44.44 40.45
Average 20.02 20.86 Average 39.80 39.67
the horizontal stresses due to friction are twice lower for hourglass shape samples.
3.1.2 Numerical analysis
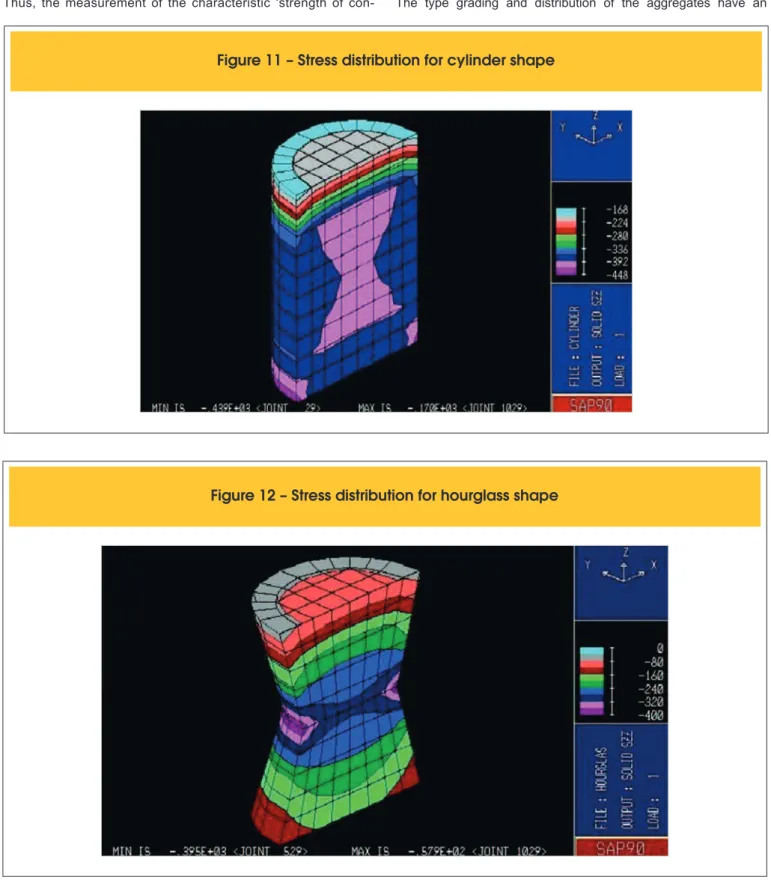
Numerical analyses show stress distribution of both shapes (Z-axis, vertical stress) as can be seen in Figure 11 and Figure 12, respectively. Although it is not possible to determine the ul-timate compressive strength by using linear elastic analysis, the strength distribution is important to assess possible failure pat-terns that are more likely to occur at greater strength concen-tration. Stress distribution in cylinders is more concentrated at the top of the specimens, where the load is applied. Also, failure can occur at any position in this geometry given that strength is somewhat uniform throughout the section. Interestingly, natural hourglass shape for the stress distribution appears in the middle of cylindrical specimen.
Nonetheless, the central part of the hourglass shape experiences
greater stress concentration, hence, greater chances of failure will be concentrated at the middle height of specimens.
3.2 Concrete analysis
3.2.1 Experimental analysis
After one day, the specimens were uncased. Just one hourglass specimen (W/C ratio = 0.45) presented excessive voids. Due to the quantity of imperfect specimens being small (just one sample),
the geometry in the form of hourglass does not afect the density, signiicantly.
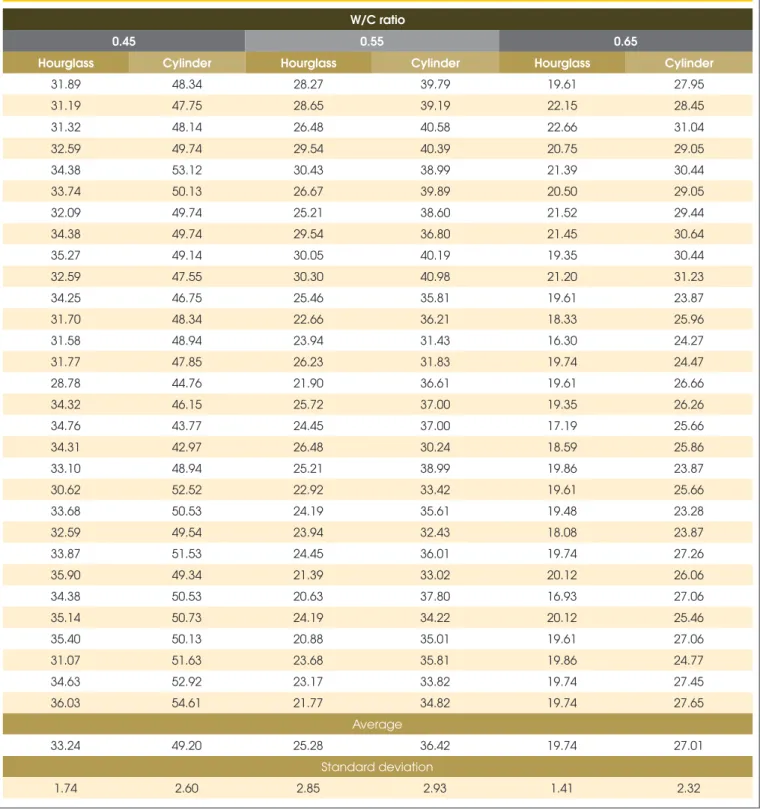
3.2.1.1 Compressive strength results
The results of compressive strength are expressed in Table 5. The results clearly indicate that the specimens prepared in the hourglass shape have compressive strength greater than the
518 IBRACON Structures and Materials Journal • 2016 • vol. 9 • nº 4
/01234567890:;4 3<=>4? 3@9?:4AB;4BCC?09 234?:;DB9 2A:E90F4AB;4BCC?09 234
Shear plane mode of failure Column-like mode of failure
B
B
A
B
Figure 11 – Stress distribution for cylinder shape
Figure 12 – Stress distribution for hourglass shape
cylindrical (48.01%, 44.07% and 36.83%, respectively). This
means that the efects related to the ends of the specimens (present in the cylindrical ones) have inluenced the results,
while results for the specimens in the hourglass shape repre-sent only the determination of the resistance of the material. Thus, the measurement of the characteristic ‘strength of
con-crete’ from cylindrical specimens leads to lower values than the actual ones.
What is the explanation for the diference between the compres -sive strength of concrete and mortar prepared in the hourglass?
Consider the following igures (Figures 13 and 14).
520 IBRACON Structures and Materials Journal • 2016 • vol. 9 • nº 4
Table 5 – Results of compressive strength of cylinders and hourglass specimens (MPa)
W/C ratio
0.45 0.55 0.65
Hourglass Cylinder Hourglass Cylinder Hourglass Cylinder
31.89 48.34 28.27 39.79 19.61 27.95
31.19 47.75 28.65 39.19 22.15 28.45
31.32 48.14 26.48 40.58 22.66 31.04
32.59 49.74 29.54 40.39 20.75 29.05
34.38 53.12 30.43 38.99 21.39 30.44
33.74 50.13 26.67 39.89 20.50 29.05
32.09 49.74 25.21 38.60 21.52 29.44
34.38 49.74 29.54 36.80 21.45 30.64
35.27 49.14 30.05 40.19 19.35 30.44
32.59 47.55 30.30 40.98 21.20 31.23
34.25 46.75 25.46 35.81 19.61 23.87
31.70 48.34 22.66 36.21 18.33 25.96
31.58 48.94 23.94 31.43 16.30 24.27
31.77 47.85 26.23 31.83 19.74 24.47
28.78 44.76 21.90 36.61 19.61 26.66
34.32 46.15 25.72 37.00 19.35 26.26
34.76 43.77 24.45 37.00 17.19 25.66
34.31 42.97 26.48 30.24 18.59 25.86
33.10 48.94 25.21 38.99 19.86 23.87
30.62 52.52 22.92 33.42 19.61 25.66
33.68 50.53 24.19 35.61 19.48 23.28
32.59 49.54 23.94 32.43 18.08 23.87
33.87 51.53 24.45 36.01 19.74 27.26
35.90 49.34 21.39 33.02 20.12 26.06
34.38 50.53 20.63 37.80 16.93 27.06
35.14 50.73 24.19 34.22 20.12 25.46
35.40 50.13 20.88 35.01 19.61 27.06
31.07 51.63 23.68 35.81 19.86 24.77
34.63 52.92 23.17 33.82 19.74 27.45
36.03 54.61 21.77 34.82 19.74 27.65
Average
33.24 49.20 25.28 36.42 19.74 27.01
Standard deviation
1.74 2.60 2.85 2.93 1.41 2.32
efect on the failure mechanism. However, for hourglass, the failure mode is always a single shear plane (≈ 46º).
So, the hourglass is able to assess concrete and mortar, whereas the cylinder which is only able to evaluate resistance of mortars. Therefore, the hourglass is recommended for any type of cementi-tious material, whether it is composed only of small grains of sand or
large gravel grains, such as concrete. Note that the hourglass shape
forces the concrete to break at a certain angle (≈ 46º) at which the
shear occurs in gravel (unlike the cylinder, which tends to break due
to the efect of separation of parts of the tensile specimen).
Figure 13 – Case of mortar
522 IBRACON Structures and Materials Journal • 2016 • vol. 9 • nº 4
actual value (i.e., concrete structures safety is greater than what is considered). This result does not cease to be good because it points to lower values, which implies an additional security to con-crete structures.
However, this fact should not be interpreted as a way to reduce the
safety coeicients of the structures, because several other factors
interfere in their calculation, and researches on this subject are still preliminary for deciding on something of this nature.
The organization of Table 5 in form of frequency distributions can be seen in Figure 15, Figure 16, and Figure 17.
The distributions clearly show the trend of the hourglass speci-mens ruptured at low angles in the central region. This result is interesting because it shows that the hourglass induces the rupture in the material without the interference of shear developed in
con-tact with the mechanical press. In the cylindrical shape the distri-butions have been more open with the presence of several angles of failure, many of them passing through its ends. The work initial expectation was to assess, with a certain approximation, the com-pressive strength according to the angle of rupture. However, even the tests with hourglass distribution do not allow this inference yet. Certainly, a larger number of samples may suggest a better
be-havior. In any case, the hourglass shape signiicantly reduces the
problems that arise from the plates of the machine.
Working with mortar specimens (10 cm high and 5 cm in diam-eter), Bezerra et al. [20, 21] found Gaussian distribution curves
with correlation coeicients roughly equal to 0,900. The curves
presented above do not reach this level of correlation, and indicate a new factor in the shape of an hourglass for concrete: probably
Figure 15 – WCR = 0.45. Count (vertical axis) x angle of rupture
(o) x compressive strength (MPa): cylinder (a) and hourglass (b)
A
B
Figure 16 – WCR = 0.50. Count (vertical axis) x angle of rupture
(o) x compressive strength (MPa): cylinder (a) and hourglass (b)
Figure 17 – WCR = 0.55. Count (vertical axis) x angle of rupture
(o) x compressive strength (MPa): cylinder (a) and hourglass (b)
A
B
GHIJKLMNOPQK RSTRUVJ TWSLXWYJK ZLT
the presence of coarse aggregate in the area of disruption inlu -ences the type of breakdown, reducing the occurrence of rupture of the sheared type (see Figure 14), because of the friction de-veloped between the broken halves and the coarse aggregates, which should hinder the sliding plane of rupture. Then, the results suggest that an hourglass shape with 20 cm high should be used for concrete with coarse aggregate of a maximum diameter of 19 mm. Of course, for larger sizes of coarse aggregate, it is necessary to prepare larger molds.
3.2.2.2 Another curiosity: Duff Abrams adjustment
The correlation between the compressive strength and the water/ cement ratio has been a concern in civil engineering since the work
carried out by Duf Abrams in 1908 [22]. For the Abrams curve,
which obeys an equation of the type Cs = A/BW/C, the following
results were obtained (Figure 18).
As one can observe, the correlation between the two models was satisfactory, indicating the adaptation of the hourglass shape to the Abrams curve.
3.2.2.3 Numerical analysis
As with the specimens of mortar, the specimens prepared with con-crete were also evaluated numerically by the FEM. It employed the software Structural Analysis Program (SAP) with the formulation of brick by Wilson and Habibullah [19] and Hirth Jr. [18]. The consid-ered modulus of elasticity of the concrete was assumed to equal 30 GPa, and a Poisson ratio of 0.2. Figures 11 and 12 show aspects of the two models in the deformed condition of vertical stress.
A quick observation of the cylindrical model (Figure 11) reveals a
unique igure of interest in the center, it is similar to an hourglass
with a constant tension level (pink area). With the sample, you also see that the contour of the cylinder has tension levels of the same order of magnitude (blue area), suggesting the possibility of rup-ture at any point along the samples sides, and even the nearby
parts of the support (edges). Thus, the cylinder is a shape that can break in both middle and ends, which is found in the tests, whose planes pass through several regions.
In the case of the hourglass shape, there is a stress concentration in the central part. It was also noted that, as you move away from this part, the tensions are reduced and the probability of failure in these regions is diminished.
524 IBRACON Structures and Materials Journal • 2016 • vol. 9 • nº 4 situation: (i) the irst refers to the elimination of accuracy, concern
-ing how to cap the specimens, i.e., the hourglass capp-ing stops interfering in the results; (ii) the other refers to the certainty in de-termining the compressive strength of concrete without the inter-ference of the particular characteristics of the machines.
An interesting feature is also the fact that specimens in the hour-glass do not break abruptly, because only the central part is under a high level of tension. Hence the specimen will gradually break through an irradiation of cracks, unlike the cylindrical specimens that can break anywhere and ruptures, being more likely to brake brusquely. Thus, the hourglass specimens become particularly interesting in case of high-strength concrete, which often release sharp debris in compressive strength tests.
4. Conclusions
The hourglass shape is an interesting alternative for compressive strength assessment of normal strength mortars and concretes.
Obviously, speciics studies have to be developed for high strength
concretes.
However, the present study allows the following conclusions: Hourglass specimens appears to present less contact-related ef-fect than cylinders ones;
It (hourglass) does not seem to have a signiicant efect on the
average value of compressive strength;
it does not appear to promote diferent modes of failure but, pref -erably, shear mode around the middle section. Hence, hourglass specimens tests result in statistical distribution (i.e. a satisfactory
statistical correlation coeicient);
inite element model helped to assess strength distribution, which conirmed the advantages of the hourglass over the cylinder
shapes as far as strength concentration at middle height is con-cerned;
the hourglass specimens have excellent correlation with the Abrams curve;
cylindrical specimens have a compressive strength lower than the real value; which means that concrete structures are a more safer than expected in the tests;
the adoption of the hourglass shape for evaluating the compres-sive strength of specimens is a feasible way to eliminate problems arising from the cap and particular characteristics of presses; and the hourglass shape does not cause sudden rupture, as seen in the cylinders (which may be a good characteristic for compressive tests in high strength concretes).
In short, the hourglass shape is an interesting specimen geometry to assess the compressive strength of cementitious materials be-cause it eliminates the interference of machines.
5. References
[1] Hamelau, K. The history of cement. Autumn Seminar. Leipzig: Krupp Polysius, 1997.
[2] Kaefer, L. F. PEF 5707 - Concepção, projeto e realização das estruturas: aspectos históricos: a evolução do concreto armado. São Paulo: 1998.
[3] Laranjeiras, A. C. R. Depoimento sobre origem das geome-trias de corpos de prova, 2009.
[4] Hampel, T.; Speck, K.; Scheerer, S.; Ritter, R. and Cur-bach, M. High-performance concrete under biaxial and
triaxial loads. Journal of Engineering Mechanics. v. 135. p. 1274-1280.
[5] Pivonka, P.; Lackner, R. and Mang, H. A. Shapes of loading
surfaces of concrete models and their inluence on the peak
load and failure mode in structural analyses. International Journal of Engineering Science. v. 41. p. 1649-1665. 2003. [6] Leonhardt, F. e Mönnig, E. Construções de concreto. 1 ed.
Rio de Janeiro: Interciência, 1977. v. 1-6.
[7] Timoshenko, S. P.; GERE, J. E. Mecânica dos sólidos. Rio
de Janeiro: Livros Técnicos e Cientíicos,1989.
[8] Bazănt, Z. P. and Becq-Giraudon, E. Statistical prediction of
fracture parameters of concrete and implications for choice of testing standard. Cement and Concrete Research. v. 32. p. 529-556. 2002.
[9] Tue, N. V. and Tung, N. Ð. A new model for concrete in com-pression considering the growth of the damage zone. Inst. of Struct. Concr., Graz University of Technology, Austria. [10] Vonk, R. A. A micromechanical investigation of softening of
concrete loaded in compression. Delft: Heron, 1993. v. 38. n. 3.
[11] Viso, J. R.; Carmona, J. R. and Ruiz, G. Shape and size ef-fects on the compressive strength of high-strength concrete. Cement and Concrete Research. v. 38. p. 386-395. 2008. [12] Miwa, Y.; Jitsukawa, S. and Hishinuma, A. Development of a
miniaturized hour-glass shaped fatigue specimen. Journal of Nuclear Materials. v. 258-263. p. 457-461. 1998.
[13] Mehta, P. K. and Monteiro, P. J. M. Concrete: microstructure, properties and materials, McGraw-Hill Professional, New York, 2005, p. 659.
[14] Associação Brasileira de Normas Técnicas. Concreto - En-saio de compressão de corpos-de-prova cilíndricos. NBR 5739. Rio de Janeiro: 1994.
[15] Baykov, V. N. y Sigalov, E. E. Estructuras de hormigon arma-do. 2 ed. Moscu: MIR, 1986.
[16] Murteira, B. J. F. Probabilidades e estatísticas. Lisboa: Mc-Graw-Hill de Portugal, 1990. v. 1. p. 423.
[17] Czarnecki, L.; Lukowski, P. and Nejman, R. The statistical evaluation of epoxy concrete heterogeneity. Cement and Concrete Composites, Elsevier, 1997. p. 417-427.
[18] Hirth JR., H. Curso de análise estrutural utilizando SAP90. São Paulo: MULTIPLUS, 1990.
[19] Wilson, E. L. and Habibullah, A. SAP90: a series of computer
programs for the static and dynamic inite element analysis
of structures. California: Computers and Structures, 1988. [20] Bezerra, U. T.; Barbosa, N. P.; Alves, S. M. S. and Torres,
S. M. Evaluation of test specimen geometry on compressive strength. Helsinki, Congress of IABSE, 2008.
[21] Bezerra, U. T.; Barbosa, N. P.; Torres, S. M. and Alves, S. M. S. Análise experimental e numérica da resistência à com-pressão de corpos-de-prova na forma de ampulheta. Salva-dor, COBRACON, 2008.
![Figure 2 – Cross sections to predict the failure mode of concrete (from [5])](https://thumb-eu.123doks.com/thumbv2/123dok_br/18861179.417953/2.892.59.842.870.1140/figure-cross-sections-predict-failure-mode-concrete.webp)
![Figure 4 – Cylindrical failure modes according to Brazilian standard [14])](https://thumb-eu.123doks.com/thumbv2/123dok_br/18861179.417953/3.892.71.830.209.506/figure-cylindrical-failure-modes-according-brazilian-standard.webp)