HESSD
10, 5269–5314, 2013Land use change effects on runoff
generation
L. E. Mu ˜noz-Villers and J. J. McDonnell
Title Page
Abstract Introduction
Conclusions References
Tables Figures
◭ ◮
◭ ◮
Back Close
Full Screen / Esc
Printer-friendly Version
Interactive Discussion
Discussion
P
a
per
|
Dis
cussion
P
a
per
|
Discussion
P
a
per
|
Discussio
n
P
a
per
|
Hydrol. Earth Syst. Sci. Discuss., 10, 5269–5314, 2013 www.hydrol-earth-syst-sci-discuss.net/10/5269/2013/ doi:10.5194/hessd-10-5269-2013
© Author(s) 2013. CC Attribution 3.0 License.
Geoscientiic Geoscientiic
Geoscientiic Geoscientiic
Hydrology and Earth System
Sciences
Open Access
Discussions
This discussion paper is/has been under review for the journal Hydrology and Earth System Sciences (HESS). Please refer to the corresponding final paper in HESS if available.
Land use change e
ff
ects on runo
ff
generation in a humid tropical montane
cloud forest region
L. E. Mu ˜noz-Villers1and J. J. McDonnell2,3 1
Centro de Ciencias de la Atm ´osfera, Universidad Nacional Aut ´onoma de M ´exico, Ciudad Universitaria, Distrito Federal, M ´exico
2
Global Institute for Water Security, University of Saskatchewan, Saskatoon, Canada
3
University of Aberdeen, School of Geosciences, Aberdeen, UK
Received: 1 April 2013 – Accepted: 16 April 2013 – Published: 29 April 2013
Correspondence to: L. E. Mu ˜noz-Villers ([email protected])
HESSD
10, 5269–5314, 2013Land use change effects on runoff
generation
L. E. Mu ˜noz-Villers and J. J. McDonnell
Title Page
Abstract Introduction
Conclusions References
Tables Figures
◭ ◮
◭ ◮
Back Close
Full Screen / Esc
Printer-friendly Version
Interactive Discussion
Discussion
P
a
per
|
Dis
cussion
P
a
per
|
Discussion
P
a
per
|
Discussio
n
P
a
per
|
Abstract
While tropical montane cloud forests (TMCF) provide critical hydrological services to downstream regions throughout much of the humid tropics, catchment hydrology and impacts associated with forest conversion in these ecosystems remain poorly under-stood. Here, we compare the annual, seasonal and event-scale streamflow patterns
5
and runoffgeneration processes of three neighbouring headwater catchments in cen-tral Veracruz (eastern Mexico) with similar pedological and geological characteristics, but different land cover: old-growth TMCF (MAT), 20 yr-old naturally regenerating TMCF (SEC) and a heavily grazed pasture (PAS). We used a 2 yr record of high resolution rainfall and stream flow data (2008–2010) in combination with stable isotope and
chem-10
ical tracer data collected for a series of storms during a 6-week period of increasing antecedent wetness (wetting-up cycle). Our results showed that annual and seasonal streamflow patterns of the MAT and SEC were similar. In contrast, the PAS showed a 10 % higher mean annual streamflow, most likely because of a lower rainfall intercep-tion. During the wetting-up cycle, storm runoffratios increased at all three catchments
15
(from 11 to 54 % for the MAT, 7 to 52 % for the SEC and 3 to 59 % for the PAS). With the increasing antecedent wetness, hydrograph separation analysis showed progres-sive increases of pre-event water contributions to total stormflow (from 35 to 99 % in the MAT, 26 to 92 % in the SEC and 64 to 97 % in the PAS). At all three sites, rainfall-runoff
responses were dominated by subsurface flow generation processes for the majority of
20
storms. However, for the largest and most intense storm (typically occurring once every 2 yr), sampled under wet antecedent conditions, the event water contribution in the PAS (34 % on average) was much higher than in the forests (5 % on average), indicating that rainfall infiltration capacity of the PAS was exceeded. This result suggests that despite the high permeability of the volcanic soils and underlying substrate in this TMCF
envi-25
ronment, the conversion of forest to pasture may lead to important changes in runoff
HESSD
10, 5269–5314, 2013Land use change effects on runoff
generation
L. E. Mu ˜noz-Villers and J. J. McDonnell
Title Page
Abstract Introduction
Conclusions References
Tables Figures
◭ ◮
◭ ◮
Back Close
Full Screen / Esc
Printer-friendly Version
Interactive Discussion
Discussion
P
a
per
|
Dis
cussion
P
a
per
|
Discussion
P
a
per
|
Discussio
n
P
a
per
|
results also showed that 20 yr of natural regeneration may be enough to largely restore the original hydrological conditions of this TMCF.
1 Introduction
The impact of land use change on hydrology is a major global research issue (Foley et al., 2005). Decreases in rainfall interception, transpiration and soil hydraulic
proper-5
ties associated with forest disturbance and conversion to pasture or agricultural lands modifies the terrestrial water cycle (Chhabra et al., 2006), and may have significant effects on catchment water yields and streamflow dynamics (Germer et al., 2009; Roa-Garc´ıa et al., 2011; Scheffler et al., 2011; Zhang et al., 2001). In the tropics, these ef-fects are amplified by the rapidity and extensiveness of the land cover change (Lambin
10
et al., 2003).
There is substantial evidence that the conversion of forest to pasture or crops in the tropics is associated with an increase in annual streamflow totals because of the lower evapotranspiration of the replacement vegetation (see Bruijnzeel, 2004, for an overview). However, at the same time, there have been reports of diminished
stream-15
flows during the dry season. The latter may occur when reductions in rainfall infiltration capacity due to soil compaction by cattle or agricultural machinery, and associated de-creases in recharge of soil and groundwater reservoirs during the rainy season are large enough to offset the effect of lower evapotranspiration (Bruijnzeel, 2004). Nev-ertheless, to date, there are very few studies that have quantified the effects of land
20
use change on runoffgeneration processes and seasonal flows in the humid tropics (Roa-Garc´ıa and Weiler, 2010; Roa-Garc´ıa et al., 2011).
In this respect, the effects of tropical montane cloud forest (TMCF) conversion on catchment hydrology are even less understood (Bruijnzeel et al., 2011). TMCFs are among the world’s most valuable terrestrial ecosystems for biodiversity and
provision-25
HESSD
10, 5269–5314, 2013Land use change effects on runoff
generation
L. E. Mu ˜noz-Villers and J. J. McDonnell
Title Page
Abstract Introduction
Conclusions References
Tables Figures
◭ ◮
◭ ◮
Back Close
Full Screen / Esc
Printer-friendly Version
Interactive Discussion
Discussion
P
a
per
|
Dis
cussion
P
a
per
|
Discussion
P
a
per
|
Discussio
n
P
a
per
|
Zadroga, 1981). Nevertheless, dramatic degradation and loss of TMCFs worldwide have occurred over the last few decades (Scatena et al., 2010).
Because of the generally rapid growth of young secondary vegetation in the humid tropics, a quick return to pre-disturbance hydrology during forest regenerating following deforestation may be expected in these regions (Bruijnzeel, 2004). However, despite
5
the fact that secondary forests are currently more widespread than old-growth forests in many tropical environments (Fox et al., 2000; Xu et al., 1999), the available information is extremely scarce (H ¨olscher et al., 2005), particularly in the case of TMCF (Bruijnzeel et al., 2011).
Much of our understanding of land use effects on runoffgeneration is derived from
10
paired-catchment studies (mostly in temperate areas), i.e. controlled, experimental ma-nipulations of the vegetation cover (Bosch and Hewlett, 1982; Brown et al., 2005; Bruijnzeel, 1990; Fritsch, 1993; Malmer, 1992; Peel, 2009). However, because most of the remaining forests in TMCF areas are officially protected by conservation laws (Mu ˜noz-Pi ˜na, 2008; Scullion et al., 2011), experimental clearing for paired-catchment
15
studies is generally not possible (Bruijnzeel, 2005). Hence, a common approach is to compare the hydrology of catchments with different land cover, but similar size, to-pography, soils, geology and climate (e.g. Germer et al., 2009; Moraes et al., 2006; Mu ˜noz-Villers et al., 2012; Roa-Garc´ıa et al., 2011).
In Mexico, about 50 % of the original TMCF area has been converted to other land
20
uses (Cayuela et al., 2006; Challenger, 1998). In the highlands of central Veracruz (central-eastern Mexico), 26 % of TMCF has been cleared for the establishment of pasture for cattle grazing and agricultural lands in the last 30 yr (Mu ˜noz-Villers and L ´opez-Blanco, 2008). In this study, we build upon previous work in the TMCF zone of central Veracruz and quantify the impacts of land use change on annual and seasonal
25
HESSD
10, 5269–5314, 2013Land use change effects on runoff
generation
L. E. Mu ˜noz-Villers and J. J. McDonnell
Title Page
Abstract Introduction
Conclusions References
Tables Figures
◭ ◮
◭ ◮
Back Close
Full Screen / Esc
Printer-friendly Version
Interactive Discussion
Discussion
P
a
per
|
Dis
cussion
P
a
per
|
Discussion
P
a
per
|
Discussio
n
P
a
per
|
resolution rainfall and stream flow data (2008–2010) in combination with stable isotope and chemical tracer data collected for a series of storms during the 2009 wet season. We address the following research questions:
1. How does streamflow at annual, seasonal and event time scales compare among land covers?
5
2. How do runoffgeneration processes compare between the secondary and mature cloud forest?
3. What are the effects of forest conversion to pasture on runoff response in this TMCF environment?
2 Materials and methods
10
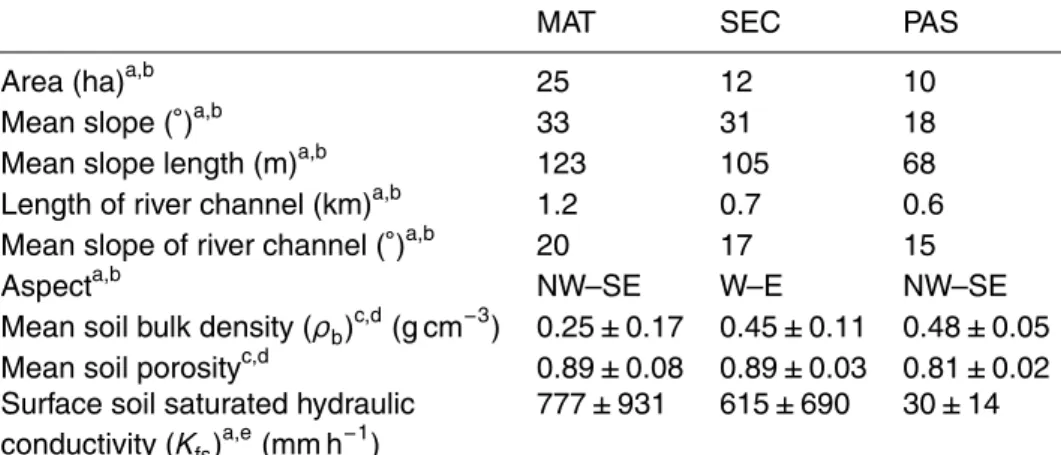
2.1 Study site
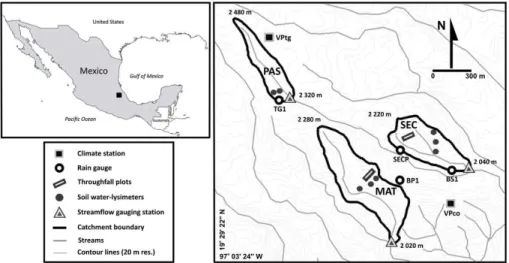
The research was carried out in three adjacent headwater catchments (<25 ha) lo-cated between 2100 and 2500 m a.s.l. in the upper part of the cloud forest zone in cen-tral Veracruz, Mexico (Fig. 1). The catchments are situated in dissected mountainous terrain and are drained by first- or second-order perennial streams. Hillslopes are
gen-15
erally short and steep in the forested catchments, whereas somewhat less steep gra-dients characterize the pasture site (Table 1). Soils are classified as Umbric Andosols derived from volcanic ash (Campos, 2010; Van Osch, 2010) and having silt loam/silty clay loam as dominant textures. Surface soil in the forest sites are characterized by lower bulk densities and higher porosities (Mar´ın-Castro, 2010; Mu ˜noz-Villers et al.,
20
HESSD
10, 5269–5314, 2013Land use change effects on runoff
generation
L. E. Mu ˜noz-Villers and J. J. McDonnell
Title Page
Abstract Introduction
Conclusions References
Tables Figures
◭ ◮
◭ ◮
Back Close
Full Screen / Esc
Printer-friendly Version
Interactive Discussion
Discussion
P
a
per
|
Dis
cussion
P
a
per
|
Discussion
P
a
per
|
Discussio
n
P
a
per
|
2010), whereas in the pasture Kfs ranged between 30 mm h
−1
at 0.2 m to 7 mm h−1 at 1.5 m depth (Van Osch, 2010). The soils are underlain by permeable, moderately weathered andesitic breccias, underlain, in turn, by permeable saprolite that has been weathered from fractured andesitic-basaltic bedrock.
The mature forest (henceforth MAT) is an old-growth lower montane cloud forest
5
(LMCF) with relatively low disturbance. The overstory of this forest is dominated by Quercus ocoteoifolia,Clethra macrophylla,Parathesis melanostictaandAlchornea lat-ifolia(Garc´ıa-Franco et al., 2008). The 20 yr-old regenerating forest (henceforth SEC) is a mixture of equal proportions of LMCF recovered naturally from a wildfire in 1990 and a pasture land that was abandoned around the same time.Alnus jorullensisis the
10
overstory species whileClethra macrophylla, Alchornea latifolia and Miconia glaber-rimacharacterize the mid- and understory. More details on the vegetation characteris-tics of the MAT and SEC can be found in Garc´ıa-Franco et al. (2008) and Mu ˜noz-Villers et al. (2012).
The original vegetation in the pasture (henceforth PAS) catchment was LMCF,
15
which was cleared approximately 70 yr ago (local inhabitants, personal communica-tion, 2008). Since then, the pasture has been heavily grazed by goats, sheep and horses. The dominant grass species areAxonopus compressus (Sw.) P. Beauv. and Alchemilla pectinata Kunth, with an average height of about 20 mm (L.E. Mu ˜noz-Villers, unpublished data). Approximately 10 % of the PAS is covered by Baccaris conferta,
20
a secondary perennial shrub species of about 1.2 m height; once a year, different parts of this shrub are burned to establish temporal croplands (mostly maize and beans).
The climate at the study site is classified as temperate humid with abundant rains during the summer (K ¨oppen classification modified by Garcia, 1988). Annual rainfall at this site is approximately 3200 mm, of which 80 % typically falls as high intensity
25
HESSD
10, 5269–5314, 2013Land use change effects on runoff
generation
L. E. Mu ˜noz-Villers and J. J. McDonnell
Title Page
Abstract Introduction
Conclusions References
Tables Figures
◭ ◮
◭ ◮
Back Close
Full Screen / Esc
Printer-friendly Version
Interactive Discussion
Discussion
P
a
per
|
Dis
cussion
P
a
per
|
Discussion
P
a
per
|
Discussio
n
P
a
per
|
Mu ˜noz-Villers et al., 2012). Monthly mean temperatures are about 15.4 and 13.4◦C on average for the wet and dry seasons, respectively (Holwerda et al., 2010).
2.2 Hydrometeorological measurements
Rainfall was measured at one site in the MAT (BP1) and PAS (TG1) catchments, and at two sites in the SEC (SECP, BS1) catchment (Fig. 1). Additionally, two rain gauges
5
were installed at the weather stations (labeled “VPco” and “VPtg” in Fig. 1). The rain gauges used were of the type ARG100 (Environmental Measurements), Casella CEL and RG2M (Onset) (all with a resolution of 0.2 mm). The signals from the stand-alone rain gauges were stored using custom-built (VU University, Amsterdam) and HOBO pendant event (Onset) loggers, whereas those from the gauges at the weather stations
10
were recorded with CR1000 data loggers (Campbell Scientific). All gauges were dy-namically calibrated to account for the variable error associated with the loss of water during bucket rotation (Calder and Kidd, 1978).
Streamflow was measured using V-notch weirs at the catchment outlets (90◦ angle for the MAT and 53.6◦for the SEC and PAS). Water levels were registered every 2 min
15
using Schlumberger LT F15/M5 water level sensors paired with F5/M1.5 barometric pressure recorders. Water-levels were converted to streamflow (L s−1) using the ex-perimental stage-discharge relationship for these weirs (Kindsvater and Carter, 1957), calibrated with field-derived rating curves generated via volumetric- and salt dilution measurements of discharge. Further details on instrumentation and calibration
proce-20
dures can be found in Mu ˜noz-Villers et al. (2012). Rainfall and streamflow measure-ments in the MAT and SEC started in July 2005, whereas data collection in the PAS began in June 2008.
2.3 Hydrologic metrics analysis
To intercompare the annual and seasonal hydrological regimes of the three
catch-25
HESSD
10, 5269–5314, 2013Land use change effects on runoff
generation
L. E. Mu ˜noz-Villers and J. J. McDonnell
Title Page
Abstract Introduction
Conclusions References
Tables Figures
◭ ◮
◭ ◮
Back Close
Full Screen / Esc
Printer-friendly Version
Interactive Discussion
Discussion
P
a
per
|
Dis
cussion
P
a
per
|
Discussion
P
a
per
|
Discussio
n
P
a
per
|
(denoted by subscript h) and daily (denoted by the subscript d) streamflow and rainfall data (Qh, Qd,Ph and Pd, respectively; all in units of mm) collected from 1 June 2008 to 31 May 2010. For each catchment, the following parameters were calculated using the daily discharge record (Qd): Mean Annual Flow (MAF), Coefficient of Variation of Stream Discharge (CVQ), Flow Duration Curve (FDC), Master Recession Curve (MRC)
5
and Mean RunoffRatio (MRR).
The MAF [mm] was obtained by dividing the sum of all the individual daily flows by the number of days recorded over the study period. The MRR [–] was calculated as the ratio of total streamflow to total precipitation (Olden and Poff, 2003):
MRR=
P
Qd
P
Pd
(1)
10
The FDC describes the distribution of probabilities of streamflow being greater than or equal to a specified magnitude plotted on a semi-log scale. As a measure of flow variability, the slope of the FDC (SFDC [–]) between the 5th and 95th streamflow per-centiles was calculated using the method of Zhang et al. (2008) modified by Sawicz
15
et al. (2011):
SFDC=
ln (Q5)−ln (Q95)
0.95−0.05 (2)
Additionally, the mean annual high (MAHF [mm]) and low flow (MALF [mm]) were cal-culated as the mean of the 1st and 99th percentiles of the FDC, respectively.
20
The MRC was constructed from daily dry season streamflow data using the matching strip method (Toebes and Strang, 1964). The MRC was described using linear reservoir theory (Chapman, 1999):
Qd=Q0exp −t/τ=Q0kt (3)
25
whereQ0 and Qd are the flows (mm day
−1
HESSD
10, 5269–5314, 2013Land use change effects on runoff
generation
L. E. Mu ˜noz-Villers and J. J. McDonnell
Title Page
Abstract Introduction
Conclusions References
Tables Figures
◭ ◮
◭ ◮
Back Close
Full Screen / Esc
Printer-friendly Version
Interactive Discussion
Discussion
P
a
per
|
Dis
cussion
P
a
per
|
Discussion
P
a
per
|
Discussio
n
P
a
per
|
The initial discharge value Q0 and recession constant k were obtained from linear regression analysis using log-transformed discharge data. Since all MRCs showed de-partures from linearity towards the end of the recession, indicating catchment leakage (Fig. 2; c.f. Chapman, 1999), the baseflow recession parametersQ0andk(Eq. 3) were obtained from that portion of the MRC where the relationship between log (Qd) and t
5
was linear (Mu ˜noz-Villers et al., 2012).
Hourly data were used to separate streamflow into baseflow (Qbf) and quickflow (Qqf) following the approach of Hewlett and Hibbert (1967). The separation was performed using a slope constant of 0.030 mm h−1(Mu ˜noz-Villers, 2008). Storms were defined as periods with more than 0.2 mm of rainfall (Pev), separated by a dry period of at least 3 h
10
(cf. Gash, 1979).
The Base Flow Index (BFI [–]) was calculated from the inferred values of Qbf and measuredQhusing (Arnold et al., 1999):
BFI=
P
Qbf
P
Qh (4)
15
Finally, the Richards-Baker Flashiness Index (FI [–]) was calculated as a metric of the frequency and rapidity of short term changes in runoffvalues (catchment responsive-ness). The FI index was calculated as the sum of the absolute values of hour-to-hour changes inQhdivided by the sum of the hourly discharges (Baker et al., 2004):
FI= n
P
i=1
Qh,i−Qh,i−1
n
P
i=1 Qh,i
(5)
20
HESSD
10, 5269–5314, 2013Land use change effects on runoff
generation
L. E. Mu ˜noz-Villers and J. J. McDonnell
Title Page
Abstract Introduction
Conclusions References
Tables Figures
◭ ◮
◭ ◮
Back Close
Full Screen / Esc
Printer-friendly Version
Interactive Discussion
Discussion
P
a
per
|
Dis
cussion
P
a
per
|
Discussion
P
a
per
|
Discussio
n
P
a
per
|
2.4 Storm runoffanalysis
2.4.1 Stream event responses
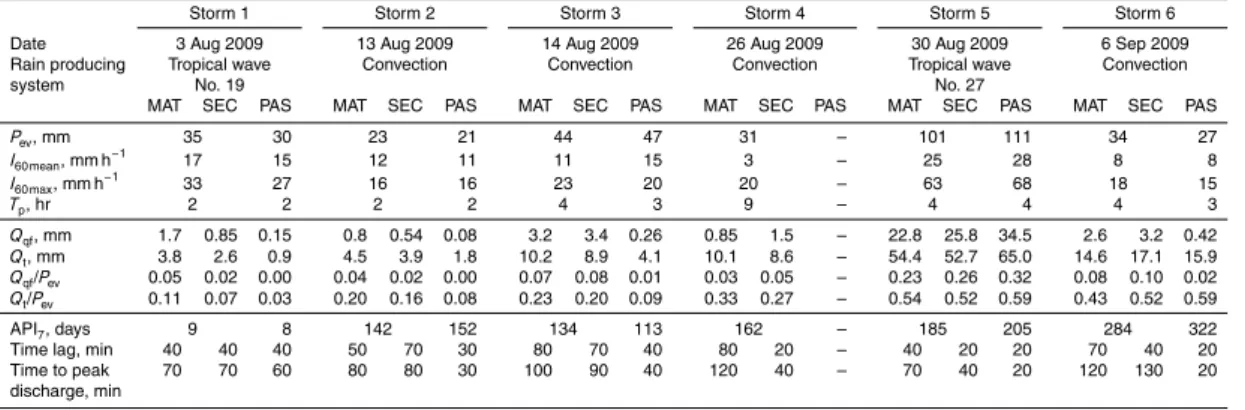
To assess stream response to precipitation and the influence of antecedent wetness conditions on runoff generation processes in the study catchments, several storm events were examined during a 6-week period (1 August to 14 September 2009) of
5
increasing antecedent wetness. For each storm, the following parameters were calcu-lated: total rainfall (Pev[mm]), maximum hourly rainfall intensity (I60 max[mm h
−1
]), event duration (Tp [hr]), the ratio between total runoff and rainfall (Qt/Pev), the ratio between quickflow and event rainfall (Qqf/Pev), peak discharge (Qpeak) and the antecedent pre-cipitation index (API7 [mm]), calculated as the weighted sum of rainfall in the last 7
10
days (Viessman et al., 1989). Furthermore, the lag time, defined as the time between peak rainfall and peak discharge, and the time to peak, defined as the time between the onset of storm discharge and peak discharge (Mosley, 1979) were calculated. For the latter analysis, 10 min rainfall and streamflow data were used.
2.4.2 Storm water sampling and collection
15
To identify the sources and pathways of stormflow in the three study catchments, sam-ples of rainfall, throughfall, soil-lysimeter and stream water were collected for as many storms as possible during the 6-week wetting-up cycle period for water isotope (δ2H orδ18O) and chemical (electrical conductivity, EC) analysis. These samples were then used as end-members and tracers for storm hydrograph separation (HS) analysis (see
20
Sect. 2.4.4).
Because wet season rainfall in this area is primarily of convective origin (B ´aez et al., 1997), this type of rain-producing system was particularly targeted for the rainfall-runoff
sampling. The following criteria were used to decide whether a storm event sampled was considered for isotope analysis: (1) rainfall had to be greater than 20 mm to ensure
25
HESSD
10, 5269–5314, 2013Land use change effects on runoff
generation
L. E. Mu ˜noz-Villers and J. J. McDonnell
Title Page
Abstract Introduction
Conclusions References
Tables Figures
◭ ◮
◭ ◮
Back Close
Full Screen / Esc
Printer-friendly Version
Interactive Discussion
Discussion
P
a
per
|
Dis
cussion
P
a
per
|
Discussion
P
a
per
|
Discussio
n
P
a
per
|
the entire stream hydrograph and include at least one baseflow sample before the storm started.
Rainfall was collected in 5 mm increments using two passive sequential samplers (Kennedy et al., 1979). One of the samplers was paired with the rain gauge located in between the MAT and SEC catchments (SECP; Fig. 1), and the other one was placed
5
next to the rain gauge at the outlet of the PAS catchment (TG1). At the same loca-tions, bulk samples of rainfall were collected using a rain water sampler consisting of a 95 mm diameter funnel assembled to a 40 mm diameter and 400 mm long transpar-ent collection tube. The tube contained a float to minimize evaporation. The rain gauge was inserted in 75 mm diameter PVC pipe wrapped by bubble foil insulation to
pro-10
tect the collected water against direct sunlight and minimize temperature variations. No attempt was made to collect sequential samples of throughfall because of the dif-ficulties involved in getting a representative sample due to the large spatial variability of throughfall in tropical forests (e.g. Holwerda et al., 2006). However, bulk samples of throughfall in the MAT and SEC were collected for comparison with rainfall using
15
ten collectors distributed randomly in each forest. Further details on rain water and throughfall collection methods can be found in Mu ˜noz-Villers and McDonnell (2012).
Stream water was collected during the storms using 3700C automatic water sam-plers (Teledyne ISCO, Inc., USA) installed at the streamflow gauging stations (Fig. 1). The three samplers were programmed to start sampling at the same frequency and
20
time, approximately 1 to 2 h before the storm was expected to initiate (to include at least one sample of stream baseflow). In addition, in each catchment grab samples of baseflow were collected once a week.
Soil water was collected prior to the storms from porous cup lysimeters (Soil Moisture Equipment, Corp., USA), using a suction of about 60 kPa. In the MAT and SEC, the
25
HESSD
10, 5269–5314, 2013Land use change effects on runoff
generation
L. E. Mu ˜noz-Villers and J. J. McDonnell
Title Page
Abstract Introduction
Conclusions References
Tables Figures
◭ ◮
◭ ◮
Back Close
Full Screen / Esc
Printer-friendly Version
Interactive Discussion
Discussion
P
a
per
|
Dis
cussion
P
a
per
|
Discussion
P
a
per
|
Discussio
n
P
a
per
|
0.9 m depth. In the PAS, lysimeters were installed in the midslope and near the stream at 0.3, 0.6 and 0.9 m depth.
2.4.3 Sample analysis
Samples for water isotope analysis were stored in 30 mL borosilicate glass vials with a polycone sealing cap to prevent evaporation. The samples were analyzed forδ2H
5
andδ18O on a laser liquid-water isotope spectrometer (Version 2, Los Gatos Research, Inc.) at the Hillslope and Watershed Hydrology Lab at Oregon State University, USA. The isotope values ofδ2H and δ18O are expressed in permil (‰) relative to Vienna Standard Mean Ocean Water (VSMOW). The precision of δ2H and δ18O measure-ments was 0.3 and 0.1 ‰, respectively.
10
Measurements of electrical conductivity (EC) were obtained in situ for each water sample collected for isotope analysis using a portable EC meter (Oakton, Model 300 Series).
2.4.4 Hydrograph separation
A one-tracer two-component HS analysis was conducted to separate storm runoffinto
15
its pre-event and event water sources using the following mixing equation (Pinder and Jones, 1969; Sklash and Farvolden, 1979):
QtCt=QpCp+QeCe (6)
where Qt, Qp and Qe refer to total streamflow, pre-event and event water volumes,
20
respectively, andCt,CpandCeare the correspondingδ 2
H orδ18O isotope ratios. The average of the tracer concentrations in the baseflow samples taken prior to the storm was taken as representative ofCp(Sklash and Farvolden, 1979).Ceat a specific time was calculated as the weighted mean of the isotopic composition of the rainfall samples up to that time (McDonnell et al., 1990). In addition, a two-tracer three-component HS
25
HESSD
10, 5269–5314, 2013Land use change effects on runoff
generation
L. E. Mu ˜noz-Villers and J. J. McDonnell
Title Page
Abstract Introduction
Conclusions References
Tables Figures
◭ ◮
◭ ◮
Back Close
Full Screen / Esc
Printer-friendly Version
Interactive Discussion
Discussion
P
a
per
|
Dis
cussion
P
a
per
|
Discussion
P
a
per
|
Discussio
n
P
a
per
|
(both components of pre-event water) to storm runoff, using the measuredδ2H orδ18O isotope ratios and EC concentrations (Ogunkoya and Jenkins, 1993):
QtCt=QeCe+QsCs+QgCg (7)
whereQt,Qe,Qs and Qg are the assumed components of total storm runoff
(stream-5
flow, event, soil and ground water volumes, respectively), andCt,Ce, Cs and Cg are the corresponding tracer concentrations. In this study,Cs was calculated as the aver-age value of the tracer concentrations across soil depths and topographic positions in the catchment.Cgwas assumed equal to the average tracer concentration of baseflow measured prior to the storm (i.e.Cp). The uncertainty associated in the calculation of
10
the pre-event fractions was quantified using the error propagation technique proposed by Genereux (1998) at the 0.05 confidence level.
3 Results
3.1 Rainfall characteristics
During the two-year study period (1 June 2008–31 May 2010), mean annual
precipi-15
tation (P) was very similar between the forest catchments (3371 mm for the MAT and 3326 mm for the SEC) and only slightly lower in the pasture (3159 mm); on average, 82 % of the annualP fell during the wet season (May–October). Average monthly pre-cipitation during the rainy season (455±239 mm) was five times that observed during the dry season (93±47 mm). Average daily rainfall was 15±20 mm (range: 0–111 mm)
20
for the wet season versus 3±7 mm (range: 0–56 mm) for the dry season across all sites.
3.2 Streamflow and hydrologic metrics
During the study period, mean annual streamflow was higher in the pasture (1554 mm, on average) compared to the MAT (1268 mm) and SEC (1414 mm). The higher
HESSD
10, 5269–5314, 2013Land use change effects on runoff
generation
L. E. Mu ˜noz-Villers and J. J. McDonnell
Title Page
Abstract Introduction
Conclusions References
Tables Figures
◭ ◮
◭ ◮
Back Close
Full Screen / Esc
Printer-friendly Version
Interactive Discussion
Discussion
P
a
per
|
Dis
cussion
P
a
per
|
Discussion
P
a
per
|
Discussio
n
P
a
per
|
streamflow in the PAS was also reflected in the value of the Mean RunoffRatio (MRR), which was 0.50 on average for the PAS versus 0.38 and 0.43 for the MAT and SEC, re-spectively. In each catchment, baseflow (Qbf) accounted for the majority of streamflow (91, 87 and 93 % in the MAT, SEC and PAS, respectively); expressed as a percentage ofP,Qbfwas 34 % for the MAT, 37 % for the SEC and 46 % for the PAS. Total quickflow
5
(Qqf) was very low in the three studied catchments; expressed as a percentage ofP, Qqfwas 4, 6 and 4 % in the MAT, SEC and PAS, respectively.
The mean monthly flow during the wet season was highest in the PAS (215± 168 mm), followed by SEC (195±148 mm) and then by MAT (183±141 mm). Stream flow during the dry season consisted almost entirely of baseflow in each study
catch-10
ment; mean monthly streamflow for this period was very similar for the PAS (44±35 mm) and SEC (41±18 mm), but considerably lower for the MAT (28±19 mm).
Although the mean annual flow (MAF) was higher in the PAS compared to the forests, the three catchments displayed similar variations around their mean values (CVQ; Ta-ble 2).
15
Flow duration curve (FDC) analysis showed that the greatest variability in hydrolog-ical regime occurred in the PAS, showing the highest and lowest discharge above the Q5 and below Q95, respectively, as well as the steepest slope (SFDC; Fig. 2, Table 2). The SEC showed the flattest FDC, with discharges that were greater than those ob-served in MAT and PAS below Q25. In agreement with the FDC analysis, mean annual
20
high flows (MAHF) were higher in the pasture in comparison to the forests (Table 2), meanwhile mean annual low flows (MALF) were the lowest in the PAS and highest in the SEC.
In all three catchments, Base Flow Indexes (BFIs) were generally high (91, 89 and 95 % for the MAT, SEC and PAS, respectively), as well as the recession constants
25
HESSD
10, 5269–5314, 2013Land use change effects on runoff
generation
L. E. Mu ˜noz-Villers and J. J. McDonnell
Title Page
Abstract Introduction
Conclusions References
Tables Figures
◭ ◮
◭ ◮
Back Close
Full Screen / Esc
Printer-friendly Version
Interactive Discussion
Discussion
P
a
per
|
Dis
cussion
P
a
per
|
Discussion
P
a
per
|
Discussio
n
P
a
per
|
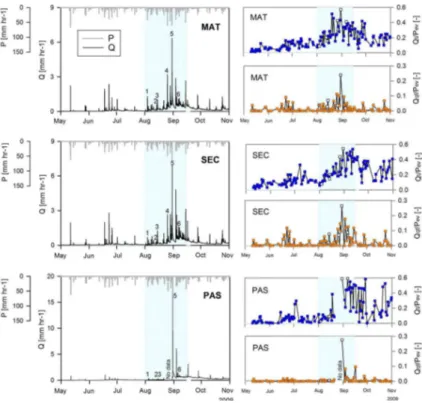
3.3 The 2009 wetting-up cycle
3.3.1 Catchment event response
During the 6-week wetting-up cycle (1 August–14 September 2009), total rainfall in each of the three catchments was approximately 1200 mm, delivered by 46 discrete rainfall events in the forests and 43 events in the pasture. The forest streams responded
5
to 42 of the 46 storms identified. Due to the temporary absence of the water level recorder in the PAS, runoffdata were available for only 36 of the 43 storms identified, from which 35 produced a response in the stream. Note that the rainfall-runoffanalysis presented below was performed using only those storms for which data from all three sites were available.
10
During the 6-week wetting-up cycle, the seven-day antecedent precipitation index (API7) increased from 9 to 319 mm, indicating a shift from relatively dry to very wet conditions. There was no statistically significant difference (p >0.05) between rainfall event amounts (Pev) recorded at the three sites. Pev ranged between 1 and 118 mm (28±24 mm on average), maximum hourly intensities (I60 max) from 0.8 to 68 mm h−1
15
(16±15 mm h−1) and event durations (Tp) between 1 and 15 h (5±3 h).
It was observed that nearly equal rain event inputs produced very different stream-flow responses in the pasture as compared to the forests. Conversely, the forest streams generated remarkably similar rainfall-runoff responses, as shown in Fig. 3. In the first half of the wetting-up cycle (1 August–25 August 2009), the pasture
pro-20
duced rainfall-runoffratios (Qt/Pev) that were significantly lower (0.09±0.08;p≤0.001) than those generated by the MAT (0.19±0.10) and SEC (0.17±0.07). Corresponding quickflow event ratios (Qqf/Pev) were 0.03±0.03 and 0.03±0.04 for the MAT and SEC, respectively, whereas they were less than 0.01 in the pasture. In this same period, the pasture showed a mean peak discharge (0.2 mm h−1) that was half those observed
25
HESSD
10, 5269–5314, 2013Land use change effects on runoff
generation
L. E. Mu ˜noz-Villers and J. J. McDonnell
Title Page
Abstract Introduction
Conclusions References
Tables Figures
◭ ◮
◭ ◮
Back Close
Full Screen / Esc
Printer-friendly Version
Interactive Discussion
Discussion
P
a
per
|
Dis
cussion
P
a
per
|
Discussion
P
a
per
|
Discussio
n
P
a
per
|
those for the MAT (0.9 mm h−1) and SEC (0.9 mm h−1). In contrast, in the second half of the wetting-up period (from 25 August onwards), the pasture showed higherQt/Pev ratios (0.42±0.14) than the forests (0.30±0.13 and 0.39±0.12 for the MAT and SEC, respectively). Although mean peak discharge and variance were higher for all three sites compared to the first half of the wetting-up period, the PAS showed this time
5
higher values (mean peak discharge±σ2: 2±10.2 mm h−1) as compared to the MAT (1.3±2.3 mm h−1) and SEC (1.7±3.2 mm h−1).
Over the entire wetting-up cycle, the PAS showed the shortest lag times (range: 10– 90 min) and time to peak discharges (range: 10–150 min) as compared to the MAT (20–140 min, 20–280 min, respectively) and SEC (10–140 min, 30–260 min,
respec-10
tively). The lag time distribution of the MAT differed significantly from the PAS (p≤ 0.001) and SEC (p=0.012), meanwhile no significant differences were found between the PAS and SEC (p≥0.05). The distribution of time to peak discharges was not sta-tistically different among sites (p≥0.05). For all sites, peakflows correlated well with Pev (r
2
=0.72 on average) andI60 max (r 2
=0.75), yet poorly with API7 (r2≤0.3). Lag
15
times and times to peak discharge showed generally low correlations withPev(r 2
≤0.2 on average),I60 max(r
2
≤0.3) and API7(r2≤0.2).
3.3.2 Selected storms for hydrograph separation
A total of nine storms out of thirteen sampled during the wetting-up cycle fulfilled the earlier defined criteria (Sect. 2.4.2). For the MAT and SEC, six out of these nine events
20
showed enough difference between event and pre-event tracer concentrations to per-form storm hydrograph separation. Due to the temporary absence of the water level recorder in the PAS (see Sect. 3.2), three out of the nine storms had to be discarded; from the six storms remaining, five were suitable for HS analysis.
Characteristics of the six storms analyzed in detail are presented in Table 3. In
25
HESSD
10, 5269–5314, 2013Land use change effects on runoff
generation
L. E. Mu ˜noz-Villers and J. J. McDonnell
Title Page
Abstract Introduction
Conclusions References
Tables Figures
◭ ◮
◭ ◮
Back Close
Full Screen / Esc
Printer-friendly Version
Interactive Discussion
Discussion
P
a
per
|
Dis
cussion
P
a
per
|
Discussion
P
a
per
|
Discussio
n
P
a
per
|
(between 15:00 and 19:00 LT). Average storm size, duration and maximum intensity were 46 mm, 3 h and 29 mm h−1, respectively.
For the storms,Qt/Pev ratios ranged from 0.11 to 0.54 in the MAT, from 0.07 to 0.52 in the SEC and from 0.03 to 0.59 in the PAS, and showed a progressive increase as antecedent wetness increased (Table 3). In all three catchments, the increases in the
5
rainfall-runoff ratios were associated with increases in baseflow contributions to total stormflow (from 55 to 92 % in the MAT, 53 to 87 % in the SEC and 50 to 97 % in the PAS).
For all three catchments, the maximum rainfall-runoff event responses were ob-served during Storm 5, which was the largest and most intense event obob-served during
10
the study period that ocurred when antecedent wetness was high (Table 3). Peakflow discharge in this storm was almost two times higher in the PAS (11.8 mm h−1) as com-pared to the MAT (6.35 mm h−1) and SEC (6.90 mm h−1).
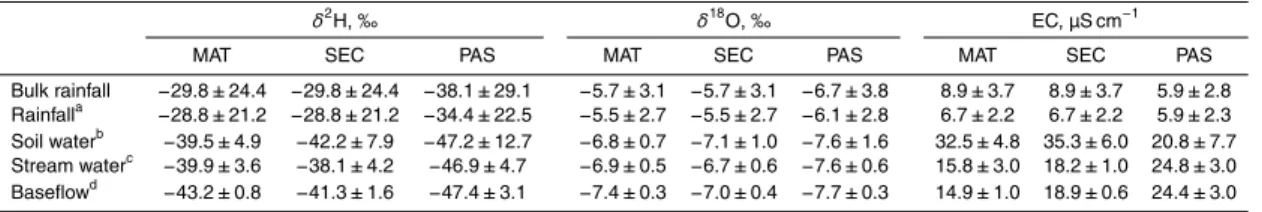
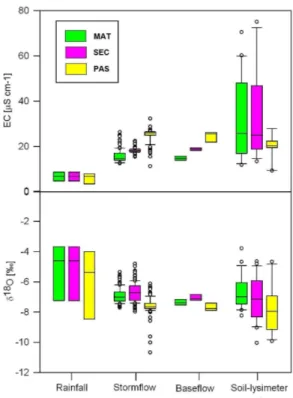
3.3.3 End-members signatures (2H,18O, EC)
The isotope ratio in bulk rainfall samples of the storms analyzed ranged from −88.7
15
to−10.3 ‰ forδ2H and from −13.2 to−2.7 ‰ forδ18O. Corresponding values of EC ranged from 2.4 to 14.2 µS cm−1. Isotope ratios and EC values in rainfall samples were not statistically different between the sampling locations (p=0.421 forδ2H;p=0.548 forδ18O; andp=0.269 for EC). Although the samples of throughfall taken in the MAT and SEC were somewhat enriched inδ18O andδ2H (−4.4 and−19.5 ‰ on average,
20
respectively) as compared to rainfall (−5.7 and −29.8 ‰ on average, respectively), differences were not statistically different (p≥0.05). In contrast to rainfall, the isotopic variation in stream baseflow was very small (Table 4, Fig. 4). The EC concentrations in storm runoffwere generally low (range: 11 to 32 µS cm−1) and statistically different among sites (p≤0.001). Isotope ratios in samples of storm runoff were similar for
25
HESSD
10, 5269–5314, 2013Land use change effects on runoff
generation
L. E. Mu ˜noz-Villers and J. J. McDonnell
Title Page
Abstract Introduction
Conclusions References
Tables Figures
◭ ◮
◭ ◮
Back Close
Full Screen / Esc
Printer-friendly Version
Interactive Discussion
Discussion
P
a
per
|
Dis
cussion
P
a
per
|
Discussion
P
a
per
|
Discussio
n
P
a
per
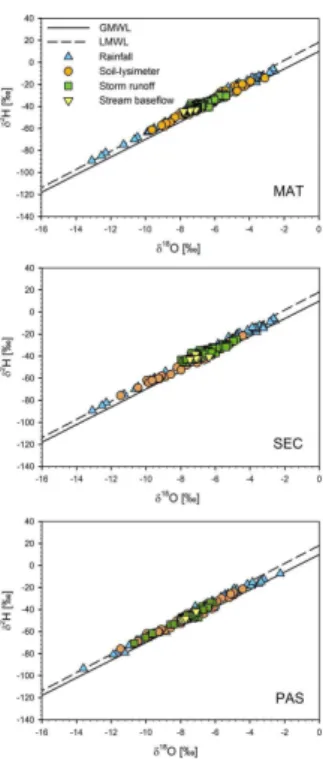
|
higher compared to stream baseflow, whereas the opposite was observed in most of the storms in the PAS. Figure 5 shows that the samples of rainfall, soil-lysimeter water, baseflow and storm runoff all fall along the local meteoric water line (LMWL), with no evidence of evaporative enrichment of the water isotopes in the three catchments.
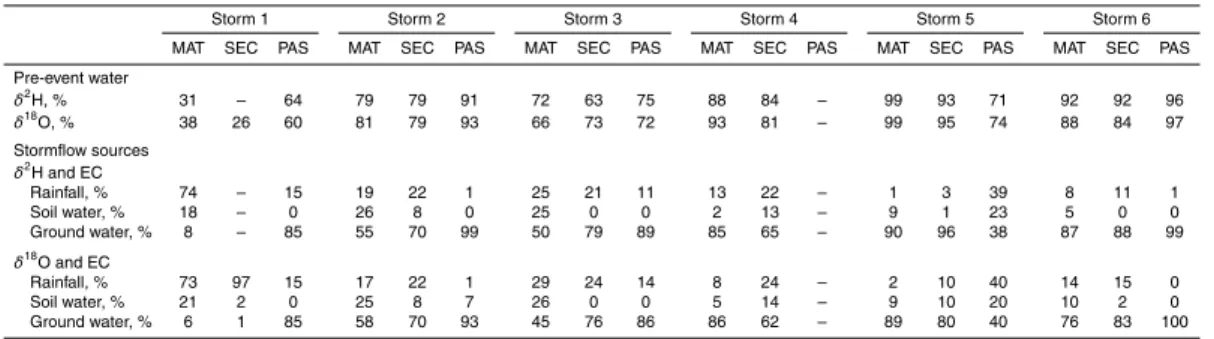
3.3.4 Stormflow sources
5
The one-tracer (δ2H, δ18O) two-component HS analysis showed a progressive in-crease of pre-event water contributions to total storm runofffrom 35 to 99 % (on av-erage, using both δ2H and δ18O) in the MAT and from 26 to 92 % in the SEC as antecedent wetness increased (Table 5). Although in the PAS, pre-event water contri-butions to storm runoff also increased across the wetting-up cycle (from 62 to 97 %),
10
there were marked differences with the forests: (1) for the first storm sampled un-der relatively dry antecedent conditions, the PAS generated much lower event water discharges (38 %) than the MAT (66 %) and SEC (74 %; Fig. 6); and (2) for Storm 5 sampled under very wet antecedent conditions, event water discharges in the pasture (28 %) were much higher than those generated from the forests (1 and 6 % for the MAT
15
and SEC, respectively; Fig. 6).
Interestingly, the highest pre-event water contribution to total stormflow observed in the forests occurred during the largest and most intense rainfall event (Storm 5), whereas in the pasture these occurred during Storms 2 and 6, which were considerably smaller and of much lower intensity compared to Storm 5 (Table 5).
20
It should be noted that the difference found in pre-event fractions as derived using ei-therδ2H orδ18O were very small for all storms analyzed, ranging on average between 4 and 5 %. The average uncertainty in the calculated pre-event water fractions using δ2H was 9, 10 and 7 % for the MAT, SEC and PAS, respectively, and 16, 20 and 20 % forδ18O, respectively.
25
HESSD
10, 5269–5314, 2013Land use change effects on runoff
generation
L. E. Mu ˜noz-Villers and J. J. McDonnell
Title Page
Abstract Introduction
Conclusions References
Tables Figures
◭ ◮
◭ ◮
Back Close
Full Screen / Esc
Printer-friendly Version
Interactive Discussion
Discussion
P
a
per
|
Dis
cussion
P
a
per
|
Discussion
P
a
per
|
Discussio
n
P
a
per
|
However, as antecedent wetness increased (Storms 2, 3 and 4), soil and ground-water contributions to storm runoff increased, and groundwater became rapidly the largest component of the pre-event water fraction in both forest catchments (Table 5). When antecedent wetness was at the highest (Storms 5 and 6), stormflow in the MAT and SEC was completely pre-event water dominated and consisted almost entirely of
5
groundwater (82 and 86 % on average for storms 5 and 6, respectively). Surprisingly, in both forests, ground water contributions to total stormflow were highest during Storm 5 (90 and 88 % for the MAT and SEC, respectively; Table 5, Fig. 7), which was the largest and most intense storm of the study period.
For most of the storms, ground water sources also dominated the storm runoffin the
10
PAS (Table 6), except for Storm 5 during which the pre-event water discharge consisted on average for 22 and 39 % of soil and ground water, respectively (Fig. 7).
In agreement with the one-tracer two-component HS analysis, the most pronounced differences found between the stormflow response of the forests and pasture catch-ments occurred under contrasting antecedent wetness conditions, and in the largest
15
and most intense event sampled. At the beginning of the wetting-up period (Storm 1), event water sources in runoffwere 5-fold and 7-fold higher in the MAT (74 %) and SEC (97 %) as compared to the PAS (15 %). During the largest rainfall event occurring at the end of the wetting-up cycle (Storm 5), the event water contribution in storm runofffrom the PAS (40 %) was 6- to 20-fold higher compared to the SEC (7 %) and MAT (2 %),
20
respectively (Table 5; Fig. 7).
Regression analysis showed that the event water fraction in stormflow from the pas-ture was strongly, positively correlated with storm characteristics, such as total rainfall, Pev (r
2
=0.91) and the maximum hourly rainfall intensity, I60 max (r 2
=0.94), whereas no correlation was found with API7(r
2
=0.01). In contrast, event water contributions to
25
runofffrom the forests showed a strong, inverse correlation with API7 (r2=0.65 and 0.63 for the MAT and SEC, respectively), yet very poor relationships withPev(r
2
=0.12 and 0.10, respectively) and no correlation withI60 max(r
2
HESSD
10, 5269–5314, 2013Land use change effects on runoff
generation
L. E. Mu ˜noz-Villers and J. J. McDonnell
Title Page
Abstract Introduction
Conclusions References
Tables Figures
◭ ◮
◭ ◮
Back Close
Full Screen / Esc
Printer-friendly Version
Interactive Discussion
Discussion
P
a
per
|
Dis
cussion
P
a
per
|
Discussion
P
a
per
|
Discussio
n
P
a
per
|
3.3.5 Stream discharge-EC hysteretic relations
Across the wetting-up cycle, the MAT showed a consistent clockwise hysteretic loop where discharge was positively related to EC concentrations (r2=0.73 on average). The EC showed its maximum values and greatest variability in Storm 1. In contrast, counterclockwise loops dominated in the PAS. As antecedent wetness increased, the
5
stream discharge-EC relationships became more negative at this site; the lowest EC concentrations (most diluted) were observed at peak discharge in Storm 5 (Fig. 7). The behavior in the SEC showed a combination of both hysteretic patterns, a clockwise loop from Storm 1 to 4 that shifted to a counterclockwise loop from Storm 5 onwards.
4 Discussion
10
Our process-based hydrological work showed very similar catchment annual and sea-sonal streamflow regimes, and storm runoff event responses for the 20 yr-old regen-erating forest and the old-growth forest. For the 2 yr time series, the pasture showed higher annual streamflows in comparison to the forested catchments, mostly through an increase in baseflow. Major differences in storm runoffcharacteristics, flow sources
15
and pathways between the two forests and the pasture catchments were only ex-pressed under conditions of high rainfall intensity and high antecedent wetness. For most events and at all three catchments, vertical soil water percolation through the permeable volcanic soils and underlying substrate promoted storm runoff responses that were dominated by subsurface flow processes.
20
4.1 Similarities in runoffgeneration between the mature and secondary cloud forest
Annual runoffratios (Q/P) for the two hydrological years were on average 5 % higher (145 mm) in the regenerating forest as compared to the mature forest catchment. Changes in streamflow after cloud forest disturbance or conversion to other land covers
HESSD
10, 5269–5314, 2013Land use change effects on runoff
generation
L. E. Mu ˜noz-Villers and J. J. McDonnell
Title Page
Abstract Introduction
Conclusions References
Tables Figures
◭ ◮
◭ ◮
Back Close
Full Screen / Esc
Printer-friendly Version
Interactive Discussion
Discussion
P
a
per
|
Dis
cussion
P
a
per
|
Discussion
P
a
per
|
Discussio
n
P
a
per
|
reflect concurrent changes in evapotranspiration (ET) and cloud water interception (Bruijnzeel et al., 2011). Previous work at this site showed that inputs of cloud water interception by the mature and secondary cloud forests are very low (≤2 % of annual P; Holwerda et al., 2010), so that the observed differences in streamflow most likely reflect differences in ET. Mu ˜noz-Villers et al. (2012) showed that while annual
transpi-5
ration totals of both forests were nearly equal (∼790 mm), rainfall interception loss by the secondary forest (∼280 mm yr−1, 8 % ofP) was about half that by the mature forest (∼560 mm yr−1, 16 % of P; Holwerda et al., 2010). The smaller loss observed for the secondary forest was attributed to a lower canopy water storage capacity, related in turn to a lower leaf area index and lower epiphyte biomass (Holwerda et al., 2010).
10
Hence, the small difference in total annual streamflow found between the forests most likely reflects a difference in interception loss (Mu ˜noz-Villers et al., 2012).
The hydrological similarities between the forests were also reflected in their storm runoff generation mechanisms. From our storm hydrograph separation analysis car-ried out during the 6-week wetting-up period, we observed that both forest catchments
15
showed remarkably similar event runoffratios that, along with baseflow contributions to stormflow, progressively increased as the wetting-up cycle advanced. We also ob-served almost identical contributions of pre-event water sources to total stormflow across the sequence of rain events sampled in the regenerating forest and mature forest. As antecedent wetness increased, the role of subsurface water pathways
in-20
creased in importance and ground water sources became ultimately the largest compo-nent of storm runoffgeneration (as also shown by Mu ˜noz-Villers and McDonnell, 2012). These findings are consistent with hydrometric results obtained from a steep forested headwater catchment on volcanic substrate at Hitachi Ohta Experimental Watershed, Japan, where Sidle et al. (2000) and Sidle (2006) observed that hillslope subsurface
25
flow increased as antecedent wetness increased.
HESSD
10, 5269–5314, 2013Land use change effects on runoff
generation
L. E. Mu ˜noz-Villers and J. J. McDonnell
Title Page
Abstract Introduction
Conclusions References
Tables Figures
◭ ◮
◭ ◮
Back Close
Full Screen / Esc
Printer-friendly Version
Interactive Discussion
Discussion
P
a
per
|
Dis
cussion
P
a
per
|
Discussion
P
a
per
|
Discussio
n
P
a
per
|
The mature forest showed a consistent clockwise hysteretic relationship between storm event runoffand stream conductivity. Conversely, the secondary forest showed a shift from a clockwise to a counterclockwise loop direction from Storm 5 onwards. This change in the hysteretic behavior might appears to suggest a small increase in the contribution of the shallow lateral sources to storm runoffin the secondary forest, and
5
might have been triggered by the high rainfall intensity occurring under conditions of very high antecedent wetness. We speculate that such change is due more to catch-ment subsurface characteristics than to forest age or stand characteristics. More work is needed to separate the pedo-geological and vegetation influences.
Runoff generation processes in catchments covered with secondary tropical forest
10
are virtually undocumented (Bruijnzeel, 2004), despite it is becoming the dominant land vegetation cover in humid tropical regions (Giambelluca, 2002). Our findings suggest that 20 yr of natural regeneration after forest disturbance may be sufficient to largely restore the original catchment hydrology of this tropical forest ecosystem. Rates of forest regrowth, and with it the rate of hydrological recovery, depend largely on the
15
duration and intensity of the land use prior to regeneration and the associated degree of soil degradation (Ziegler et al., 2004; Zimmermann et al., 2006). For the secondary forest under investigation, soil conditions prior to regeneration are unknown. Hence, it remains uncertain whether the full 20 yr recovery period was needed to restore hydro-logical behavior or to what extent this was achieved before the present observations
20
started. At any rate, the present results highlight the importance of protecting and pro-moting naturally regenerating forest to restore hydrological processes of ecosystems and provide environmental services to society.
4.2 Effects of forest conversion to pasture on runoffresponse
The annual runoffratio in the pasture was on average 12 % (286 mm) and 9 % (145 mm)
25
HESSD
10, 5269–5314, 2013Land use change effects on runoff
generation
L. E. Mu ˜noz-Villers and J. J. McDonnell
Title Page
Abstract Introduction
Conclusions References
Tables Figures
◭ ◮
◭ ◮
Back Close
Full Screen / Esc
Printer-friendly Version
Interactive Discussion
Discussion
P
a
per
|
Dis
cussion
P
a
per
|
Discussion
P
a
per
|
Discussio
n
P
a
per
|
data from this site (Mu ˜noz-Villers et al., 2012) showed that measured annual ET (tran-spiration plus rainfall interception loss) in the mature and secondary cloud forests were 1350 and 1065 mm, respectively. While no direct measurements of transpiration and rainfall interception for the pasture are available, a FAO Penman-Monteith reference ET calculated for the pasture site would suggest an annual ET of 855 mm (Mu
˜noz-5
Villers et al., 2012). Furthermore, the fact that the grass was very short (Sect. 2.1), and thus must have had a low water storage capacity suggests that the interception loss by the pasture was very small compared to the forests (cf. Gash and Shuttleworth, 1991). Finally, a lower ET of the pasture as compared to the forests is consistent with the increase in streamflow observed in the form of baseflow.
10
Our 12 % (286 mm) annual streamflow increment observed for the pasture catchment compares somewhat lower with the 17 % (377 mm on average) increment observed by Germer et al. (2010) and Moraes et al. (2006) for two adjacent zero-order stream micro-catchments covered with undisturbed open tropical rainforest and pasture on Ultisols in Rondonia, northwestern Brazil.
15
Overall, our findings fall within the range of expected increases in annual flows after converting forest to pasture in tropical areas (150–300 mm yr−1, depending on rainfall; Fritsch, 1993; Jipp et al., 1998), where the results from the different regions seem to be mostly dependent on the expected difference in ET (mainly evaporation) between the former and new vegetation cover (Bruijnzeel, 2004, 2005).
20
Flow duration curves showed the greatest variability in hydrological regime in the pasture, with higher discharges at high flows in the rainy season and lower discharges at low flows during the dry period. Further, our event-based analysis showed rainfall-runofftime responses that were generally shorter as compared to the forests. Likewise, the mean and variance of peakflow in the pasture were higher, notably at high
an-25
HESSD
10, 5269–5314, 2013Land use change effects on runoff
generation
L. E. Mu ˜noz-Villers and J. J. McDonnell
Title Page
Abstract Introduction
Conclusions References
Tables Figures
◭ ◮
◭ ◮
Back Close
Full Screen / Esc
Printer-friendly Version
Interactive Discussion
Discussion
P
a
per
|
Dis
cussion
P
a
per
|
Discussion
P
a
per
|
Discussio
n
P
a
per
|
pasture on ET (Bruijnzeel, 2004; Jipp et al., 1998) and soil hydraulic properties (Tob ´on et al., 2010; Ziegler et al., 2004; Zimmermann et al., 2006) in the tropics. Both effects combined can modify the frequency, timing and magnitude of catchment stormflow re-sponses (Chaves et al., 2008; Germer et al., 2009; Roa-Garc´ıa et al., 2011) and runoff
generation mechanisms, with a shift from subsurface to surface or near-surface flow
5
pathways (Chaves et al., 2008; Molina et al., 2007).
The baseflow in the pasture at the end of the dry season (March–April) was about 35 and 70 % lower compared to the mature and secondary forest, respectively. A possible explanation for this is a lower recharge of subsurface water storages during the rainy season due to the lower rainfall infiltration capacity of the soil in the pasture.
Never-10
theless, we cannot rule out a topographic control on these differences in dry season flows. In this regard, Sayama et al. (2011) showed for permeable bedrock substrates in California that catchments with steep gradients tend to store more water than those characterized by gentle slopes, and can therefore sustain dry season flows for longer periods. If so, the fact that forest catchments have steeper slopes as compared to the
15
pasture might be an alternative explanation for their higher baseflows during the dry season.
As it was also shown for the forests, our storm hydrograph separation analysis in the pasture demonstrated progressive increases of rainfall-runoff event ratios across the wetting-up cycle, with stormflow compositions that were entirely dominated by
pre-20
event water sources. Although ground water discharge was also the main source of the subsurface stormflow in the pasture, it appeared to be delivered from a shallower subsurface compartment as compared to the forests. This is supported by the more depleted values and greater variation observed of the isotopic composition of the storm runoffand the consistent counterclockwise hysteresis loop (dilution pattern) observed
25
in the relationship between the stormflow discharge and EC concentrations.
It is interesting that despite the one to two orders of magnitude lower surface soil hydraulic conductivity in the pasture as compared to the forests (Table 1), storm runoff
HESSD
10, 5269–5314, 2013Land use change effects on runoff
generation
L. E. Mu ˜noz-Villers and J. J. McDonnell
Title Page
Abstract Introduction
Conclusions References
Tables Figures
◭ ◮
◭ ◮
Back Close
Full Screen / Esc
Printer-friendly Version
Interactive Discussion
Discussion
P
a
per
|
Dis
cussion
P
a
per
|
Discussion
P
a
per
|
Discussio
n
P
a
per
|
is that for most of our monitored storms, the average rainfall infiltration rate of the soil was still higher than the average rainfall intensity. In addition, the lower slope gradients of the pasture as compared to the forests could have played a role. Nevertheless, the high correlation found between the event water contributions and rainfall characteristics (amount and intensity) suggests that infiltration excess overland flow did occur in the
5
pasture in response to large storms of high intensity (see also below).
Our findings contrast with those obtained by Chaves et al. (2008), Germer et al. (2010) and Moraes et al. (2006) for undisturbed rainforest and pasture catch-ments in Rondonia, Brazil. For a series of storms sampled in the wet season, Chaves et al. (2008) found that event water contributions accounted for 79 and 67 % of the
10
total stormflow in the early, and 51 and 57 % in the late wet season for the forest and pasture, respectively. These results were attributed to the strong decrease of hydraulic conductivity with depth that characterizes the soils of their study area, favoring infiltrat-ing water to be routed via surface and near-surface pathways, so that saturation-excess overland flow was the dominant stormflow generation process in both land covers.
15
Comparing our results for the forests with those for the pasture across the sequence of storms sampled, there were two rain events that occurred under contrasting an-tecedent wetness for which clear differences in catchment response and runoff gen-eration mechanisms were observed. Firstly, in the first storm sampled under dry an-tecedent conditions, the forests had much higher event water contributions compared
20
to the pasture. A possible explanation for this might be a (temporal) difference in soil hydrophobicity among the land cover types. Although no data on soil water repellency in the investigated catchments are available, studies on Andisols in southern Chile have demonstrated that this property is strongest and more persistent in forested soils with high organic carbon and nutrient contents in the upper horizons (Ellis et al., 2003).
25
HESSD
10, 5269–5314, 2013Land use change effects on runoff
generation
L. E. Mu ˜noz-Villers and J. J. McDonnell
Title Page
Abstract Introduction
Conclusions References
Tables Figures
◭ ◮
◭ ◮
Back Close
Full Screen / Esc
Printer-friendly Version
Interactive Discussion
Discussion
P
a
per
|
Dis
cussion
P
a
per
|
Discussion
P
a
per
|
Discussio
n
P
a
per
|
produce some overland flow and/or pseudo overland flow (McDonnell et al., 1991a,b), resulting in the initial high event water response. Secondly, for the largest event of our study period (Storm 5), with a return period of about 2 yr (F. Holwerda, unpublished data), that occurred under wet antecedent conditions, the pasture showed about seven times more event water contribution to stormflow (28–40 %) as compared to the forests
5
(1–10 %). We attribute this difference to a much lower surface soil infiltration capacity of the pasture and, to a lesser extent, a much lower rainfall interception loss as com-pared to the forests. Where the forests were able to mitigate the impact of this large and intense storm, despite the high antecedent wetness conditions, rainfall rates probably exceeded surface soil infiltration capacities in the pasture, promoting overland flow and
10
resulting in the higher event water fraction as compared to the forests.
5 Conclusions
We found very similar annual and seasonal streamflow regimes, and storm runoffevent responses in the mature and secondary forest catchments. Conversely, the pasture catchment showed 10 % higher mean annual streamflow, which most likely reflects
15
a lower rainfall interception. However, at the end of the dry season, baseflow was low-est in the pasture, possibly due to a lower soil infiltration capacity and thus reduced recharge of subsurface water storages. A smaller catchment water storage capacity associated to lower slope gradients in the pasture may also have played a role.
During the 6-week wetting-up cycle, rainfall-runoffevent ratios increased at all three
20
catchments (from 7 to 55 % on average). As antecedent wetness increased, pre-event water contributions to total storm runoffalso increased from 35 to 99 % in the mature forest, 26 to 92 % in the secondary forest and 64 to 97 % in the pasture. Our results also suggest that in all three catchments and for most of the storms, the permeability of the volcanic soils and substrate leaded to vertical rainfall percolation and recharge
25
HESSD
10, 5269–5314, 2013Land use change effects on runoff
generation
L. E. Mu ˜noz-Villers and J. J. McDonnell
Title Page
Abstract Introduction
Conclusions References
Tables Figures
◭ ◮
◭ ◮
Back Close
Full Screen / Esc
Printer-friendly Version
Interactive Discussion
Discussion
P
a
per
|
Dis
cussion
P
a
per
|
Discussion
P
a
per
|
Discussio
n
P
a
per
|
high antecedent wetness conditions, the much higher event water contribution in the pasture (28–40 % versus 1–10 % in the forests) suggests that for this storm the rainfall infiltration capacity of the soil in the pasture was exceeded, causing infiltration-excess overland flow to occur. The latter result shows that despite the high permeability of the volcanic soils in this region, forest conversion to pasture might cause important
5
shifts in runoff generation processes, sources and pathways during large and high intensity storms. On other hand, our results also showed the importance of protecting and promoting naturally regenerating forest to restore hydrological processes in this TMCF environment.
Acknowledgements. We thank the Municipality of Coatepec (Veracruz, Mexico) and the
resi-10
dents of Loma Alta and Tierra Grande for permitting us to work on their land. We would also like to thank Friso Holwerda for providing the rainfall data and for his valuable comments on the manuscript, and Daniel Geissert for sharing the soil physical data of the pasture catchment. Tina Garland and Caroline Patrick are thanked for their assistance in analyzing the isotope samples, and Ad ´an Hern ´andez and Sergio Cruz are thanked for their great help in the field.
15
This research was founded by a US National Science Foundation (NSF/DEB 0746179) grant to H. Asbjornsen, T. E. Dawson and J. J. McDonnell, and by Mexico-CONACyT (Repatriaci ´on Program, No. 170890) grant to L. E. Mu ˜noz-Villers.
References
Arnold, J. G. and Allen, P. M.: Automated methods for estimating baseflow and ground water
20
recharge from streamflow records, J. Am. Water Resour. As., 35, 411–424, 1999.
B ´aez, A. P., Padilla, H., Cervantes, J., Pereyra, D., and Belmont, R.: Rainwater chemistry at the eastern flanks of the Sierra Madre Oriental, Veracruz, Mexico, J. Geophys. Res.-Atmos., 102, 23329–23336, 1997.
Baker, D. B., Richards, R. P., Timothy, T., Loftus, T. T., and Kramer, J. W.: A new flashiness index:
25
![Table 2. Mean annual flow (MAF), coe ffi cient of variation of stream discharge (CV Q ), mean annual high flow (MAHF) and mean annual low flow (MALF) (all expressed in mm) plus slope of the flow duration curve (S FDC [–]) for each of the study catchments o](https://thumb-eu.123doks.com/thumbv2/123dok_br/18398766.358429/36.918.233.474.284.463/table-annual-variation-stream-discharge-expressed-duration-catchments.webp)