TCD
9, 3807–3820, 201520th century glacier mass loss estimates
consistent
B. Marzeion et al.
Title Page
Abstract Introduction
Conclusions References
Tables Figures
◭ ◮
◭ ◮
Back Close
Full Screen / Esc
Printer-friendly Version Interactive Discussion
Discussion
P
a
per
|
Discussion
P
a
per
|
Discussion
P
a
per
|
Discussion
P
a
per
|
The Cryosphere Discuss., 9, 3807–3820, 2015 www.the-cryosphere-discuss.net/9/3807/2015/ doi:10.5194/tcd-9-3807-2015
© Author(s) 2015. CC Attribution 3.0 License.
This discussion paper is/has been under review for the journal The Cryosphere (TC). Please refer to the corresponding final paper in TC if available.
Brief Communication: Global glacier
mass loss reconstructions during the
20th century are consistent
B. Marzeion1, P. W. Leclercq2, J. G. Cogley3, and A. H. Jarosch4
1
Institute of Meteorology and Geophysics, University of Innsbruck, Innsbruck, Austria
2
Department of Geosciences, University of Oslo, Oslo, Norway
3
Department of Geography, Trent University, Peterborough, Canada
4
Institute of Earth Sciences, University of Iceland, Reykjavik, Iceland
Received: 23 June 2015 – Accepted: 25 June 2015 – Published: 20 July 2015
Correspondence to: B. Marzeion ([email protected])
TCD
9, 3807–3820, 201520th century glacier mass loss estimates
consistent
B. Marzeion et al.
Title Page
Abstract Introduction
Conclusions References
Tables Figures
◭ ◮
◭ ◮
Back Close
Full Screen / Esc
Printer-friendly Version Interactive Discussion
Discussion
P
a
per
|
Discussion
P
a
per
|
Discussion
P
a
per
|
Discussion
P
a
per
|
Abstract
Estimates of the contribution of glaciers to sea-level rise during the 20th century that were published in recent years are strongly divergent. Advances in data availability have allowed revisions of some of these published estimates. Here we show that outside of Antarctica, the global estimates of glacier mass loss obtained from
5
glacier-length-based reconstructions and from a glacier model driven by gridded climate observations are now consistent with each other, and also with an estimate for the years 2003–2009 that is mostly based on remotely sensed data. This consistency is found throughout the entire common periods of the respective data sets. Inconsistencies of reconstructions and observations persist in estimates on regional
10
scales.
1 Introduction
Reconstructions of past glacier mass loss are of interest for several reasons: they help constrain the budget of past sea-level change (e.g., Gregory et al., 2013); they can contribute to the understanding of the magnitude of natural (internal and forced) climate
15
variability, and to isolating the anthropogenic signal in the climate system (Marzeion et al., 2014). Confidence in projections of future glacier change can also be increased by the reproduction of past glacier mass loss as a benchmark.
However, this requires an understanding of past glacier mass loss and the uncertainties involved in the reconstruction, and obtaining uncertainty estimates that
20
are robust in time and space is very hard for each individual reconstruction method. If the reconstruction is based on observations (both direct and geodetic mass change observations, as well as glacier length change observations, e.g., Cogley, 2009; Leclercq et al., 2011) the uncertainty will be fundamentally governed by the sparse and probably unrepresentative sampling of observations from the entirety of the
25
TCD
9, 3807–3820, 201520th century glacier mass loss estimates
consistent
B. Marzeion et al.
Title Page
Abstract Introduction
Conclusions References
Tables Figures
◭ ◮
◭ ◮
Back Close
Full Screen / Esc
Printer-friendly Version Interactive Discussion
Discussion
P
a
per
|
Discussion
P
a
per
|
Discussion
P
a
per
|
Discussion
P
a
per
|
representative of the global mean for periods where global observations exist (i.e., for the satellite period; but note that remotely sensed data, e.g., Gardner et al., 2013, also have considerable uncertainty that can be hard to break down to the level of individual glaciers). But neither is the sampling constant in time, nor can we assume that a sample of glaciers representative of the global mean now has been so in the past, or will be so
5
in the future. If, in order to extend the period of observations, glacier length changes are used as a proxy for glacier volume change (Oerlemans et al., 2007; Leclercq et al., 2011), uncertainty in the relation between glacier length and volume is added to the sampling uncertainty.
Reconstructions based on modeling glacier change as a response to past observed
10
(or modeled) climate change (e.g., Marzeion et al., 2012) carry some of the uncertainty from direct glacier mass change measurements (of individual glaciers; if all of the world’s glaciers are modeled individually, the potential sampling bias is not carried on). More importantly, the errors of the glacier model can only be determined at times (typically, the second half of the 20th century) and places where glacier mass change
15
was measured (many observations from Europe, but few from heavily glacierized regions). This implies that generally speaking, the reconstructed climate used to force the glacier model is based on an above-average quality and density of atmospheric observations around those glaciers where the uncertainty estimate is obtained. Since there is no practical way to estimate the impact of spatial and temporal deterioration of
20
climate reconstructions on glacier mass balance error, it is reasonable to assume that even model validation techniques that estimate uncertainty outside of the calibration sample (such as cross validation) will underestimate the glacier model uncertainty. The same argument can be made regarding the quality of glacier outlines and hypsometries (Marzeion et al., 2012).
25
These considerations show that it is not surprising that reconstructions of glacier mass loss tend to agree better within the second half of the 20th century than in earlier times (see Fig. 1), and they illustrate the benefit of a comparison of reconstructions
TCD
9, 3807–3820, 201520th century glacier mass loss estimates
consistent
B. Marzeion et al.
Title Page
Abstract Introduction
Conclusions References
Tables Figures
◭ ◮
◭ ◮
Back Close
Full Screen / Esc
Printer-friendly Version Interactive Discussion
Discussion
P
a
per
|
Discussion
P
a
per
|
Discussion
P
a
per
|
Discussion
P
a
per
|
their uncertainties, the higher the confidence in their robustness – irrespective of the shortcomings of the individual uncertainty estimates.
Here we present revisions and updates of previously published estimates of past glacier mass loss. We consider all glaciers outside of the Antarctic periphery, i.e. we include glaciers in the periphery of the Greenland ice sheet. We discuss the revisions
5
and updates for each of the methods in Sect. 2 and show and discuss the results in Sect. 3.
2 Revisions and updates of reconstructions
2.1 Direct and geodetic observations
Cogley (2009) introduced a global mass-balance compilation that included geodetic
10
as well as direct measurements. The compilation, available at http://people.trentu. ca/~gcogley/glaciology/glglmbal.htm, has been updated several times. Gardner et al. (2013, see also Vaughan et al., 2013) found inconsistencies between regional and global mass changes obtained with measurements from release 1202 of the compilation and those obtained by orbital altimetry and gravimetry. Substantial
15
additions of geodetic and especially regional-scale geodetic measurements were made in release 1203 and carried over to release 1301. Marzeion et al. (2014) relied on release 1301 and found less negative balances than those obtained with release 1202. In particular, the inconsistency reported for 2003–2009 by Gardner et al. (2013) was somewhat reduced. It is further reduced in the present study by the exclusion
20
of the Antarctic periphery, where measurements are few and in consequence the interpolation algorithm of Cogley (2009) yields unrealistically negative estimates of mass balance.
To illustrate the improvement of coverage in release 1301 relative to release 1202, over 1960–2012 the number of years of measured mass balance increased by 21 %
25
TCD
9, 3807–3820, 201520th century glacier mass loss estimates
consistent
B. Marzeion et al.
Title Page
Abstract Introduction
Conclusions References
Tables Figures
◭ ◮
◭ ◮
Back Close
Full Screen / Esc
Printer-friendly Version Interactive Discussion
Discussion
P
a
per
|
Discussion
P
a
per
|
Discussion
P
a
per
|
Discussion
P
a
per
|
geodetic measurements (increased by 28 %) rather than by new direct measurements (increased by 5 %).
Thus the density of temporal coverage is improved by the incorporation of geodetic mass-balance measurements, which also improve spatial coverage. However because most geodetic measurements are multi-annual they tend to suppress interannual
5
variability in regional and global estimates. This cost is offset to some extent by allowing
explicitly for it in the calculation of uncertainties (as in Cogley, 2009), and also by calculating pentadal rather than annual averages.
2.2 Reconstruction based on glacier length changes
Leclercq et al. (2011) extended the observation period of direct and geodetic
10
observations (Cogley, 2009) with observations of glacier length changes to reconstruct the glacier mass loss over the last two centuries. They used records of length change of 349 glaciers, distributed over 13 regions. To convert observed length change to global glacier mass change, the normalized glacier length changes were averaged to a global mean and then scaled to get a normalized global volume change. This normalized
15
global volume change was translated into glacier mass change by calibration against the global glacier mass loss over the period 1950–2005 based on Cogley (2009).
Note that the results presented in this paper as Leclercq et al. (2011) differ from the
published results, as we here consider only glaciers outside of the Antarctic periphery. The conversion of the results for global glacier mass loss to glacier mass loss excluding
20
the Antarctic periphery is straightforward as the mass loss of the Antarctic periphery in Leclercq et al. (2011) was based on upscaling the estimate for the rest of the world.
Here, we make use of additional data on both glacier length changes (Leclercq et al., 2012, 2014) and direct and geodetic mass changes (Cogley, 2009, release 1301). The reconstruction is now based on 456 glacier length records distributed
25
TCD
9, 3807–3820, 201520th century glacier mass loss estimates
consistent
B. Marzeion et al.
Title Page
Abstract Introduction
Conclusions References
Tables Figures
◭ ◮
◭ ◮
Back Close
Full Screen / Esc
Printer-friendly Version Interactive Discussion
Discussion
P
a
per
|
Discussion
P
a
per
|
Discussion
P
a
per
|
Discussion
P
a
per
|
glaciers. Available length-change data of glaciers in the Antarctic periphery are not considered here. The updates of the glacier length changes also made it possible to extend the reconstruction to 2010, instead of 2005, such that it now covers the period 1800–2010.
The new reconstruction presented here shows considerably more glacier mass loss
5
than the reconstruction of Leclercq et al. (2011) does. The difference can partly be
ascribed to the updated glacier length change data set. Using the updated data set the global normalised glacier change in the 1970s and 1980s (i.e. within the calibration period) is smaller than that in Leclercq et al. (2011), while it is similar before 1960. This leads to an increase of 10 mm SLE in the reconstructed 20th century glacier
10
mass loss. The cumulative mass loss over the period 1950–2005 in the updated direct and geodetic observations is higher than in the earlier release used in Leclercq et al. (2011), which leads to an additional increase in the reconstructed glacier mass loss of roughly 15 mm SLE. As discussed more extensively by Leclercq et al. (2011), the reconstruction is strongly sensitive and directly proportional to the mass loss derived
15
from direct and geodetic observations, and uncertainties related to the calibration using the direct and geodetic observations are the main cause of uncertainty in the reconstruction.
2.3 Modeled mass balances
Marzeion et al. (2012) modeled the response of each glacier contained in version 1.0 of
20
the Randolph Glacier Inventory (RGIv1.0, Arendt et al., 2014) based on gridded climate observations (CRU CL 2.0 and CRU TS 3.0, New et al., 2002; Mitchell and Jones, 2005). Terminus elevation, mean elevation, and maximum elevation of the glaciers were derived from version 2 of the ASTER global digital elevation model (GDEMv2). Here, we update their reconstruction to RGIv4.0 and CRU TS 3.22 (Harris et al., 2014).
25
For the purpose of glacier modeling, the most significant difference between the
CRU TS 3.0 and CRU TS 3.22 data sets is the extension of the covered time period
TCD
9, 3807–3820, 201520th century glacier mass loss estimates
consistent
B. Marzeion et al.
Title Page
Abstract Introduction
Conclusions References
Tables Figures
◭ ◮
◭ ◮
Back Close
Full Screen / Esc
Printer-friendly Version Interactive Discussion
Discussion
P
a
per
|
Discussion
P
a
per
|
Discussion
P
a
per
|
Discussion
P
a
per
|
mass loss also within the 20th century as a response to the updated climate forcing
(globally a reduced mass loss), they are very small compared to the effects of updating
from RGIv1.0 to RGIv4.0, and associated changes to the glacier model.
Along the northern boundary of the coverage of the GDEMv2, we discovered elevation errors of several hundred meters, often covering several square kilometers
5
(probably cloud tops misclassified as land surface), that impacted the terminus, mean, and maximum elevation calculations in Marzeion et al. (2012). These elevation errors led to overestimates of the elevation range of some glaciers, and therefore to overestimates of the solid precipitation, for which a lapse rate of 3 %/100 m elevation was assumed. This, through the calibration procedure, produced too high temperature
10
sensitivities of the affected glaciers. The region affected most strongly by these errors
was the Russian Arctic, with some significant effects also in Svalbard and the northern
periphery of Greenland. RGI v4.0 contains hypsometry data for almost all glaciers, and avoids the GDEMv2 errors by either considering other topographic data sets, or by filtering. For some regions, there were considerable changes to the glacier outlines
15
themselves, most notably resulting in an increase in glacier area of 48 % for the Greenland periphery, and a decrease in glacier area of 53 % in the Low Latitudes.
For detailed information on the differences between RGIv1.0 and RGIv4.0 see Arendt
et al. (2014).
3 Results
20
3.1 Global scale
The lowered temperature sensitivities of the glaciers affected by the elevation error
TCD
9, 3807–3820, 201520th century glacier mass loss estimates
consistent
B. Marzeion et al.
Title Page
Abstract Introduction
Conclusions References
Tables Figures
◭ ◮
◭ ◮
Back Close
Full Screen / Esc
Printer-friendly Version Interactive Discussion
Discussion
P
a
per
|
Discussion
P
a
per
|
Discussion
P
a
per
|
Discussion
P
a
per
|
reconstruction based on climate observations (Fig. 1a and Table 1). The differences
are greatest in the first half of the 20th century1.
The revised mass change reconstruction based on glacier length change shows higher mass loss during the 20th century than in Leclercq et al. (2011), leading to an agreement (within their respective uncertainties) of the reconstructions based on
5
glacier length change and climate observations, throughout the entire length of their overlapping periods. There is also agreement of the pentadal, global mean rates of glacier mass change (Fig. 1b) of the revised reconstructions, as well as for the 2003– 2009 period (Fig. 1c), for which altimetric and gravimetric data give relatively tight uncertainty constraints for several strongly glaciated regions (Gardner et al., 2013).
10
Even though the uncertainty ranges are still relatively large, this result indicates that
the different reconstruction methods are converging as more and higher quality data
are becoming available. This increases confidence in their viability.
Strictly speaking, the three reconstructions considered here are not independent over the entire time, because (i) the glacier length-based estimate of Leclercq et al.
15
(2011) is calibrated globally using the direct and geodetic mass change observations of Cogley (2009), and (ii) the estimate based on climate observations of Marzeion et al. (2012) is calibrated using direct mass change observations on 255 glaciers that also enter Cogley (2009). The practical limitations caused by this dependence are minor, as can be seen in Fig. 1b: even though the validation in Marzeion et al. (2012) does not
20
indicate a model bias on those glaciers that enter Cogley (2009), the regional mean estimates of the two methods are strongly divergent in some regions, which would not be possible if the dependence was strong.
1
TCD
9, 3807–3820, 201520th century glacier mass loss estimates
consistent
B. Marzeion et al.
Title Page
Abstract Introduction
Conclusions References
Tables Figures
◭ ◮
◭ ◮
Back Close
Full Screen / Esc
Printer-friendly Version Interactive Discussion
Discussion
P
a
per
|
Discussion
P
a
per
|
Discussion
P
a
per
|
Discussion
P
a
per
|
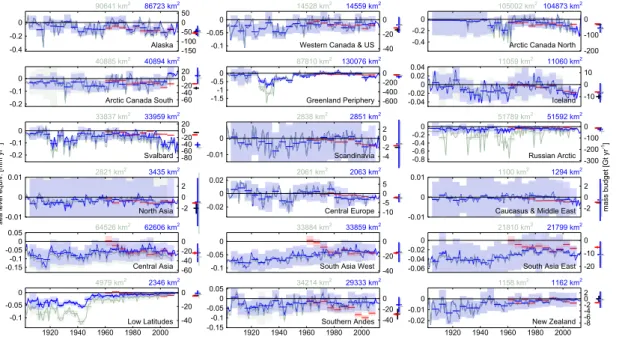
3.2 Regional scale
While the agreement of the reconstructions on the global scale is clearly improved, the comparison of the climate observation-based reconstruction with the results of
Gardner et al. (2013) still shows considerable differences on the regional scale, and
the improvement through the revision of the reconstruction is marginal. The changes
5
are greatest in the Russian Arctic. There are also considerable changes in Greenland and Svalbard (in those three cases, due to the corrected elevation errors), and in the Low Latitudes (due to the strongly reduced glacier area in RGIv4.0). These regions, especially Greenland (Fig. 2), accounted for much of the rapid mass loss simulated for 1930–1935 by Marzeion et al. (2012), and this excursion is now more subdued. In all
10
other regions, the effects of the revision are negligible, and the strong disagreement
during the 2003–2009 period particularly in Svalbard, the Canadian Arctic, and the Southern Andes is not resolved.
4 Conclusions
Additional glacier length data (Leclercq et al., 2012, 2014), updates of the RGI
15
(Arendt et al., 2014) and associated corrections of errors in glacier elevation data, additional more extensive geodetic measurements of glacier mass change, and extensions of gridded climate observations (Harris et al., 2014) encouraged us to revise reconstructions of 20th century glacier mass change. These revisions lead to results that are consistent with each other on the global scale, and on all common time scales.
20
Inconsistencies remain in the recent past (2003–2009) on the regional scale between our reconstructions and a consensus estimate that relies strongly on altimetric and gravimetric data (Gardner et al., 2013), particularly in Arctic regions.
The newly-achieved consistency between the two reconstructions may simply mean that they are consistently wrong, such that future improvements in observations of
25
TCD
9, 3807–3820, 201520th century glacier mass loss estimates
consistent
B. Marzeion et al.
Title Page
Abstract Introduction
Conclusions References
Tables Figures
◭ ◮
◭ ◮
Back Close
Full Screen / Esc
Printer-friendly Version Interactive Discussion
Discussion
P
a
per
|
Discussion
P
a
per
|
Discussion
P
a
per
|
Discussion
P
a
per
|
as well as model formulation may lead to different estimates of 20th century glacier
mass loss. But the strongest evidence for this argument, namely the discrepancy with altimetric and gravimetric estimates during 2003–2009, is now less strong, as seen in Fig. 1c and Table 1.
Acknowledgements. This work was funded by the Austrian Science Fund (FWF): P22443-N21
5
and P25362-N26, and supported by the Austrian Ministry of Science BMWF as part of the UniInfrastrukturprogramm of the Focal Point Scientific Computing at the University of Innsbruck. P. W. Leclercq acknowledges funding by the European Research Council under the European Union’s Seventh Framework Programme (FP/2007-2013)/ERC grant agreement no. 320816.
References 10
Arendt, A., Bliss, A., Bolch, T., et al.: Randolph Glacier Inventory – A Dataset of Global Glacier Outlines: Version 4.0, Global Land Ice Measurements from Space, Boulder Colorado, USA, Digital Media, 2014. 3812, 3813, 3815
Cogley, J. G.: Geodetic and direct mass-balance measurements: comparison and joint analysis, Ann. Glaciol., 50, 96–100, doi:10.3189/172756409787769744, 2009. 3808, 3810, 3811,
15
3814
Gardner, A. S., Moholdt, G., Cogley, J. G., Wouters, B., Arendt, A. A., Wahr, J., Berthier, E., Hock, R., Pfeffer, W. T., Kaser, G., Ligtenberg, S. R. M., Bolch, T., Sharp, M. J., Hagen, J. O., van den Broeke, M. R., and Paul, F.: A reconciled estimate of glacier contributions to sea level rise: 2003 to 2009, Science, 340, 852–857, doi:10.1126/science.1234532, 2013. 3809,
20
3810, 3814, 3815
Gregory, J. M., White, N. J., Church, J. A., Bierkens, M. F. P., Box, J. E., van den Broeke, M. R., Cogley, J. G., Fettweis, X., Hanna, E., Huybrechts, P., Konikow, L. F., Leclercq, P. W., Marzeion, B., Oerlemans, J., Tamisiea, M. E., Wada, Y., Wake, L. M., and van de Wal, R. S.: Twentieth-century global-mean sea-level rise: is the whole greater than the sum of the
25
parts?, J. Climate, 26, 4476–4499, doi:10.1175/JCLI-D-12-00319.1, 2013. 3808
TCD
9, 3807–3820, 201520th century glacier mass loss estimates
consistent
B. Marzeion et al.
Title Page
Abstract Introduction
Conclusions References
Tables Figures
◭ ◮
◭ ◮
Back Close
Full Screen / Esc
Printer-friendly Version Interactive Discussion
Discussion
P
a
per
|
Discussion
P
a
per
|
Discussion
P
a
per
|
Discussion
P
a
per
|
Leclercq, P. W., Oerlemans, J., and Cogley, J. G.: Estimating the glacier contribution to sea-level rise for the period 1800–2005, Surv. Geophys., 32, 519–535, doi:10.1007/s10712-011-9121-7, 2011. 3808, 3809, 3811, 3812, 3814
Leclercq, P. W., Weidick, A., Paul, F., Bolch, T., Citterio, M., and Oerlemans, J.: Brief communication ”Historical glacier length changes in West Greenland”, The Cryosphere, 6,
5
1339–1343, doi:10.5194/tc-6-1339-2012, 2012. 3811, 3815
Leclercq, P. W., Oerlemans, J., Basagic, H. J., Bushueva, I., Cook, A. J., and Le Bris, R.: A data set of worldwide glacier length fluctuations, The Cryosphere, 8, 659–672, doi:10.5194/tc-8-659-2014, 2014. 3811, 3815
Marzeion, B., Jarosch, A. H., and Hofer, M.: Past and future sea-level change from the surface
10
mass balance of glaciers, The Cryosphere, 6, 1295–1322, doi:10.5194/tc-6-1295-2012, 2012. 3809, 3812, 3813, 3814
Marzeion, B., Cogley, J. G., Richter, K., and Parkes, D.: Attribution of global glacier mass loss to anthropogenic and natural causes, Science, 345, 919–921, doi:10.1126/science.1254702, 2014. 3808, 3810
15
Mitchell, T. D. and Jones, P. D.: An improved method of constructing a database of monthly climate observations and associated high-resolution grids, Int. J. Climatol., 25, 693–712, doi:10.1002/joc.1181, 2005. 3812
New, M., Lister, D., Hulme, M., and Makin, I.: A high-resolution data set of surface climate over global land areas, Clim. Res., 21, 1–25, doi:10.3354/cr021001, 2002. 3812
20
Oerlemans, J., Dyurgerov, M., and van de Wal, R. S. W.: Reconstructing the glacier contribution to sea-level rise back to 1850, The Cryosphere, 1, 59–65, doi:10.5194/tc-1-59-2007, 2007. 3809
Vaughan, D., Comiso, J., Allison, I., Carrasco, J., Kaser, G., Kwok, R., Mote, P., Murray, T.,
Paul, F., Ren, J., Rignot, E., Solomina, O., Steffen, K., and Zhang, T.: Observations:
25
cryosphere, in: Climate Change 2013: the Physical Science Basis. Contribution of Working Group I to the Fifth Assessment Report of the Intergovernmental Panel on Climate Change, edited by: Stocker, T., Qin, D., Plattner, G.-K., Tignor, M., Allen, S., Boschung, J., Nauels, A., Xia, Y., Bex, V., and Midgley, P., Cambridge University Press, Cambridge, UK, New York, NY, USA, 317–382, 2013. 3810
TCD
9, 3807–3820, 201520th century glacier mass loss estimates
consistent
B. Marzeion et al.
Title Page
Abstract Introduction
Conclusions References
Tables Figures
◭ ◮
◭ ◮
Back Close
Full Screen / Esc
Printer-friendly Version Interactive Discussion
Discussion
P
a
per
|
Discussion
P
a
per
|
Discussion
P
a
per
|
Discussion
P
a
per
|
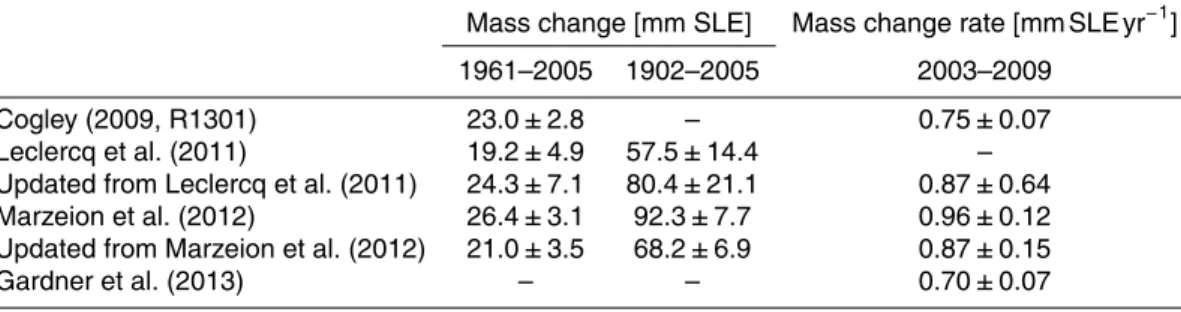
Table 1.Globally integrated glacier mass change reconstructions. Note that all reconstructions exclude glaciers in the Antarctic periphery.
Mass change [mm SLE] Mass change rate [mm SLE yr−1
]
1961–2005 1902–2005 2003–2009
Cogley (2009, R1301) 23.0±2.8 – 0.75±0.07
Leclercq et al. (2011) 19.2±4.9 57.5±14.4 –
Updated from Leclercq et al. (2011) 24.3±7.1 80.4±21.1 0.87±0.64
Marzeion et al. (2012) 26.4±3.1 92.3±7.7 0.96±0.12
Updated from Marzeion et al. (2012) 21.0±3.5 68.2±6.9 0.87±0.15
TCD
9, 3807–3820, 201520th century glacier mass loss estimates
consistent
B. Marzeion et al.
Title Page
Abstract Introduction
Conclusions References
Tables Figures
◭ ◮
◭ ◮
Back Close
Full Screen / Esc
Printer-friendly Version Interactive Discussion
Discussion
P
a
per
|
Discussion
P
a
per
|
Discussion
P
a
per
|
Discussion
P
a
per
|
b
seac
levelc
eq
uiv.
c[
mmc
yr
-1 ]
year
1910 1920 1930 1940 1950 1960 1970 1980 1990 2000 2010 -2
-1 0
massc
budg
et
c[
G
tc
yr
-1]
2003-2009
c -800
-600 -400 -200 0
seac
levelc
eq
uiv.
c[
mm]
a
1910 1920 1930 1940 1950 1960 1970 1980 1990 2000 2010
0 50 100
massc
budg
et
c[
10
3 G
t]
0 10 20 30
updatedcfromcMarzeioncetcal.c)2012C Marzeioncetcal.c)2012C
Cogleyc)2009LcR1301C Leclercqcetcal.c)2011C
updatedcfromcLeclercqcetcal.c)2011C Gardnercetcal.c)2013LcpanelccC
Figure 1.Globally integrated glacier mass change;(a)accumulated in time, relative to the year
2000; (b) pentadal mean values of mass loss rates; (c) mean mass loss rates during 2003
TCD
9, 3807–3820, 201520th century glacier mass loss estimates
consistent
B. Marzeion et al.
Title Page Abstract Introduction Conclusions References Tables Figures ◭ ◮ ◭ ◮ Back Close
Full Screen / Esc
Printer-friendly Version Interactive Discussion Discussion P a per | Discussion P a per | Discussion P a per | Discussion P a per | Alaska 867LwNkmL 9E6ZMNkmL ]ERZ ]ERL E ]M5E ]MEE ]5E E 5E WesternNCanadaNpNUS MZ559NkmL MZ5L8NkmL ]ERM ]ERE5 E ]ZE ]LE E ArcticNCanadaNNorth MEZ87wNkmL ME5EELNkmL ]ERZ ]ERL E ]LEE ]MEE E ArcticNCanadaNSouth ZE89ZNkmL ZE885NkmL ]ERL ]ERM E ]6E ]ZE ]LE E LE GreenlandNPeriphery MwEE76NkmL 878MENkmL ]MR5 ]M ]ER5 E ]6EE ]ZEE ]LEE E Iceland MME6ENkmL MME59NkmL ]EREZ ]EREL E EREL EREZ ]ME E ME Svalbard seaN levelN eq uivR N[ mmN yr ]M] ww959NkmL ww8w7NkmL ]ERL ]ERM E ]8E ]6E ]ZE ]LE E LE Scandinavia L85MNkmL L8w8NkmL ]EREM E ]Z ]L E L RussianNArctic 5M59LNkmL 5M789NkmL ]ER8 ]ER6 ]ERZ ]ERL E massN budg et N[ G tN yr ]M] ]wEE ]LEE ]MEE E NorthNAsia wZw5NkmL L8LMNkmL ]EREM E EREM ]L E L CentralNEurope LE6wNkmL LE6MNkmL ]EREL E EREL ]ME ]5 E 5 CaucasusNpNMiddleNEast ML9ZNkmL MMEENkmL ]EREM E EREM ]L E L CentralNAsia 6L6E6NkmL 6Z5L6NkmL ]ERM5 ]ERM ]ERE5 E ERE5 ]6E ]ZE ]LE E SouthNAsiaNWest ww859NkmL ww88ZNkmL ]ERM ]ERE5 E ]ZE ]LE E SouthNAsiaNEast LM799NkmL LM8MENkmL ]ERE6 ]EREZ ]EREL E ]LE ]ME E LowNLatitudes LwZ6NkmL Z979NkmL
M9LE M9ZE M96E M98E LEEE ]ERM ]ERE5 E ]ZE ]LE E SouthernNAndes year L9wwwNkmL wZLMZNkmL
M9LE M9ZE M96E M98E LEEE ]ERM5 ]ERM ]ERE5 E ERE5 ]ZE ]LE E NewNZealand MM6LNkmL MM58NkmL
M9LE M9ZE M96E M98E LEEE ]EREL ]EREM E ]8 ]6 ]Z ]L E L