Abstract—The term microfibril angle (MFA) in wood refers to the angle between the spiralling cellulose fibrils and the long axis of the tracheid cell wall. Diffraction patterns arising from crystal planes of various sample forms of wood trees had attracted scientific research in determining the crystallographic measurements. Acacia mangium classified as a hardwood was chosen for experimental data. Age-contributing factors were measured; the angle of reflection (θ), relative intensity, full width at half maximum (FWHM), the nearest between two neighbouring atoms in the crystalline structure (d-spacing) and the peak height, had been taken into account at different ages, pith and bark of tree. Regressions were done in comparing the microfibril angle, MFA at different ages using the least-square method and cubic-spline interpolation. The latter was able to interpolate a polynomial up to the third order. The range of the optimum angle was found to have benefited foresters in deciding the time for tree cropping and harvesting.
Index Terms—Crystallographic factors, regression model, interpolation, microfibril angle, optimum angle.
I. INTRODUCTION
he composition and orientation of fibres in the cell wall change as a function of age and growth rate. Likewise, tracheid length changes with age and may be a function of fibre orientation in the primary wall. fibre orientation may be an important factor determining cell length since the cellulosic matrix is formed perpendicular to the cellulose chain [5]. Similarly, development of the secondary wall (S2 layer) during cell wall thickening occurs in the plane perpendicular to fibre orientation. In the S2 layer, polymer alignment is less variable when compared to the primary wall with microfibrils showing a high degree of order from lamella to lamella [8].
Mitchell [12] had reported that density could be made a general predictor of various paper making properties, for example, machining and drying; thus influencing timber
First Author is Tamer A. Tabet. Forest Plantation and Agroforestry Program, School of International Tropical Forestry, Universiti Malaysia Sabah, e.mail: [email protected],my. Tel: 006-088-320000 ext:8593
Second Author Mathematics with Economics Programme, School of Science and Technology Universiti Malaysia Sabah, 88400 Kota Kinabalu, Sabah, E-mail:[email protected]
Third Author is Physics Department, Centre for Defence Foundation Studies, National Defence University of Malaysia (NDUM), Kem Sg. Besi 57000 Kuala Lumpur, Malaysia [email protected]
usage [2]. Tree density varies from pith to bark and with height of the stem while wood density varies from earlywood tissue to latewood tissue within each annual ring. Latewood tissue consisting of cells of relatively small radial diameter having a thick wall and small lumen was found to have a higher density than thin wall earlywood cells with a large cell lumen [7]. MFA has been found to influence shrinkage and swelling in Acacia mangium wood [13].
MFA also had a significant impact on wood quality and paper properties; smaller angles were associated with high tensile strength while larger angles were associated with larger stretch and tear indices. It was also known to be inversely related to fiber length, with longer fibers having smaller angles [5]. Wood stiffness was found to be influenced by MFA which arose from the cellulose content [13], [3]. As MFA increased, both the Young’s modulus i.e. stiffness and tensile strength decreased [4]. Young trees and branches would feature high MFAs while older trees would have low MFAs indicating maximum stiffness [10].
II. MATERIALSANDMETHODS
A. Data Collection
The wood samples used in this study were taken from 3, to 15 year-old of Acacia mangium tree from Sabah Forestry Development Authority (SAFODA), Sabah Malaysia. Two sets of tree growth ages of 3, 5, 7, 9 and 10 year-olds and of 11, 13 and 15 year-olds were selected respectively from these plantation sites.
B. MFA Sampling Method
Samples of wood for MFA test were cut out from each tree at breast height (bh). Wood samples taken from pith, heartwood and bark regions were cut at 40cm high for each wood disc, following the standard methodology for the physical characterization of the International Technical Standard (ISO standards 4471-1982). A tangential section was then taken from this 40cm disc. A block of dimensions approximately 60 mm high x 40 mm width was cut from the pith and bark region of this section and then smaller blocks at different (β) angles: 0°, 10°, 15°, 20°, 30°, 35°, 40°, 45°,50° and 90° ± 0.5° were cut with respect to the vertical axis of the wood section. Radial slices of 20mm x 10mm x 200µm were cut by means of sliding microtome for MFA measurements using XRD and SAXS. Wood Tissues from pith and bark regions were cut accurately with different thicknesses of 20, 30, 40, 50 and 60µm ± 0.5µm using rotary microtome, LEIC RM. These wood tissues had been used for Scanning Electron Microscope (SEM), Atomic
Modeling Microfibril Angle and Tree Age in
Acacia
Mangium
Wood using X-Ray Diffraction
Technique
Tamer A. Tabet and Fauziah Abdul Aziz
Force Microscope (AFM) and Optical Microscope for 3D surface measurement (Infiniti Focus) test.
C. Experimental Calculations
The MFA is determined from the intensity that has the strongest peak. The intensity peak is used to calculate the parameter T for all growth ages because the peak of the diffraction intensity gives the best Full Width Half Maximum (FWHM). MFA in the secondary layer of the cell wall was estimated from the FWHM for each reflection using Meylan’s formula [11]. The FWHM is related to the intensity and can be related to the parameter T as in (1):
T
T
FWHM
2
ln(
2
)
1
.
1774
(1) This formula was further developed by [9] to calculate the value of T and hence, MFA using the Meylan’s formula [11] and [6].MFA = 0.6 T = 1.9623 FWHM (2)
D. Mathematical Formulation of Regression Models
Regression models, being a global process, are used to predict one variable from one or more other variables. If regression is used to predict the value a dependent variable and for estimating the values of model parameters, interpolation is used fundamentally as a local procedure which forces the error to be zero at specific, isolated location.
E. Linear Regression (LR) using the Least-Square (LS) Method
Linear regression models using LS method is used to model numerical data obtained from observations so as to get an optimal fit of the data by minimizing the sum of the square of the residuals. The strength of association between the variables is measured by the Pearson correlation coefficient, r has given by (3):-
r =
n i n i i i n i i n i i n i n i i i n i i in
Y
Y
n
X
X
n
Y
X
Y
X
1 2 1 2 2 1 1 2 1 1 1 (3) Were, X, Y = the variables that are being comparedn = sample size
Linear regression model (2) is thus used to regress the amount of the criterion variable with respect to the
regressors, K = the number of regressors and X1, X2, X3 =
the regressors variables.
The proportion of the total variability in MFA, Y, attributable to the dependence of Y on all the regressors would be measured by the adjusted coefficient of multiple determinations (5),
R
a2.
)
(
1
2Total
MS
MSE
R
a
(5)Where, MSE = mean sum of squares of error MS (Total) = mean sum of squares of total
Since in regression, the adjusted R2 coefficient of determination is a statistical measure about the goodness of fit of a model, that is, of how well the regression line approximates the real data points. An adjusted R2 of 1.0 would indicate that the regression line perfectly fits the data. The predictors are calculated by ordinary least-squares regression, that is, by minimising SSerr.
F. Cubic-SPline Interpolation
The splines are superior to higher-order interpolating polynomials where mth derivatives are continuous at the data points. In this study, cubic spline interpolation was used to derive a third-order polynomial as shown in equation 6.
i i i i
i
x
a
x
b
x
c
x
d
f
(
)
3
2
(6)At data points where two splines meet (then it is called a knot) the slope changes abruptly. As for n +1 data points (i = 1, 2, …, n), there are n intervals and hence, 4n unknown constants to evaluate from 4n conditions. These conditions are:
a) The function values must be equal at the interior knots.
b) The first and last functions must pass through the end points.
c) The first derivatives at the interior knots must be equal.
d) The second derivatives at the interior knots must be equal.
e) The second derivatives at the end knots are zero.
G. Statistical Analysis
The data were run using Statistical Package for Social Sciences (SPSS) version 12 for the statistical analysis and Maple version 12.0 was utilised for graphical representation of Intensity (2 Theta) versus FWHM.
III. RESULTS
Figure 1. Cubic Splines and Linear Regression for 3 year-old tree.
Figure 2. Cubic Splines and Linear Regression for 7 year-old tree.
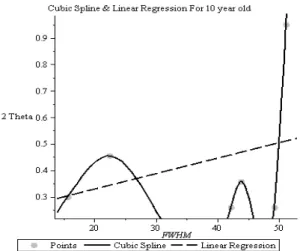
Figure 3. Cubic Splines and Linear Regression for 10 year-old tree.
Figure 4. Cubic Splines and Linear Regression for 13 year-old tree.
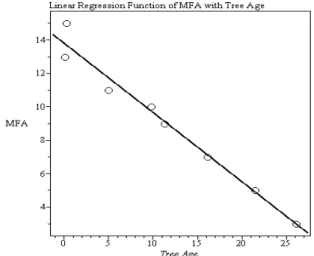
Figure 6. Simple Linear Regression of MFA and tree Age. \
TABLE 1
COMPARATIVE TABLE OF LR AND CS POLYNOMIALS WITH AGE OF TREE Tree
Age
Linear Regression Polynomials
Cubic Spline Polynomials
3 year old (pith)
0.5282 + 0.00015x
-3.3659 + 0.0859x-0.0702(x-43.7109)2 + 0.0095(x-43.7109)3 7 year
old (pith)
0.09415 + 0.00648x
4.27271-0.09254x+0.018185(x-43.7148)2 -0.000093977(x-43.7148)3
10 year old (pith)
0.21178 + 0.0058469x
0.27411+0.0018947x-0.055282(x-43.853) 2 +0.009639(x-43.853) 3 13
year old (pith)
0.81223-0.01072x
-4.3993+0.09592x+0.02463(x-49.2485)2 -0.0044995(x-49.2485)3
15 year old (pith)
1.02821-0.01512x
-2.34631+0.05424x+0.023678(x-49.2453) 2
+0.004347(x-49.2453)3
Comparisons of linear polynomials for Acacia mangium at different tree ages had shown that the MFA varies according to age with a small mean and variance. Using the LS method also, the regression equations of the grain size as corresponds to the regions of the trunk, gave an optimal fit of R2>0.87, indicating a strong positive relationship. The cubic splines since passing through all the observed data, practically gave a zero error distribution. However, the polynomial structure thus observed was able to indicate that as the trees mature in age, the intercept of the LR models approached the value of 1. MFA versus Age of Trees also gave a simple linear regression equation of y= 13.7915 – 0.41477 x, showing that the microfibril angle decreases in
TABLE 2
REGRESSION EQUATIONS ACCORDING TO AGES, GRAIN SIZE AND REGION OF WOOD
Grain Size
Regression Eqn (FWHM vs Age of Tree)
R2 Region
63.0 Y = 23.446-25.292x 0.9044 pith 63.0 Y = 23.292-21.385x 0.9875 bark 63.0 Y = 22.924-21.634x 0.9097 Pith-bark 150.0 Y = 23.029-29.195x 0.8759 pith 150.0 Y = 23.194-29.856x 0.9499 bark 150.0 Y = 22.781-28.157x 0.9567 Pith bark
IV. DISCUSSIONANDCONCLUSION
Third-order polynomials or cubic splines are frequently used in modelling practical problems. Employment of these models is less expensive in terms of time and/or money after identifying its structure for estimation and prediction. It is recommended that further research into MFA, hardness, density and intensity can be expounded which in turn can also be modelled, using other models such as the Generalized Linear Models (GLM) for simplicity.
ACKNOWLEDGMENT
We greatly appreciate the professional co-operation and assistance of Universiti Malaysia Sabah. We also wish to thank Universiti Putra Malaysia in accessing and using the X-Ray diffraction equipment. Finally, we would like to thank fully Universiti Kebangsaan Malaysia for the professional cooperation.
V. REFERENCES
[1] B.E.S. Gunning, & A.R. Hardham. 1982. Microtubules. Ann. Rev. Plant Physiol. 33: 651–698. Hepworth, D.G. & J.F.C. Vincent. 1998. Modeling the mechanical properties of xylem tissue from tobacco plants (Nicotiana tabacum Samsun ) by considering the importance of molecular and micromechanisms. Ann. Bot. 81: 761–770. [2] J.D. Brazier, and R.S. Howell, 1979. The Use of Breast Height Core
for Estimating Selected Whole Tree Properties of Sitka spruce. Forestry. 52(2): 177-185.
[3] I.D.Cave, I.D. and J.F.C. Walker. 1994. Stiffness of Wood in Farown Plantation Softwood: The Influence of Microfibril Angle. Forest Product Journal. 44(5): 43-48.
[4] L.A. Donaldson 1993 . Variation in Microfibril Angle among Three Genetic Groups of Pinus radiate. New Zealand Journal of Forestry Science. 25(2): 164-174.
[5] I.D, Cave, Modeling the Structure of the Softwood Cell Wall for Computation of Mechanical Properties.
Wood Science and Technology. 1976. 10:19-28.
[6] J.G. Haygreen, and J.L. Bowyer, J.L. 1996. Forest Product and Wood Science (An Introduction). 3rd Edition, pp.490.
[10] B.A. Meylan, “Measurement of Microfibril Angle by X-Ray Diffraction”, Forest Prod. Journal. 17:15-58.- 1967
[11] H.L. Mitchell & M.P. Denne,. 1997. Variation in Density of Picea sitchensis in Relation to Within Tree trends in Tracheid Diameter and Wall Thickness. Forestry, Volume 70, No.1.
[12]A. Tamer and Fauziah Aziz. 2009. Influence of Microfibril Angle on Thermal and Dynamic-Mechanical Properties of Acaciamangium Wood Using X-Ray Diffraction and Dynamics-Mechanical Test.
Journal of Nuclear and Related Technologies. Vol. 6, No. 1. P.P 71-86 (Special edition).
[13] J.C.F. Walker. and B.G. Butterfield 1996. The Importance of Microfibril Angle for the Processing Industries. New Zealand Forestry, Feb. 1996: 34-40.